6.SP statistics and probability
Question 1 of 61
2026 Practice Test B Math, question 13Question
A basket contains 3 apples, 4 oranges, 5 bananas, and 8 pears.
If one piece of fruit is randomly pulled from the basket, what is the probability that it will be a pear?
Select the place on the number line to plot the point.
On the test you click a point on the number line; here, choose it from the menu.
Show the answer
Correct answer: the point 0.4
The total number of fruits is:
The probability of picking a pear is:
Question analysis
A basket holds apples, oranges, bananas and pears, and students find the probability that a piece of fruit pulled at random is a pear, then plot it as a point on a number line from 0 to 1. It tests simple probability as a part of a whole. With no choices to pick from, the fraction has to be turned into tenths to find its place.
- Grade level
- Grade 6 content, by NYS standard
- Compared with grade 7
- Below grade 7 Finding the probability of a simple event from counts is grade 6 work in New York. This one adds four whole numbers, forms one fraction and plots it among marked tenths, a shorter and more routine task than grade 7 probability.
- Estimated difficulty
- Routine: one familiar step, little to misread.
- Thinking it demands
- Depth of knowledge 1, recall and reproduction · mainly apply
- What makes it hard
- Solution
- 3 steps
- Reading level
- Question and choices: about grade 6, 40 words.
- Students, last 30 days
- Not enough answers yet to show (it takes 10).
Why it is hard, traps and wrong answers (shows the answer)
Why it is hard
Adding the four counts to 20 and writing 8 over 20 is routine, so most students succeed. The losses come from the number line: its decimal labels make it easy to read the 8 pears as 0.8, and a part-to-part fraction such as 8/12 falls between marks and has to be rounded, which should prompt a second look. Simplifying 8/20 to 2/5 and then to 4/10 makes the mark plain.
Something you must already know minor Working it out
The question does not say that a probability is the favorable count over the whole count, here the 8 pears over all 20 pieces of fruit rather than over the other 12. (Anderson & Krathwohl, 2001)
An answer in an unexpected form minor Choosing the answer
The number line is labeled only in tenths from 0 to 1, so 8/20 has to be rewritten as a decimal before the right mark can be chosen. (Enright, Morley & Sheehan, 2002)
Strategy: Add up all the fruit for the total, write the number of pears over that total, rewrite the fraction in tenths, and select that mark on the line.
Traps
- Answers a different question: A choice is right for another quantity: the other unknown, the rest instead of the part, the part instead of the whole.
- Misunderstands the concept: A wrong belief about a concept: that percents can be added, that area grows like length, that averages can be averaged, that a bigger denominator means a bigger fraction.
The wrong answers, classified
0.8 Numbers taken from the question (Hegarty, Mayer & Monk, 1995)
Takes the 8 pears straight to the mark labeled 0.8, never dividing by the 20 pieces of fruit in the basket.
0.7 Misunderstands the concept (Smith, diSessa & Roschelle, 1993; De Bock et al., 1998; Ni & Zhou, 2005)
Compares the 8 pears with the 12 other pieces of fruit, 8/12 or about 0.67, a part-to-part ratio, and plots the nearest tenth.
0.6 Answers a different question (King et al., 2004; Hegarty, Mayer & Monk, 1995)
Puts the 12 apples, oranges and bananas over the 20 pieces of fruit, plotting the chance of not getting a pear instead of getting one.
Worked solution, step by step
Formulas used
- Probability of an event
- P is the probability, the chance that something happens. It goes from 0 (never) to 1 (always). The top counts the results you want, here pears. The bottom counts every possible result, here every piece of fruit. It works when each result is equally likely, like grabbing fruit without looking.
- Equal fractions
- a is the top of a fraction, and b is the bottom. n is any number except 0. Dividing the top and the bottom by the same number gives an equal fraction. Use it to get 10 on the bottom, which is easy to write as a decimal.
Sort out the question
The basket has 3 apples, 4 oranges, 5 bananas and 8 pears. You pull out one piece without looking. You need the probability that it is a pear. Then you plot that number as a point. The number line runs from 0 to 1, with a mark at every tenth.
Count all the fruit
The bottom of the fraction is every piece of fruit you could pull out. Add all four kinds:
There are 20 pieces of fruit in all.
Write the probability as a fraction
Use the probability formula. There are 8 pears out of 20 pieces of fruit:
Watch out: the bottom is all the fruit, not just the other fruit. compares the pears with the 12 fruits that are not pears. It is about 0.67, and it leads you to the mark at 0.7. And 12 over 20 is the chance of not getting a pear.
Change it to tenths
The number line is marked in tenths. So rewrite the fraction with 10 on the bottom. Divide the top and the bottom by 2:
Four tenths is written 0.4.
Watch out: the 8 pears do not make 0.8. That skips dividing by the 20 pieces of fruit.
Plot the point
Start at 0 and count four marks to the right: 0.1, 0.2, 0.3, 0.4. On the test, you click the mark labeled 0.4. On this site, you choose 0.4 from the menu.
So the answer is the point at 0.4.
Check your answer
The chance of not getting a pear is . A pear and not a pear cover every result, so the two must add to 1: . Also, pears are less than half of the fruit, so the point should be left of 0.5. It is.
More questions like this
The original DOE question

Question 2 of 61
2026 Practice Test C Math, question 12Question
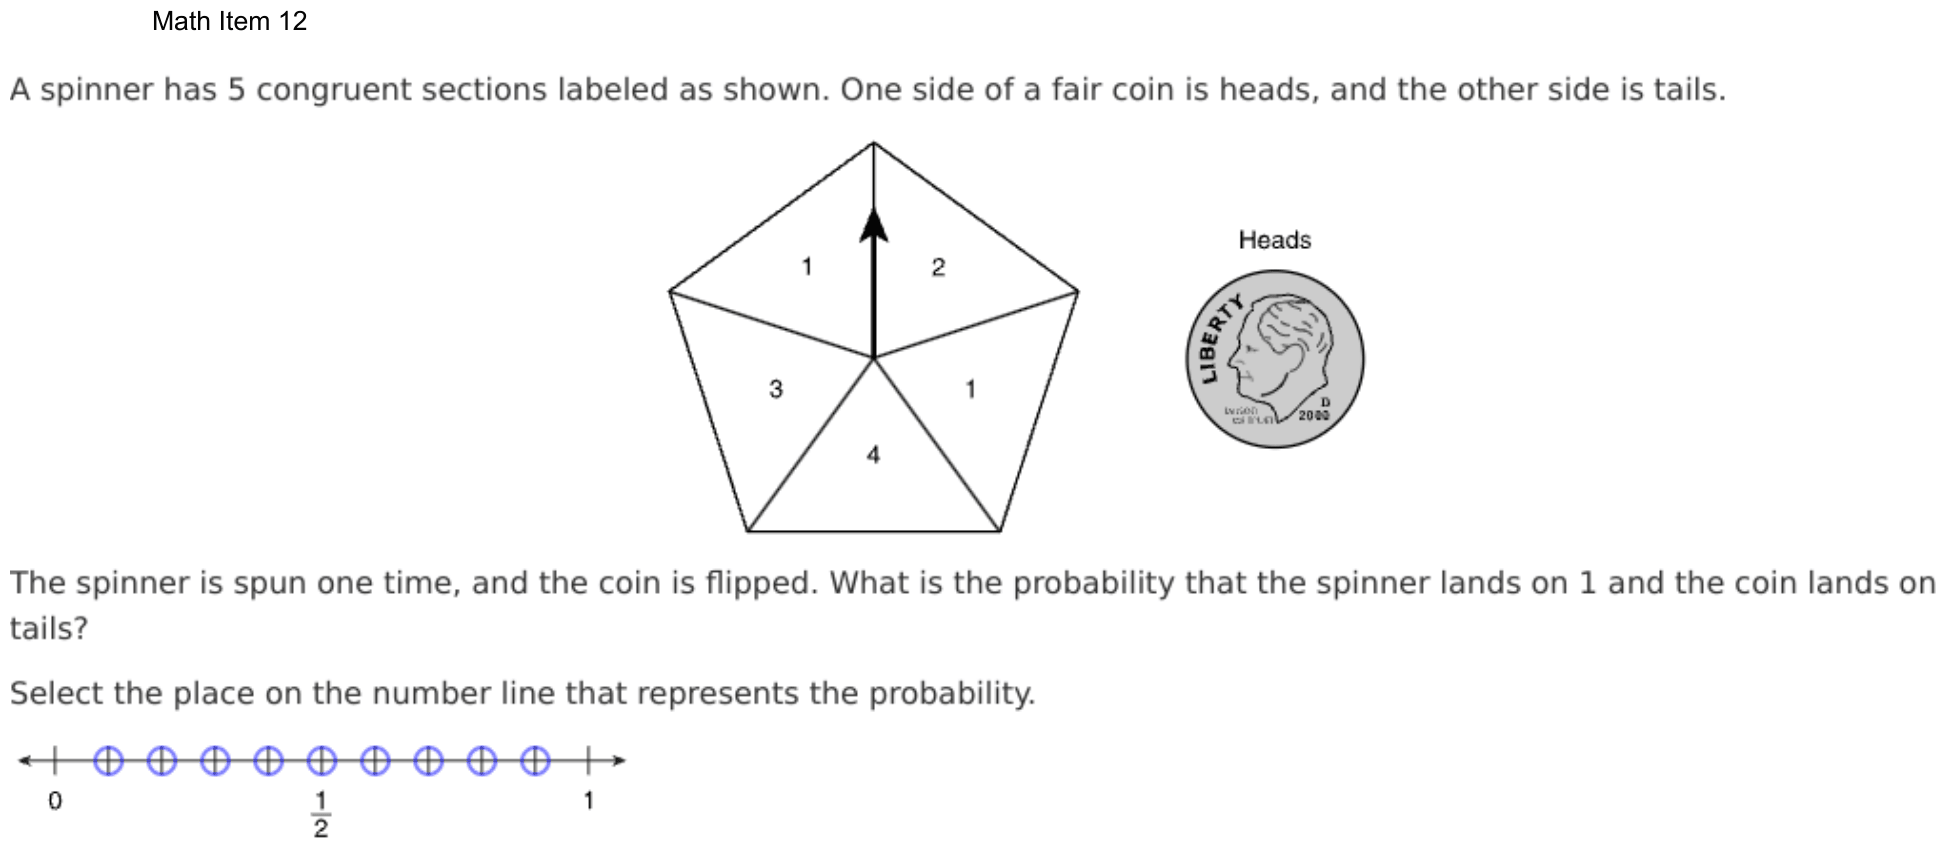
A spinner has 5 congruent sections labeled as shown. One side of a fair coin is heads, and the other side is tails.
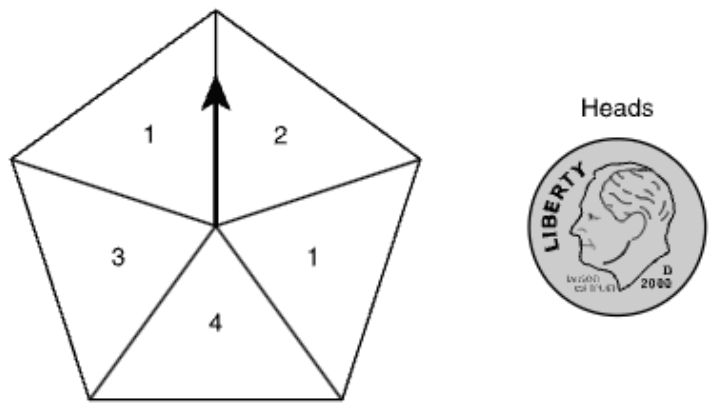
The spinner is spun one time, and the coin is flipped. What is the probability that the spinner lands on 1 and the coin lands on tails?
Select the place on the number line that represents the probability.
On the test you click a point on the number line; here, choose it from the menu.
Show the answer
Correct answer: the point 0.2
The spinner has five equal-sized sections. Two of the sections are labeled with a 1. So, the probability of landing on a 1 is two out of five, or 2/5.
A coin has two sides, one heads and one tails. So, the probability of landing on tails is one out of two, or 1/2.
The compound probability of the spinner landing on a 1 and the coin landing on tails can be calculated by multiplying 2/5 and 1/2 as shown:
Question analysis
A spinner with five equal sections is spun once and a fair coin is flipped. Students find the probability that the spinner lands on 1 and the coin shows tails, then select that point on a number line from 0 to 1. Counting the right sections and combining the two events correctly are the tricky parts.
- Grade level
- Grade 7 content, by NYS standard
- Compared with grade 7
- At grade 7 Finding the chance of two independent events together is grade 7 compound probability, here with one spinner and one coin. Counting sections from the picture and placing the result on a number line add two small steps.
- Estimated difficulty
- Moderate: several steps, or a close reading with one strong distractor.
- Thinking it demands
- Depth of knowledge 2, skills and concepts · mainly apply
- What makes it hard
- Solution
- 3 steps
- Reading level
- Question and choices: about grade 5, 59 words.
- Students, last 30 days
- Not enough answers yet to show (it takes 10).
Why it is hard, traps and wrong answers (shows the answer)
Why it is hard
The probability itself takes one multiplication of two simple fractions; the losses come before and after it. Before, the spinner has to be searched for every section labeled 1, and the coin's chance brought in as well. After, 1/5 has to be rewritten as 2/10 to find its point, since only 0, 1/2 and 1 are labeled. Checking that the result is smaller than both separate chances catches an addition.
Reading a figure, table or graph moderate Understanding the question
The two sections labeled 1, upper left and right, are not side by side, and the number line labels only 0, 1/2 and 1, so its nine points must be read as tenths. (Lesh, Post & Behr, 1987; Kirsch & Mosenthal, 1990)
Something you must already know minor Working it out
Nothing says that the chance of two independent events both happening is the product of their chances, 2/5 × 1/2, rather than their sum. (Anderson & Krathwohl, 2001)
Strategy: Count the sections labeled 1 to get the spinner's chance, take the coin's chance of tails, multiply the two because both must happen, and write the result in tenths.
Traps
- Stops one step early: A choice is a number from partway through the solution.
- Wrong operation: Adds instead of multiplying, divides the wrong way round, turns a ratio or rate upside down, or undoes a step in the wrong direction (subtracts what should be added back).
- Misreads the figure: Reads a value, label or tick spacing in a figure, table or graph wrongly.
The wrong answers, classified
0.4 Stops one step early (King et al., 2004; Gierl et al., 2017)
Finds the spinner's chance of landing on 1, two sections out of five, and plots 2/5 without multiplying by the coin's chance of tails.
0.9 Wrong operation (Hegarty, Mayer & Monk, 1995; King et al., 2004)
Adds the two chances, 2/5 + 1/2 = 9/10, instead of multiplying them, though both events must happen together.
0.1 Misreads the figure (Lesh, Post & Behr, 1987; Kirsch & Mosenthal, 1990)
Counts only one section labeled 1, so multiplies 1/5 by 1/2 and plots 1/10, missing the second 1 on the spinner.
Worked solution, step by step
Formulas used
- Probability of an event
- P is the probability, the chance that something happens. It goes from 0 (never) to 1 (always). The top counts the results you want. The bottom counts all possible results. It works when every result is equally likely, like equal sections of a spinner.
- Probability that two things both happen
- A and B are two events that do not affect each other, like a spin and a coin flip. P(A) and P(B) are their chances. Multiply them to get the chance that both happen. Needing both makes the chance smaller, never bigger.
Sort out the question
The spinner has 5 congruent sections. Congruent means the same size and shape, so each is equally likely. The coin has a heads side and a tails side. You need the chance that the spinner lands on 1 and the coin lands on tails.
Find the spinner’s chance
Two sections show 1: the upper left one and the one on the right. So 2 of the 5 equal sections give a 1:
Watch out: the two 1s are not next to each other. Counting only one gives 1/5 here, and 0.1 at the end.
Find the coin’s chance
A fair coin is equally likely to land on either side. Tails is 1 of its 2 sides:
Multiply the two chances
The spin and the flip do not affect each other, and both must happen. So multiply:
Watch out: stopping at 2/5 gives 0.4. Adding gives , or 0.9. Both are wrong.
Select the point
On the test, the number line labels only 0, 1/2 and 1. Between 0 and 1 are 9 targets, one at each tenth. 0.2 is the second target to the right of 0. On this site, choose 0.2 from the Point menu.
So the answer is the point at 0.2.
Check your answer
List every result. The spinner has 5 sections and the coin has 2 sides, so there are results, all equally likely. Just 2 of them are a 1 with tails, one for each section labeled 1. That is 2 out of 10, or 0.2.
More questions like this
The original DOE question
Question 3 of 61
2026 Practice Test C Math, question 32Question
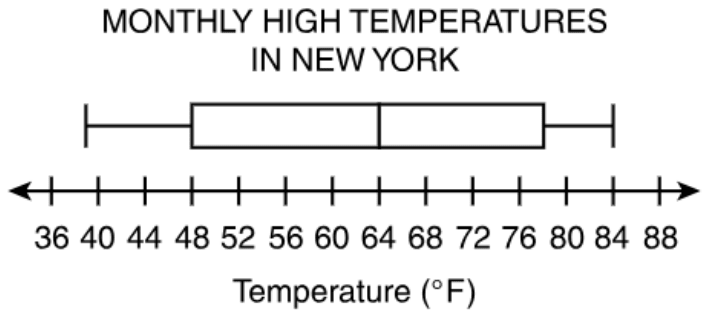
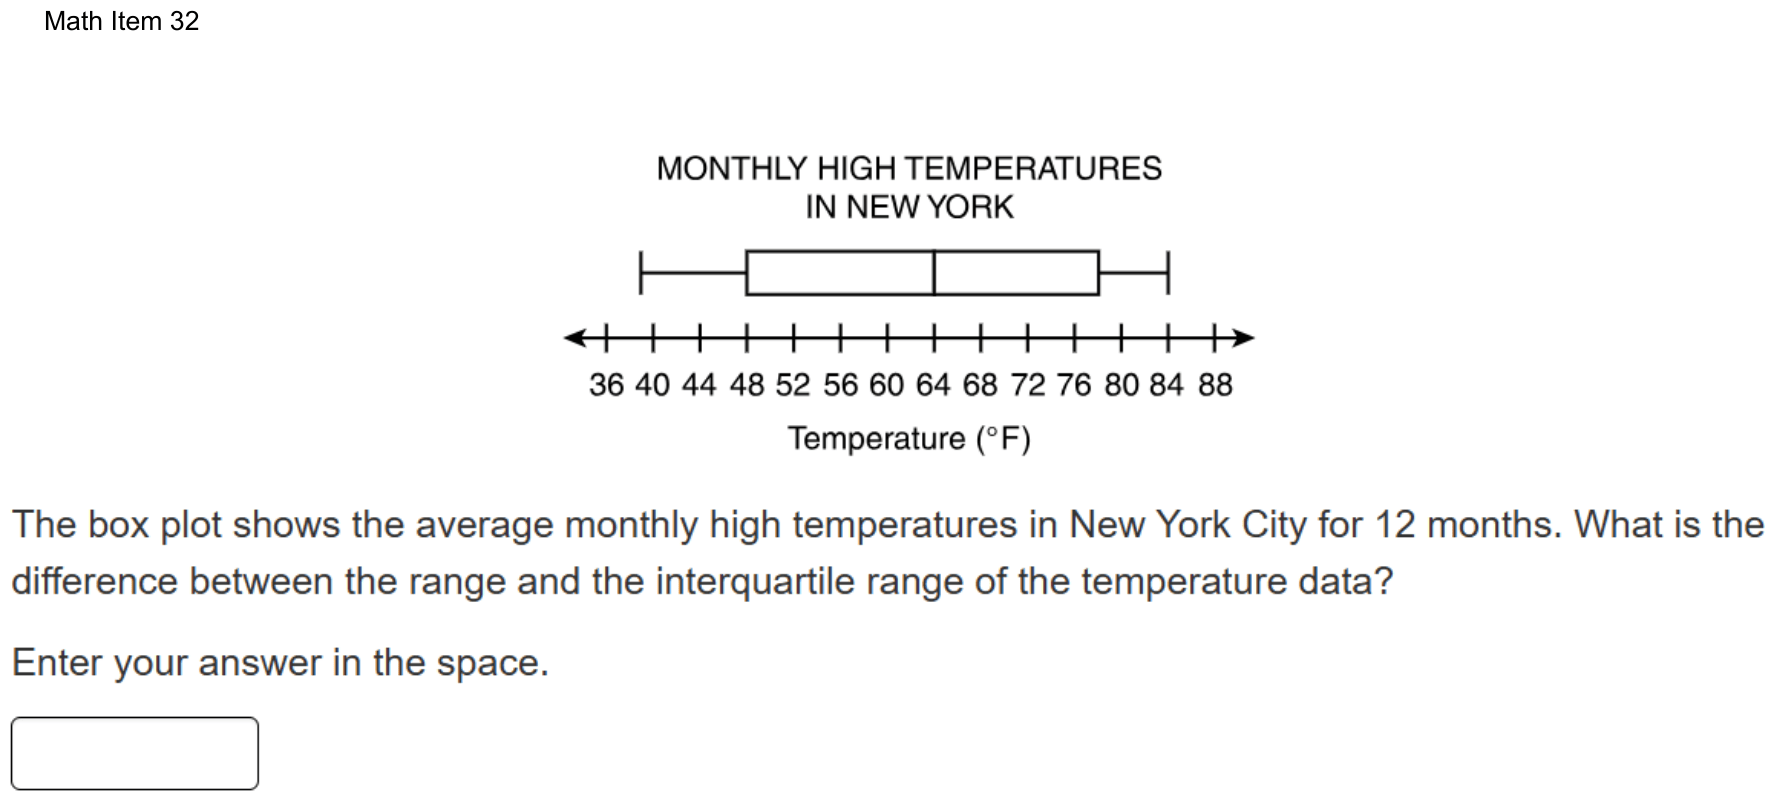
The box plot shows the average monthly high temperatures in New York City for 12 months. What is the difference between the range and the interquartile range of the temperature data?
Enter your answer in the space.
Fill-in question: work out the answer and type it as a number.
Show the answer
Correct answer: 15
Determine the range by subtracting the minimum value on the box plot from the maximum value on the box plot:
Maximum value , Minimum value
Determine the interquartile range by subtracting the lower quartile value on the box plot from the upper quartile value on the box plot:
Upper Quartile Value , Lower Quartile Value
Determine the difference between the range (45° F) and the interquartile range (30° F):
Question analysis
A box plot of New York City's average monthly high temperatures for 12 months sits above a number line labeled every 4 degrees. Students type the difference between the range and the interquartile range of the data. Two of the plot's values fall between labeled ticks, so careful reading of the scale decides the answer.
- Grade level
- Grade 7 content, by NYS standard
- Compared with grade 7
- Above grade 7 Reading a box plot and finding its interquartile range are grade 7 skills. Here two of the five values fall between ticks spaced 4 apart, and the range, the IQR and their difference must all be found and typed with no choices.
- Estimated difficulty
- Hard: combines ideas, needs a plan, and has more than one tempting wrong answer.
- Thinking it demands
- Depth of knowledge 2, skills and concepts · mainly apply
- What makes it hard
- Solution
- 3 steps
- Reading level
- Question and choices: about grade 7, 36 words.
- Students, last 30 days
- Not enough answers yet to show (it takes 10).
Why it is hard, traps and wrong answers (shows the answer)
Why it is hard
The method is standard, but the key rests on reading the scale between its labels. The axis is ticked only every 4 degrees, and the minimum and the upper quartile land off the ticks, so rounding either one to the nearest label moves the result by a degree or two with nothing to flag it. Students who find the range correctly can also stop there, entering 45, the larger of the two spreads, instead of the difference the question asks for.
Reading a figure, table or graph major Understanding the question
Two of the five values fall between ticks spaced 4 degrees apart: the left whisker ends just short of the 40 tick, at 39, and the box’s right edge sits midway between 76 and 80, at 78. (Lesh, Post & Behr, 1987; Kirsch & Mosenthal, 1990)
Many steps minor Working it out
Four values are read and combined in three subtractions, the range, the interquartile range and then their difference, so one misread value changes the final entry. (Daniel & Embretson, 2010; Enright, Morley & Sheehan, 2002)
Something you must already know minor Working it out
Neither measure is defined on the page: the range spans the whiskers, and the interquartile range is the width of the box, the upper quartile minus the lower. (Anderson & Krathwohl, 2001)
An answer in an unexpected form minor Choosing the answer
The result is typed with no choices to compare, so an entry one or two degrees off, from rounding a value to the nearest tick, looks just as finished as the right one. (Enright, Morley & Sheehan, 2002)
Strategy: Read the minimum, both quartiles and the maximum, judging where each mark falls between the ticks, then subtract for the range and for the IQR, and subtract those two results.
Traps
- Misreads the figure: Reads a value, label or tick spacing in a figure, table or graph wrongly.
- Stops one step early: A choice is a number from partway through the solution.
The wrong answers, classified
14 Misreads the figure (Lesh, Post & Behr, 1987; Kirsch & Mosenthal, 1990)
Reads the left whisker’s end as 40, the nearest labeled tick, instead of 39, so the range becomes 84 − 40 = 44 and 44 − 30 = 14.
45 Stops one step early (King et al., 2004; Gierl et al., 2017)
Finds the range, 84 − 39 = 45 degrees, and enters it, stopping before the interquartile range of 30 is subtracted from it.
17 Misreads the figure (Lesh, Post & Behr, 1987; Kirsch & Mosenthal, 1990)
Reads the box’s right edge as 76, the tick just left of it, instead of 78, so the IQR becomes 76 − 48 = 28 and 45 − 28 = 17.
Worked solution, step by step
Formulas used
- Range
- The maximum is the greatest value, at the right end of the right whisker. The minimum is the least value, at the left end of the left whisker. The range tells how far the whole set of data spreads.
- Interquartile range (IQR)
- Q3 is the upper quartile, the right edge of the box. Q1 is the lower quartile, the left edge of the box. The IQR is the width of the box. It tells how far the middle half of the data spreads.
Sort out the question
A box plot shows data with five numbers. The two whiskers are the lines on each side of the box. Their ends are the minimum, the least value, and the maximum, the greatest. The box runs from the lower quartile to the upper quartile. These are the middles of the lower half and the upper half of the data. The line inside the box is the median, the middle value.
You need the range minus the interquartile range (IQR), in degrees.
Read the values between the ticks
The ticks on the number line are 4 degrees apart. So each degree is one quarter of the space between two ticks. Three values sit right on ticks: the box’s left edge at 48, the median at 64, and the right whisker’s end at 84.
- The left whisker starts just left of the 40 tick. It sits about one quarter of the way back toward 36. So the minimum is degrees.
- The box’s right edge is halfway between 76 and 80. Halfway is 78 degrees.
Find the range
Use the range formula:
The data spread over 45 degrees.
Watch out: rounding the minimum to the 40 tick gives a range of 44. Then the final answer comes out 14, which is wrong.
Find the IQR
Use the IQR formula with the two edges of the box:
The middle half of the data spreads over 30 degrees.
Watch out: reading the box’s right edge as 76 gives an IQR of 28. Then the final answer comes out 17.
Subtract the IQR from the range
The question asks for the difference between the two:
Watch out: 45 is only the range. Do not stop there. Type only the number, with no degree sign.
So you would enter 15.
Check your answer
The range covers the whole plot, and the IQR covers only the box. So their difference is the two whiskers added together. The left whisker is degrees long. The right whisker is degrees long. , which matches.
More questions like this
The original DOE question
Question 4 of 61
2026 Practice Test C Math, question 33Question
A bag contains 40 tiles that are either red, green, or blue. A tile is selected at random, the color is recorded, and the tile is put back in the bag. This process is carried out 120 times, and 18 of those times a red tile is selected. Based on the information, what is the most likely number of red tiles in the bag?
- A6
- B15
- C18
- D30
Show the answer
Correct answer: A
First, determine what fraction of the sample were red tiles, given 18 of the 120 tiles drawn were red.
To predict how many of the actual 40 tiles in the bag are red, multiply 40 by the fraction of red tiles in the sample.
Question analysis
A bag holds 40 red, green and blue tiles, and a tile is drawn and put back 120 times, with red coming up 18 times. Students predict the most likely number of red tiles in the bag. It tests using experimental results to estimate what is in the bag, and the draws outnumber the tiles, which can confuse the scaling.
- Grade level
- Grade 6 content, by NYS standard
- Compared with grade 7
- At grade 7 Predicting from repeated trials is grade 6 probability, and grade 7 students make similar estimates from samples. The twist is scaling down, from 120 draws to a bag of 40 tiles, rather than up to a larger group.
- Estimated difficulty
- Straightforward: two steps or one careful reading.
- Thinking it demands
- Depth of knowledge 2, skills and concepts · mainly apply
- What makes it hard
- Solution
- 2 steps
- Reading level
- Question and choices: about grade 6, 61 words.
- Students, last 30 days
- Not enough answers yet to show (it takes 10).
Why it is hard, traps and wrong answers (shows the answer)
Why it is hard
There are more draws than tiles, which is what makes this unusual: the 120 draws must be scaled down to a bag of 40, not up to a bigger group. Red came up 18 times because each tile went back in the bag, so 18 is not a count of red tiles. Since there are three draws for every tile, dividing the 18 red draws by 3 gives the same estimate as taking 3/20 of 40.
Turning words into math minor Understanding the question
The 18 red draws come from 120 draws with the tile put back each time, so they give a share, 3/20, to take of the 40 tiles, not a count of red tiles. (Hegarty, Mayer & Monk, 1995; Koedinger & Nathan, 2004)
Something you must already know minor Working it out
Students must know that the share of red in repeated draws estimates the share of red tiles in the bag; the stem never says to multiply 40 by that share. (Anderson & Krathwohl, 2001)
Strategy: Write the red draws as a fraction of all 120 draws, simplify it, and take that same fraction of the 40 tiles in the bag.
Traps
- Stops one step early: A choice is a number from partway through the solution.
- Numbers taken from the question: Combines the numbers in the question without a model of the situation, or is simply a number that appears in the question.
The wrong answers, classified
B Stops one step early (King et al., 2004; Gierl et al., 2017)
Finds that red came up in 18 of 120 draws, or 15%, and gives 15 as the count, stopping before taking that share of the 40 tiles.
C Numbers taken from the question (Hegarty, Mayer & Monk, 1995)
Gives 18, the number of times red was drawn, as the number of red tiles, though each tile went back and could be drawn many times.
D Little reason to choose it (Haladyna & Downing, 1993; Rodriguez, 2005)
No working from 18 red draws in 120 gives 30 red tiles, three quarters of the bag, when red came up in fewer than one draw in six.
Worked solution, step by step
Formulas used
- Predicting from repeated draws
- The fraction is the share of draws that came up red. That share is your best guess for the share of tiles that are red. Multiply it by the number of tiles in the bag to predict the red tiles. The sign ≈ means about equal.
Sort out the question
The bag has 40 tiles, each red, green or blue. A tile is drawn, its color is written down, and it goes back in the bag. This happens 120 times, and red comes up 18 times.
You need the most likely number of red tiles in the bag.
See why 18 is not the answer
Each tile goes back in the bag after it is drawn. So the same red tile can be drawn again and again. That means 18 counts draws, not tiles.
Watch out: choice C, 18, mixes up the number of red draws with the number of red tiles.
Find the share of red draws
Red came up 18 times out of 120. Simplify by dividing the top and bottom by 6:
As a decimal, that is 0.15, or 15%.
Watch out: 15 is a percent here, not a number of tiles. Stopping now gives choice B.
Take that share of the bag
Use the same share of the 40 tiles in the bag:
So about 6 of the 40 tiles are red.
Give the answer
The best prediction is 6 red tiles. The other 34 tiles are probably green or blue.
So the answer is A, 6.
Check your answer
There were 120 draws for 40 tiles. That is 3 draws for every tile. So divide the red draws by 3: . Same answer. Choice D, 30 red tiles, would be three quarters of the bag. Then red would come up far more than 18 times.
More questions like this
The original DOE question
Question 5 of 61
2026 Practice Test C Math, question 36Question
A deck of 52 playing cards contains 13 hearts. Sara has 12 cards from this deck in her hand, 3 of which are hearts. The other cards remain in the deck. What is the probability that a card drawn at random from the remainder of the deck will be a heart?
- A
- B
- C
- D
Show the answer
Correct answer: B
First, determine the number of cards in the remaining deck:
Next, determine the number of hearts left in the remaining deck:
Last, determine the probability of drawing a heart from the remaining deck:
Question analysis
A standard deck of 52 playing cards has 13 hearts, and Sara holds 12 cards, 3 of them hearts. Students find the probability that a card drawn at random from the rest of the deck is a heart. Her hand changes both the number of hearts and the number of cards left, so both counts must be updated.
- NYS standards
- 6.SP.8a uniform probability models
- Grade level
- Grade 6 content, by NYS standard
- Compared with grade 7
- At grade 7 Finding a simple probability is grade 6 content. This one adds a step many grade 7 problems skip: the cards in Sara's hand must be taken out of both the hearts and the whole deck first.
- Estimated difficulty
- Straightforward: two steps or one careful reading.
- Thinking it demands
- Depth of knowledge 2, skills and concepts · mainly apply
- What makes it hard
- Much to keep track of minor
- Turning words into math minor
- Solution
- 3 steps
- Reading level
- Question and choices: about grade 3, 51 words.
- Students, last 30 days
- Not enough answers yet to show (it takes 10).
Why it is hard, traps and wrong answers (shows the answer)
Why it is hard
The careful route takes two subtractions and a fraction: 10 hearts among 40 cards. The numbers are kind, because Sara’s hand is a quarter hearts, just like the full deck, so a student who ignores her hand and divides 13 by 52 also reaches 1/4. The wrong choices come from describing her hand instead of the deck, or from comparing hearts with the cards that are not hearts.
Much to keep track of minor Working it out
Four counts are in play, 52 cards, 13 hearts, Sara’s 12 cards and her 3 hearts, and both the hearts and the total must be reduced before the fraction is formed. (Sweller, 1988; Carpenter, Just & Shell, 1990)
Turning words into math minor Understanding the question
“The other cards remain in the deck” and “the remainder of the deck” point to the 40 cards Sara is not holding, not to the full 52 or to her hand. (Hegarty, Mayer & Monk, 1995; Koedinger & Nathan, 2004)
Strategy: Work out how many cards are left in the deck and how many of them are hearts, then write the hearts left over the cards left and simplify.
Traps
- Answers a different question: A choice is right for another quantity: the other unknown, the rest instead of the part, the part instead of the whole.
- Misunderstands the concept: A wrong belief about a concept: that percents can be added, that area grows like length, that averages can be averaged, that a bigger denominator means a bigger fraction.
- Numbers taken from the question: Combines the numbers in the question without a model of the situation, or is simply a number that appears in the question.
The wrong answers, classified
A Numbers taken from the question (Hegarty, Mayer & Monk, 1995)
Matches the 10 hearts left in the deck to the 10 in 1/10, never dividing them by the 40 cards that remain.
C Answers a different question (King et al., 2004; Hegarty, Mayer & Monk, 1995)
Puts Sara’s 3 hearts over the deck’s 13, or her 12 cards over 52, both 3/13, which describes her hand rather than the cards left.
D Misunderstands the concept (Smith, diSessa & Roschelle, 1993; De Bock et al., 1998; Ni & Zhou, 2005)
Compares the 10 hearts left with the 30 other cards left, a part-to-part ratio of 1 to 3, instead of with all 40 cards.
Worked solution, step by step
Formulas used
- Probability
- P is the probability, the chance something happens. The top counts the cards that are hearts. The bottom counts every card you could draw. Each card is equally likely to be drawn, so the fraction gives the chance.
Sort out the question
A full deck has 52 cards, and 13 of them are hearts. Sara holds 12 cards, and 3 of those are hearts. The rest of the cards stay in the deck.
You need the chance that a card drawn from the rest of the deck is a heart. Her hand changes both counts.
Count the cards left
Take Sara’s 12 cards out of the deck:
So 40 cards are left in the deck.
Count the hearts left
Sara holds 3 of the 13 hearts. Take those out:
So 10 hearts are left in the deck.
Find the probability
Use the probability formula. Put the hearts left over all the cards left, then simplify:
Watch out: comparing the 10 hearts with the 30 cards that are not hearts gives , choice D. The bottom must be all 40 cards. Choice C, , describes Sara’s hand, not the deck. Choice A, , uses the 10 hearts but forgets the 40 cards.
Give the answer
The chance of drawing a heart from the rest of the deck is 1 in 4.
So the answer is B, .
Check your answer
10 is one quarter of 40, because . Here is another check. Sara’s hand is 3 hearts out of 12, which is also one quarter. Taking a hand that is one quarter hearts out of a deck that is one quarter hearts leaves one quarter hearts.
More questions like this
The original DOE question
Question 6 of 61
2026 Practice Test C Math, question 37Question
The table shows the probability of randomly picking each flavor of candy from a bowl.
PICKING CANDY FROM
A BOWL
| Flavor | Probability |
|---|---|
| Butterscotch | 0.57 |
| Lemon | 0.095 |
| Maple | 0.125 |
| Strawberry | 0.21 |
Which flavor is most likely to be randomly picked?
- Abutterscotch
- Blemon
- Cmaple
- Dstrawberry
Show the answer
Correct answer: A
The flavor most likely to be picked at random is butterscotch, because its probability is the greatest of the probabilities in the list. More than half the candies in the bowl are butterscotch.
Question analysis
A table lists the probability of picking butterscotch, lemon, maple or strawberry candy at random from a bowl, each as a decimal. Students decide which flavor is most likely to be picked. It tests the meaning of probability and comparing decimals, which have different numbers of digits here and must be compared by place value.
- Grade level
- Grade 6 content, by NYS standard
- Compared with grade 7
- Below grade 7 Reading probabilities as likelihoods is grade 6 content, and this needs only a comparison of four decimals. The one demand is comparing decimals with different numbers of digits, a skill from earlier grades.
- Estimated difficulty
- Routine: one familiar step, little to misread.
- Thinking it demands
- Depth of knowledge 1, recall and reproduction · mainly understand
- What makes it hard
- Error-prone arithmetic minor
- Solution
- 1 step
- Reading level
- Question and choices: about grade 9, 37 words.
- Students, last 30 days
- Not enough answers yet to show (it takes 10).
Why it is hard, traps and wrong answers (shows the answer)
Why it is hard
One idea answers the question: the most likely flavor has the greatest probability. The only obstacle is comparing decimals of different lengths, where 0.125 and 0.095 look bigger than 0.57 to students who count digits. Writing each as thousandths, 570, 95, 125 and 210, or noticing that 0.57 alone is more than one half, makes the order plain.
Error-prone arithmetic minor Working it out
The probabilities have two and three decimal places, 0.57 beside 0.095 and 0.125, so comparing them by length, or by their digits as whole numbers, ranks them wrongly. (Brown & Burton, 1978; Junker & Sijtsma, 2001)
Strategy: Line the four decimals up by place value, adding zeros so each has three decimal places, and compare them digit by digit starting from the tenths place.
Traps
- Misunderstands the concept: A wrong belief about a concept: that percents can be added, that area grows like length, that averages can be averaged, that a bigger denominator means a bigger fraction.
The wrong answers, classified
B Misreads the figure (Lesh, Post & Behr, 1987; Kirsch & Mosenthal, 1990)
Reads lemon’s 0.095 as 0.95, overlooking the 0 in the tenths place, so it looks almost certain and larger than 0.57.
C Misunderstands the concept (Smith, diSessa & Roschelle, 1993; De Bock et al., 1998; Ni & Zhou, 2005)
Treats the decimal with more digits as the larger, or compares 125 with 57 as whole numbers, so 0.125 seems bigger than 0.57.
D Little reason to choose it (Haladyna & Downing, 1993; Rodriguez, 2005)
No common misreading makes 0.21 the largest, since it is neither the longest decimal nor the one with the biggest digits, so it mostly draws guesses.
Worked solution, step by step
Formulas used
- Probability
- P is the probability of picking a flavor. It is a number from 0 to 1. The more candies of a flavor there are, the bigger its probability. So the flavor with the greatest probability is the most likely to be picked.
Sort out the question
The table gives the probability of picking each of four flavors. You need the flavor that is most likely to be picked.
The greater the probability, the more likely the pick. So you need the greatest of the four decimals.
Line up the decimals
The decimals have different numbers of digits. Add zeros at the end so each has three decimal places. This does not change their values:
Flavor Probability Butterscotch 0.570 Lemon 0.095 Maple 0.125 Strawberry 0.210 Compare the tenths digits
Start with the first digit after the decimal point, the tenths place. The tenths digits are 5, 0, 1 and 2. The biggest is 5, so 0.570 is the greatest.
Watch out: 0.125 has more digits than 0.57, but it is smaller. Compare place by place, not by length. That mistake leads to choice C. Also, lemon is 0.095, not 0.95, so choice B is out.
Give the answer
Butterscotch has the greatest probability, 0.57. So it is the flavor most likely to be picked.
So the answer is A, butterscotch.
Check your answer
0.57 is more than 0.5, which is one half. So more than half the candies are butterscotch. The other three flavors add up to , less than half. So butterscotch must be the most likely.
More questions like this
The original DOE question
Question 7 of 61
2026 Practice Test C Math, question 39Question
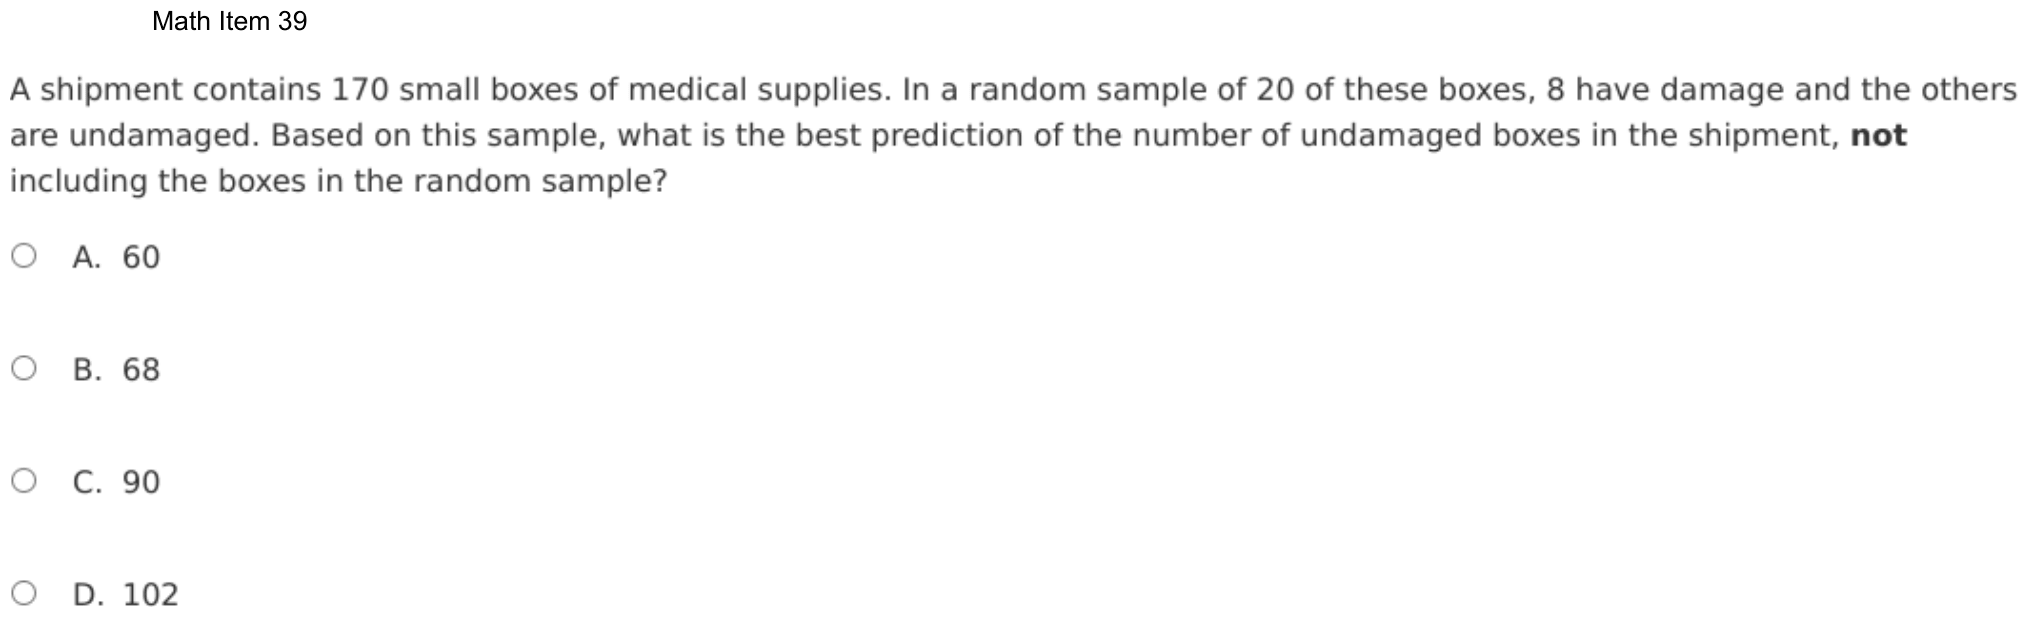
A shipment contains 170 small boxes of medical supplies. In a random sample of 20 of these boxes, 8 have damage and the others are undamaged. Based on this sample, what is the best prediction of the number of undamaged boxes in the shipment, not including the boxes in the random sample?
- A60
- B68
- C90
- D102
Show the answer
Correct answer: C
Determine the fraction of undamaged boxes in the sample, given 8 of the 20 boxes are damaged.
Subtract the number of boxes in the sample from 170.
Basing the prediction of undamaged boxes on the sample, multiply the number of boxes not in the sample by the fraction of undamaged boxes in the sample.
Question analysis
A shipment holds 170 boxes of medical supplies, and in a random sample of 20, 8 are damaged. Students predict how many undamaged boxes are in the shipment, leaving out the boxes in the sample. It tests using a sample to make a prediction, and the question's two conditions each lead to a different tempting wrong choice.
- Grade level
- Grade 7 content, by NYS standard
- Compared with grade 7
- At grade 7 Predicting from a random sample is grade 7 proportional reasoning. This version adds two conditions, undamaged rather than damaged and the shipment without the sample, so it takes three steps and a close reading.
- Estimated difficulty
- Moderate: several steps, or a close reading with one strong distractor.
- Thinking it demands
- Depth of knowledge 2, skills and concepts · mainly apply
- What makes it hard
- Much to keep track of moderate
- Many steps minor
- Solution
- 3 steps
- Reading level
- Question and choices: about grade 8, 49 words.
- Students, last 30 days
- Not enough answers yet to show (it takes 10).
Why it is hard, traps and wrong answers (shows the answer)
Why it is hard
The proportion itself is routine; the question is built around two conditions that each change the numbers. The stem reports the damaged boxes, but the question asks about undamaged ones, and its bold not removes the 20 sampled boxes from the shipment. Each wrong choice matches one way of mishandling the two conditions, so checking the result against both words, undamaged and not, is what the question rewards.
Much to keep track of moderate Working it out
Two conditions point away from the obvious numbers: the question wants undamaged boxes while the stem counts the 8 damaged, and it leaves out the 20 sampled, so 150 boxes, not 170. (Sweller, 1988; Carpenter, Just & Shell, 1990)
Many steps minor Working it out
Three steps follow in order, the undamaged share 12/20, the 150 boxes outside the sample, and their product, and each wrong turn lands on a listed choice. (Daniel & Embretson, 2010; Enright, Morley & Sheehan, 2002)
Strategy: Find the fraction of the sample that is undamaged, count the boxes that were not sampled, and multiply; then check that the answer describes the group of boxes asked about.
Traps
- Misreads the question: Misses or misreads a condition or a word in the question: "at least", "each", "remaining", "not".
- Answers a different question: A choice is right for another quantity: the other unknown, the rest instead of the part, the part instead of the whole.
The wrong answers, classified
A Answers a different question (King et al., 2004; Hegarty, Mayer & Monk, 1995)
Uses the damaged share, 8 of 20 or 0.4, instead of the undamaged share, taking it of the 150 unsampled boxes: 0.4 × 150 = 60.
B Answers a different question (King et al., 2004; Hegarty, Mayer & Monk, 1995)
Takes the damaged share of the whole shipment, 0.4 × 170 = 68, answering for damaged boxes and keeping the 20 sampled ones as well.
D Misreads the question (Hegarty, Mayer & Monk, 1995)
Finds the undamaged share, 0.6, but takes it of all 170 boxes, missing the bold not that leaves the 20 sampled boxes out: 0.6 × 170 = 102.
Worked solution, step by step
Formulas used
- Predicting from a sample
- A sample is a small group chosen at random from a bigger group. The fraction is the share of the sample with some feature. A random sample is likely to look like the bigger group. So use the same share of the group you are predicting for.
Sort out the question
The shipment has 170 boxes. A random sample of 20 boxes was checked, and 8 of them were damaged.
You need to predict the undamaged boxes in the shipment, not counting the 20 in the sample. Two words matter: undamaged and not.
Find the undamaged share
The sample has undamaged boxes. Write that as a share of the sample, and simplify:
So 0.6, or 60%, of the sample is undamaged.
Watch out: is the damaged share. Using it leads to choice A or B.
Count the boxes outside the sample
The question leaves out the 20 boxes in the sample. Take them away from the shipment:
So the prediction is about 150 boxes.
Make the prediction
Use the same undamaged share for the 150 boxes:
About 90 of those boxes should be undamaged.
Watch out: , choice D, forgets the bold not. It counts the sample boxes again.
Give the answer
The best prediction is 90 undamaged boxes outside the sample.
So the answer is C, 90.
Check your answer
Predict the damaged boxes outside the sample too: . Then , every box outside the sample. Also, 12 out of 20 is a bit more than half. And 90 is a bit more than half of 150.
More questions like this
The original DOE question
Question 8 of 61
2026 Practice Test C Math, question 49Question
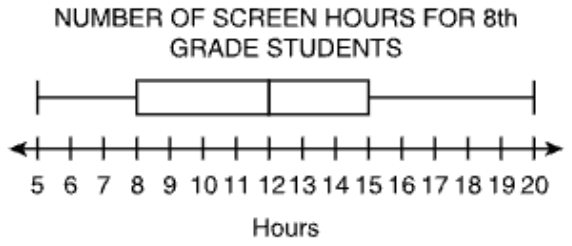
The box plot illustrates the number of hours eighth-grade students spend on screens during a typical week. What is the difference between the range and the interquartile range (IQR) of the screen time data?
Move the correct answer to each box. Not all answers will be used.
The range of screen time hours is hours.
The IQR is hours.
The difference between the range and the IQR is hours.
On the test you drag tiles into the boxes; here, choose each box’s tile from its menu. Each tile can be used once. The DOE has not published how answers with several parts are scored; this site counts one right only when every part is right.
Show the answer
Correct answer: blank 1: 15; blank 2: 7; blank 3: 8
Determine the range by subtracting the minimum value on the box plot from the maximum value on the box plot:
Maximum value , Minimum value
Determine the interquartile range by subtracting the lower quartile value on the box plot from the upper quartile value on the box plot:
Upper Quartile Value , Lower Quartile Value
Determine the difference between the range (15 hr) and the interquartile range (7 hr):
Question analysis
A box plot shows how many hours a week eighth-grade students spend on screens, on a number line marked every hour. Students move number tiles to complete three sentences: the range, the interquartile range, and the difference between them. Each tile can be used only once, and keeping the range and the interquartile range apart is the tricky part.
- Grade level
- Grade 7 content, by NYS standard
- Compared with grade 7
- At grade 7 Reading a box plot and finding its range and interquartile range are grade 7 statistics skills. The values sit on labeled whole-number ticks and the three sentences lead through the steps, a typical grade 7 task.
- Estimated difficulty
- Straightforward: two steps or one careful reading.
- Thinking it demands
- Depth of knowledge 2, skills and concepts · mainly apply
- What makes it hard
- Something you must already know minor
- Many steps minor
- Solution
- 3 steps
- Reading level
- Question and choices: about grade 4, 69 words.
- Corrected from the DOE handbook
- A missing comma in the explanation was restored.
- Students, last 30 days
- Not enough answers yet to show (it takes 10).
Why it is hard, traps and wrong answers (shows the answer)
Why it is hard
The plot is drawn on whole-hour ticks, and the three sentences lay out the steps, so this is a direct check of two definitions. The main risk is taking a value off the plot, such as the lower quartile of 8, for a spread between two values. Because the four tiles allow only one use each, a student who confuses the measures can still fill every box, which hides the error.
Something you must already know minor Working it out
The sentences name the range and the IQR but never define them; students must know the range spans the whiskers and the IQR spans only the box. (Anderson & Krathwohl, 2001)
Many steps minor Working it out
Three boxes must all be right, the third depends on the first two, and each tile can be used once, so one mix-up spreads to a second box. (Daniel & Embretson, 2010; Enright, Morley & Sheehan, 2002)
Strategy: Read the five key values off the plot, subtract the least from the greatest for the range, subtract the lower quartile from the upper for the IQR, then subtract those results.
Traps
- Misunderstands the concept: A wrong belief about a concept: that percents can be added, that area grows like length, that averages can be averaged, that a bigger denominator means a bigger fraction.
- Wrong formula: Uses a related but wrong formula: perimeter for area, diameter for radius, area for volume, or a misremembered one.
The wrong answers, classified
DCB Misunderstands the concept (Smith, diSessa & Roschelle, 1993; De Bock et al., 1998; Ni & Zhou, 2005)
Takes the lower quartile, 8, as the interquartile range, reading a value off the box instead of its width, so the difference becomes 15 − 8 = 7.
BDC Wrong formula (King et al., 2004)
Swaps the two measures, giving the box’s width, 7, as the range and the whiskers’ spread, 15, as the IQR, while the difference stays 8.
What was corrected from the DOE handbook, and why
- Explanation: The DOE’s explanation runs two values together: “Maximum value = 20 hr Minimum value = 5 hr”. Its next line is “Upper Quartile Value = 15 hr, Lower Quartile Value = 8 hr”, and Question 32’s explanation has “Maximum value = 84° F, Minimum value = 39° F”. The site adds the comma.
Worked solution, step by step
Formulas used
- Range
- The maximum is the greatest value, at the right end of the right whisker. The minimum is the least value, at the left end of the left whisker. The range tells how far the whole set of data spreads.
- Interquartile range (IQR)
- Q3 is the upper quartile, the right edge of the box. Q1 is the lower quartile, the left edge of the box. The IQR is the width of the box. It tells how far the middle half of the data spreads.
Sort out the question
The box plot shows the hours of screen time for eighth graders in a week. You need three numbers: the range, the IQR, and the difference between them.
There are four tiles: 5, 7, 8 and 15. Each tile is used at most once, and one tile is left over.
Read the five values
The number line has a tick at every hour, and every value sits on a tick:
- The left whisker starts at 5. This is the minimum.
- The box starts at 8. This is the lower quartile, the middle of the lower half of the data.
- The line inside the box is at 12. This is the median, the middle value.
- The box ends at 15. This is the upper quartile, the middle of the upper half.
- The right whisker ends at 20. This is the maximum.
Find the range
Use the range formula with the two ends of the whiskers:
The screen times spread over 15 hours, from the least to the most.
Find the IQR
Use the IQR formula with the two edges of the box:
The middle half of the students spend between 8 and 15 hours, a spread of 7 hours.
Watch out: the IQR is a width, not a point on the plot. The tile 8 is the lower quartile. Putting it in the IQR box also makes the last box 7, which is wrong.
Find the difference
Subtract the IQR from the range:
Watch out: do not swap the two measures. The range uses the whiskers’ ends, and the IQR uses only the box.
Fill in the three boxes
On the test, you drag a tile into each box. On this site, you choose each tile from its box’s menu. The range box gets 15, the IQR box gets 7, and the difference box gets 8. The tile 5 is not used.
So the boxes get 15, 7 and 8.
Check your answer
The difference is just the two whiskers added together. The left whisker is hours long. The right whisker is hours long. , which matches the third box.
More questions like this
The original DOE question
Question 9 of 61
2026 Practice Test D Math, question 5Question
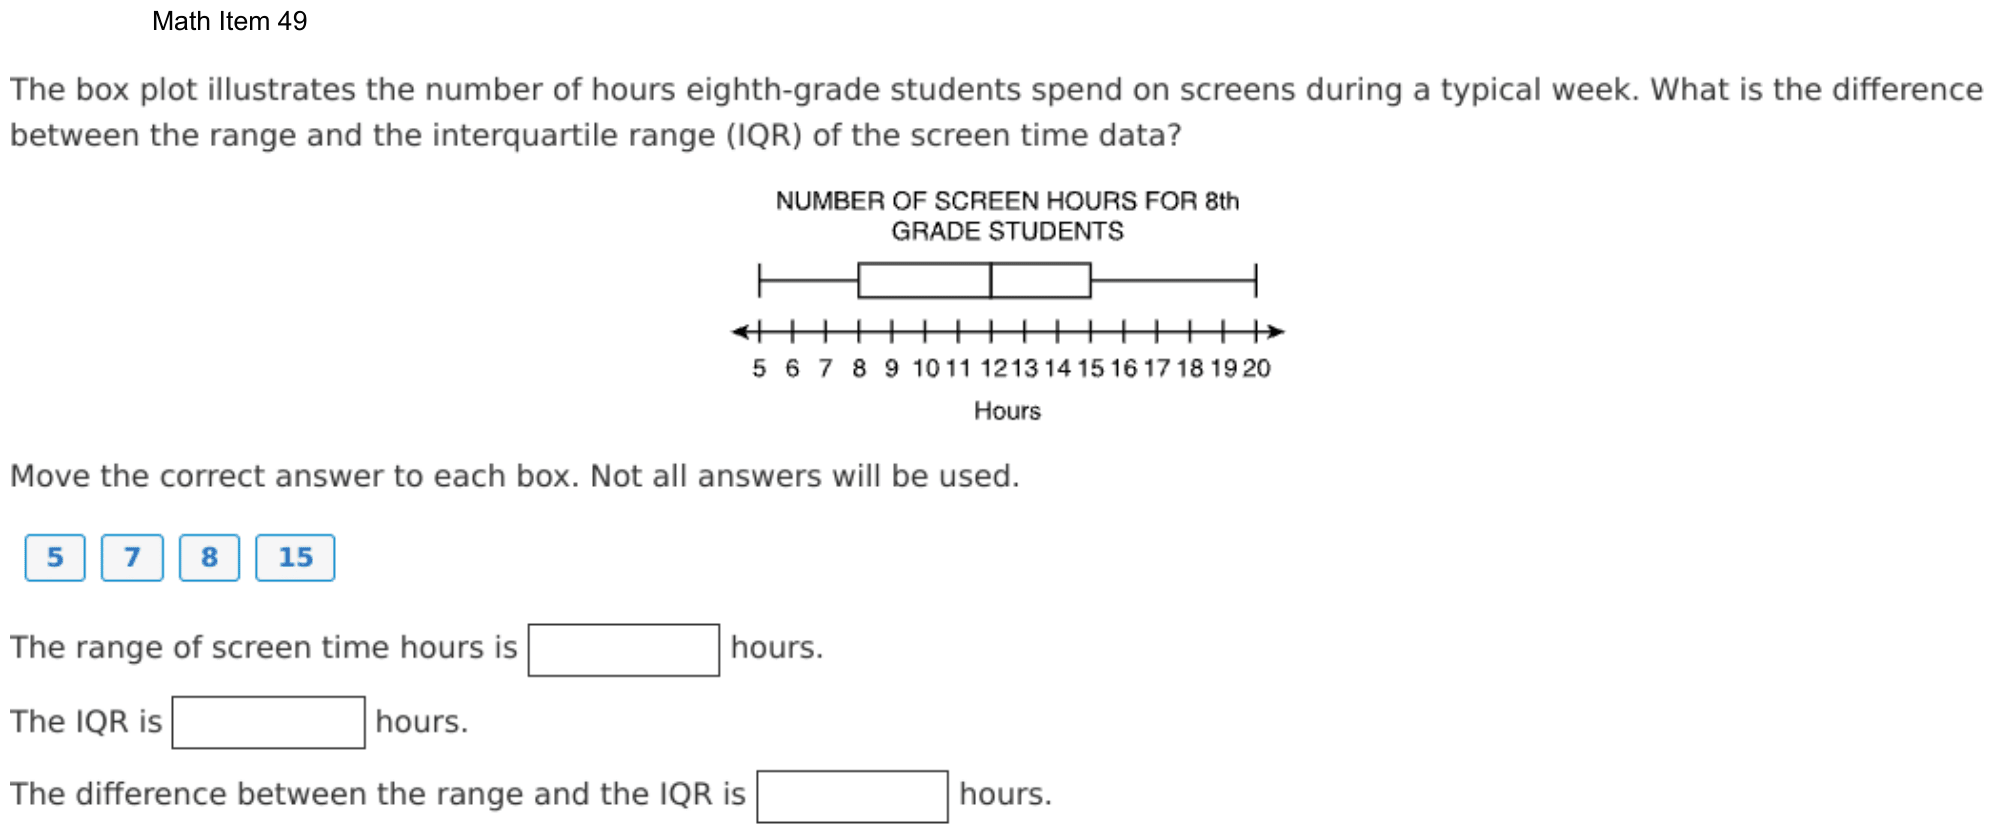
In a school raffle, 1 out of every 25 students wins a prize. Each prize includes a randomly selected trading card from a set of 100 different cards, labeled C1 through C100, with each card equally likely to be chosen. If one student is selected at random, what is the probability that the student both wins a prize and receives Card C17?
Write an expression that represents the probability that a student wins the prize and receives Card C17.
Enter your answer in the space provided. Enter only your answer.
On the test you build the answer on an on-screen keypad; here, type it. Use ^ for a power, sqrt( ) or √ for a root, pi for π, and <= or >= for ≤ and ≥.
Show the answer
Correct answer: 1/25 · 1/100
To calculate the joint probability, first determine the probability of each independent event.
The probability that a randomly selected student wins the prize is .
The probability that the card in a prize is Card C17 is , because Card C17 is 1 card out of 100 labeled cards.
The probability that a student wins the prize and receives Card C17 is the product of those two probabilities, .
Question analysis
In a school raffle, 1 out of every 25 students wins a prize, and each prize includes one of 100 equally likely trading cards. Students type an expression for the probability that a randomly chosen student both wins and gets one particular card. It tests the probability of two independent events, and combining the two chances correctly is the main hurdle.
- Grade level
- Grade 7 content, by NYS standard
- Compared with grade 7
- At grade 7 Grade 7 students find compound probabilities, usually by listing outcomes for coins or number cubes. These two stages have 25 and 100 outcomes, far too many pairs to list, so a rule must be used, and the answer is typed as an expression.
- Estimated difficulty
- Straightforward: two steps or one careful reading.
- Thinking it demands
- Depth of knowledge 2, skills and concepts · mainly apply
- What makes it hard
- Solution
- 2 steps
- Reading level
- Question and choices: about grade 8, 87 words.
- Corrected from the DOE handbook
- The explanation gave the wrong event the chance 1/100; one sentence was corrected.
- Students, last 30 days
- Not enough answers yet to show (it takes 10).
Why it is hard, traps and wrong answers (shows the answer)
Why it is hard
Each chance is stated almost directly, 1 out of 25 and 1 out of 100, so the question tests one rule: both events must happen, and the chances multiply. The word “and” pulls students toward adding, which gives a result larger than either chance, a sign that something is wrong. Others write only the card's chance and forget that the student must first win a prize.
Something you must already know moderate Working it out
The question never says that the chance of two independent events both happening is the product of their chances, so students must bring that rule to the 1/25 and the 1/100 themselves. (Anderson & Krathwohl, 2001)
An answer in an unexpected form minor Choosing the answer
The answer is typed as an expression with no choices to compare, so a sum of the two chances, which looks just as finished, gets no warning on screen. (Enright, Morley & Sheehan, 2002)
Strategy: Write each event's chance as a fraction, then apply the rule for two independent events that must both happen, and check that the result is smaller than either chance alone.
Traps
- Follows a key word: Picks the operation from a single word rather than the situation: "removed" so subtract, "of" so multiply, "more" so add, when the situation needs something else.
- Stops one step early: A choice is a number from partway through the solution.
- A faulty procedure: A systematic but wrong procedure: adding fractions straight across, applying an exponent to each term of a sum, dropping a sign when moving a term.
The wrong answers, classified
1/25 + 1/100 Follows a key word (Hegarty, Mayer & Monk, 1995)
Reads “both wins a prize and receives Card C17” as a cue to add, so sums the chances, though needing both events must be less likely than either.
1/100 Stops one step early (King et al., 2004; Gierl et al., 2017)
Writes only the chance of receiving Card C17 and leaves out that the student must first be one of the 1 in 25 who win a prize.
1/125 A faulty procedure (Brown & Burton, 1978; Tatsuoka, 1983)
Combines “1 out of 25” and “1 out of 100” by adding the totals, 25 + 100, a faulty rule that gives neither the sum nor the product.
What was corrected from the DOE handbook, and why
- Explanation: The DOE’s explanation says “The probability that a randomly selected student will receive Card C17 is 1/100.” Only students who win a prize receive a card, so a randomly selected student’s chance of receiving Card C17 is the question’s own answer, 1/25 × 1/100. The 1/100 is the chance that the card in a prize is Card C17, and the site now says so. The answer is unchanged.
Worked solution, step by step
Formulas used
- Probability of one outcome
- P is the probability, the chance that something happens, from 0 to 1. The top counts the outcomes you want. The bottom counts all the outcomes that could happen. Use it when every outcome is equally likely, like one card picked from 100.
- Probability that two independent events both happen
- A and B are two events. Independent means one does not change the chance of the other. P(A) is the chance of A, and P(B) is the chance of B. Multiply them to get the chance that both happen. The result is smaller than either chance, since both things must happen.
Sort out the question
Two things must both happen. First, the student wins a prize. Second, the card in that prize is Card C17. You need an expression for that chance. An expression is a math phrase made of numbers and signs, with no equal sign. You do not have to work it out to one number.
Find the chance of winning
The question says “1 out of every 25 students wins a prize.” One student is the part that wins, and 25 is the whole group. So:
Find the chance of Card C17
Each prize has one card, picked at random from 100 cards. Every card is equally likely. Card C17 is 1 of those 100 cards:
Multiply the two chances
Winning a prize does not change which card is inside it. So the two events are independent. To find the chance that both happen, multiply:
The dot · means times. Worked out, this is 1/2500.
Watch out: the word and does not mean add here. 1/25 + 1/100 is bigger than either chance, but needing both things must be less likely. Writing only 1/100 forgets that the student must win a prize first.
Enter the expression
On the test, press the fraction key, a small box over a small box. Type 1 on top and 25 on the bottom. Move the cursor out of the fraction with the → key. Press the dot key for times. Then use the fraction key again for 1 over 100. On this site, type 1/25 * 1/100 or 1/25 · 1/100. The value 1/2500 also counts.
So you would enter 1/25 · 1/100.
Check your answer
Picture 2,500 students. 1 in 25 wins, so about 100 students win a prize. Of those 100, about 1 gets Card C17. That is 1 student out of 2,500, which matches 1/25 · 1/100 = 1/2500. It is smaller than 1/25 and 1/100, as it should be.
More questions like this
The original DOE question
Question 10 of 61
2026 Practice Test D Math, question 7Question
A middle school library has a shelf with 40 books, each labeled with a different number from 201 to 240. One book is selected at random. What is the probability, as a percentage, of selecting book number 223?
Enter your answer in the space provided.
Fill-in question: work out the answer and type it as a number.
Show the answer
Correct answer: 2.5%
The probability that book number 223 will be selected at random from 40 books is 1 out of 40. To find the probability as a percentage, convert the fraction to a decimal.
The chance of selecting one specific book is .
Convert the decimal to a percentage:
Question analysis
A library shelf holds 40 books numbered 201 to 240, and one is picked at random. Students find the probability of picking one particular book and type it as a percentage. It tests simple probability and converting a fraction to a percent; the book numbers play no part, and the decimal point needs care.
- Grade level
- Grade 6 content, by NYS standard
- Compared with grade 7
- Below grade 7 Finding the probability of one equally likely outcome is grade 6 content. The only further step is rewriting the fraction as a percent, which needs care with place value, so it is lighter than grade 7 compound probability.
- Estimated difficulty
- Straightforward: two steps or one careful reading.
- Thinking it demands
- Depth of knowledge 1, recall and reproduction · mainly apply
- What makes it hard
- An answer in an unexpected form moderate
- Error-prone arithmetic minor
- Solution
- 2 steps
- Reading level
- Question and choices: about grade 6, 41 words.
- Students, last 30 days
- Not enough answers yet to show (it takes 10).
Why it is hard, traps and wrong answers (shows the answer)
Why it is hard
The book numbers, 201 to 240, and the chosen number 223 play no part, since every book is equally likely and the shelf holds 40. The chance is 1 in 40, and the real demand is the form: changing it to a percent means a decimal with a zero in the tenths place, then a shift of two places. Students who know that 1/4 is 25% can check that 1/40 must be a tenth of that.
An answer in an unexpected form moderate Choosing the answer
Only the bold word percentage sets the form, since the empty box shows no % sign, so the probability 1/40 must be turned into 2.5, not entered as the fraction or as 0.025. (Enright, Morley & Sheehan, 2002)
Error-prone arithmetic minor Working it out
Dividing 1 by 40 gives 0.025, with a zero right after the decimal point, and losing that zero turns the percent into 25. (Brown & Burton, 1978; Junker & Sijtsma, 2001)
Strategy: Count the books, write the chance of picking one particular book as a fraction, then turn the fraction into a decimal and multiply by 100 to get the percent.
Traps
- Stops one step early: A choice is a number from partway through the solution.
- Misreads the question: Misses or misreads a condition or a word in the question: "at least", "each", "remaining", "not".
- Information you don't need: The question gives numbers or facts that play no part in the answer.
The wrong answers, classified
0.025 Stops one step early (King et al., 2004; Gierl et al., 2017)
Finds the probability as a decimal, 1 ÷ 40 = 0.025, and enters it without multiplying by 100, though the box asks for a percentage.
25 An arithmetic slip (Junker & Sijtsma, 2001)
Loses the zero after the decimal point when dividing, taking 1 ÷ 40 as 0.25, as 1 ÷ 4 would be, and so enters 25.
1/40 Misreads the question (Hegarty, Mayer & Monk, 1995)
Enters the probability as the fraction 1/40, the form it was found in, overlooking the bold word percentage in the question.
Worked solution, step by step
Formulas used
- Probability of one outcome
- P is the probability, the chance of an event. The top counts the outcomes you want. The bottom counts all the equally likely outcomes. Use it when each outcome has the same chance, like picking one book at random.
- Changing a fraction to a percent
- a/b is the fraction. Percent means out of 100. Multiplying by 100 tells you how many out of 100 the fraction is. For example, 1/2 × 100 = 50, so 1/2 is 50%.
Sort out the question
The shelf has 40 books, numbered 201 to 240. One book is picked at random, so every book has the same chance. You need the chance of picking book 223, written as a percentage. Book 223 is on the shelf, since 223 is between 201 and 240.
Write the probability as a fraction
Only 1 book is number 223, and there are 40 books in all:
The numbers on the labels do not matter beyond this. They just give each book its own name.
Change the fraction to a decimal
Divide 1 by 40. It helps to start from 1/4 = 0.25. Since 40 is ten times 4, 1/40 is one tenth of 1/4:
Watch out: there is a 0 right after the decimal point. Losing it gives 0.25 and then 25, which is wrong.
Change the decimal to a percent
Multiply by 100 to get a percent. That moves the decimal point two places to the right:
So the chance is 2.5%.
Watch out: 0.025 is the probability as a decimal, and 1/40 is the same chance as a fraction. The question asks for a percentage, so neither one is the answer here.
Enter the number
The box shows no % sign. Type 2.5. Adding the sign, as 2.5%, also counts.
So you would enter 2.5.
Check your answer
2.5% means 2.5 out of every 100. Out of 40 books, that is 40 × 0.025 = 1 book, the one numbered 223. Also, one book out of 40 should be a small chance, and 2.5% is small.
More questions like this
The original DOE question

Question 11 of 61
2026 Practice Test D Math, question 31Question
A box contains an unknown number of green marbles. An experimenter adds 100 red marbles to the box, mixes the marbles thoroughly, and then draws out 10 marbles at random. Assume that this sample is representative of the proportion in the box. If there are 2 red marbles and 8 green marbles in this sample, approximately how many green marbles are in the box?
- A80
- B300
- C400
- D500
Show the answer
Correct answer: C
In this context, the phrase “this sample is representative” means that the ratio of 2 red marbles to 8 green marbles is the same as the ratio of red to green marbles in the entire box. Use this ratio of 2 to 8 to set up a proportion and solve, where x represents the number of green marbles in the box.
Question analysis
An experimenter adds 100 red marbles to a box of green marbles, mixes them, and draws a sample of 10 with 2 red and 8 green. This sampling question asks students to estimate how many green marbles the box holds. It applies a ratio from a representative sample, worked from a count known for the box rather than for the sample.
- Grade level
- Grade 6 content, by NYS standard
- Compared with grade 7
- At grade 7 Using a representative sample to reason about a population is grade 6 and 7 work. The twist is that the known count, the 100 red marbles added, belongs to the box rather than the sample, so the usual scaling runs in an unfamiliar direction.
- Estimated difficulty
- Moderate: several steps, or a close reading with one strong distractor.
- Thinking it demands
- Depth of knowledge 2, skills and concepts · mainly apply
- What makes it hard
- Turning words into math moderate
- Much to keep track of minor
- Solution
- 2 steps
- Reading level
- Question and choices: about grade 8, 60 words.
- Students, last 30 days
- Not enough answers yet to show (it takes 10).
Why it is hard, traps and wrong answers (shows the answer)
Why it is hard
This is the logic of estimating a population by tagging, and the twist is that the known count belongs to the marbles that were added, not to the ones being estimated. Scaling the sample up by 50, so that its 2 red become the box’s 100, turns its 8 green into the estimate in one step. Students who scale by way of the whole box often stop at the box’s total, and those who treat 100 as the whole box scale the wrong amount.
Turning words into math moderate Understanding the question
The 100 red marbles are counted in the box, while the 2 red and 8 green are counted in a sample of 10, so “representative of the proportion” must become 2 : 8 = 100 : x. (Hegarty, Mayer & Monk, 1995; Koedinger & Nathan, 2004)
Much to keep track of minor Working it out
Three ratios can be read from the sample, red to green, red to all and green to all, and only the first two connect to the known 100 red marbles. (Sweller, 1988; Carpenter, Just & Shell, 1990)
Strategy: Use the sample's ratio of red to green marbles, then scale it up until the red part matches the 100 red marbles known to be in the box.
Traps
- Answers a different question: A choice is right for another quantity: the other unknown, the rest instead of the part, the part instead of the whole.
- Misunderstands the concept: A wrong belief about a concept: that percents can be added, that area grows like length, that averages can be averaged, that a bigger denominator means a bigger fraction.
The wrong answers, classified
A Misreads the question (Hegarty, Mayer & Monk, 1995)
Scales the sample’s 8 green in 10 up to 100 marbles, getting 80, as if the 100 red marbles added were every marble in the box.
B Misunderstands the concept (Smith, diSessa & Roschelle, 1993; De Bock et al., 1998; Ni & Zhou, 2005)
Reads the sample’s 2 to 8 as red to all marbles, so 2/8 = 100/400 makes 400 marbles in the box, then subtracts the 100 red ones.
D Answers a different question (King et al., 2004; Hegarty, Mayer & Monk, 1995)
Uses 2 red in 10 marbles to find 500 marbles in the whole box, then stops without taking away the 100 red ones to leave the green.
Worked solution, step by step
Formulas used
- Equal ratios (a proportion)
- A ratio compares two amounts. A proportion says two ratios are equal. A sample that is representative has the same mix as the whole box. So the box is the sample scaled up.
Sort out the question
You know:
- The box has an unknown number of green marbles.
- 100 red marbles are added to the box.
- A sample of 10 marbles has 2 red and 8 green.
Representative means the sample has the same mix as the box. You need the number of green marbles in the box. Notice that the 100 red marbles are counted in the box, not in the sample.
Set up the proportion
In the sample, red to green is 2 to 8. In the box, red to green is 100 to x, where x is the number of green marbles. The two ratios are equal:
Scale up the sample
How do you get from 2 red to 100 red? Multiply by 50, since . The green marbles grow by the same factor:
So the box has about 400 green marbles.
Avoid the tempting wrong totals
Watch out: there is another way that can trip you up. In the sample, 2 of 10 marbles are red. So the 100 red marbles are 2/10 of the box, and the box holds 500 marbles in all. But 100 of those are red. Stopping at 500 gives choice D.
Taking away the red ones gives green marbles, the same answer. Treating 100 as the whole box gives 80 green, choice A. Reading 2 to 8 as red to all marbles gives 300, choice B.
So the answer is C, 400.
Check your answer
Picture the finished box: 400 green and 100 red, so 500 marbles. The red part is . The sample had red too. The mix matches, so 400 makes sense.
More questions like this
The original DOE question
Question 12 of 61
2026 Practice Test D Math, question 34Question
Last week, Emily rode the bus to school on 3 of the 5 mornings and rode the bus home on 4 of the 5 afternoons. Based on last week’s events, what is the probability that Emily will ride the bus in the morning and the afternoon next Monday?
- A
- B
- C
- D
Show the answer
Correct answer: C
Using the joint probability formula, find the product of the two independent events. The probability that Emily will ride the bus to school on any given morning is . The probability that Emily will ride the bus home on any given afternoon is . Therefore, the probability that Emily will ride the bus in the morning and the afternoon is .
Question analysis
Last week Emily rode the bus to school on 3 of 5 mornings and home on 4 of 5 afternoons. This probability question asks how likely she is to ride the bus both ways next Monday, based on those frequencies. Students turn each count into a probability and combine the two, deciding how chances join when both events must happen.
- NYS standards
- Grade level
- Grade 7 content, by NYS standard
- Compared with grade 7
- At grade 7 Compound probability is grade 7 work, often done with a table of outcomes. Each chance here comes from one week's frequencies, and joining the morning and afternoon events in one step is about the usual grade 7 demand.
- Estimated difficulty
- Moderate: several steps, or a close reading with one strong distractor.
- Thinking it demands
- Depth of knowledge 2, skills and concepts · mainly apply
- What makes it hard
- Something you must already know moderate
- Turning words into math minor
- Solution
- 3 steps
- Reading level
- Question and choices: about grade 5, 48 words.
- Corrected from the DOE handbook
- An inaccurate detail in the explanation was corrected.
- Students, last 30 days
- Not enough answers yet to show (it takes 10).
Why it is hard, traps and wrong answers (shows the answer)
Why it is hard
Once the two chances are written, the question is how they combine. Pooling the week into 7 bus rides out of 10 trips, or adding fractions in some way, gives listed choices that look reasonable, since each lies between 0 and 1. Picturing the 25 pairings of a morning with an afternoon, 3 × 4 = 12 of which have both rides, shows why the chances multiply.
Something you must already know moderate Working it out
The rule that two independent events both happen with the product of their chances, 3/5 times 4/5, is not given, and “the morning and the afternoon” is the only signal for it. (Anderson & Krathwohl, 2001)
Turning words into math minor Understanding the question
The counts “3 of the 5 mornings” and “4 of the 5 afternoons” have to become two separate probabilities based on last week, not one pool of 10 trips. (Hegarty, Mayer & Monk, 1995; Koedinger & Nathan, 2004)
Strategy: Turn each count into a probability, then multiply them, since both rides must happen; picturing a table of 5 mornings by 5 afternoons shows why multiplying works.
Traps
- Misunderstands the concept: A wrong belief about a concept: that percents can be added, that area grows like length, that averages can be averaged, that a bigger denominator means a bigger fraction.
- A faulty procedure: A systematic but wrong procedure: adding fractions straight across, applying an exponent to each term of a sum, dropping a sign when moving a term.
- Wrong operation: Adds instead of multiplying, divides the wrong way round, turns a ratio or rate upside down, or undoes a step in the wrong direction (subtracts what should be added back).
The wrong answers, classified
A Wrong operation (Hegarty, Mayer & Monk, 1995; King et al., 2004)
Subtracts the morning chance from the afternoon chance, 4/5 − 3/5 = 1/5, an operation with no meaning for two rides that must both happen.
B A faulty procedure (Brown & Burton, 1978; Tatsuoka, 1983)
Adds the numerators, 3 + 4, but multiplies the denominators, 5 × 5, mixing the rule for adding fractions with the rule for multiplying them.
D Misunderstands the concept (Smith, diSessa & Roschelle, 1993; De Bock et al., 1998; Ni & Zhou, 2005)
Pools the week’s trips into 7 bus rides out of 10, a rate for a single trip, as if riding both ways next Monday were just as likely.
What was corrected from the DOE handbook, and why
- Explanation: The DOE’s explanation says “The probability that Emily will ride the bus to school on any given afternoon is 4/5.” The question says she rode the bus home on 4 of the 5 afternoons; her rides to school are the morning ones. The site now says “ride the bus home on any given afternoon”.
Worked solution, step by step
Formulas used
- Probability from past results
- P is the probability, the chance something happens. You use what happened before to predict the chance it happens again. Emily rode in 3 of 5 mornings, so the chance for one morning is 3/5.
- Both of two independent events
- A and B are two events. Independent means one does not change the chance of the other. To find the chance that both happen, multiply their chances. The result is smaller than either one, since both must happen.
Sort out the question
Last week Emily:
- rode the bus to school on 3 of the 5 mornings;
- rode the bus home on 4 of the 5 afternoons.
You need the chance that she rides the bus in the morning and in the afternoon next Monday. The word and means both rides must happen.
Write each chance
Use last week to find each chance:
- Bus to school on a morning:
- Bus home on an afternoon:
Keep them apart. The morning rides go to school, and the afternoon rides go home.
Multiply the two chances
Both rides must happen, so multiply:
Why multiply? Pair each of the 5 mornings with each of the 5 afternoons. That makes 25 pairs. In of them, she rides both times. So the chance is 12 out of 25.
Avoid the tempting wrong choices
Watch out: pooling the week gives 7 rides out of 10 trips, or 7/10, choice D. That is the chance for one trip, not for two trips on one day.
Adding the tops but multiplying the bottoms gives 7/25, choice B. Subtracting the chances gives 1/5, choice A.
So the answer is C, .
Check your answer
The chance of both rides must be less than the chance of each ride alone. As decimals, 12/25 = 0.48. That is less than 3/5 = 0.6 and 4/5 = 0.8. Choice D, 7/10 = 0.7, is more than 3/5, so it cannot be right.
More questions like this
The original DOE question
Question 13 of 61
2026 Practice Test D Math, question 39Question
The table shows the probabilities of a hockey team scoring different numbers of goals in a game.
HOCKEY GOAL PROBABILITIES
| Number of Goals | Probability |
|---|---|
| 0 | 0.16 |
| 1 | 0.21 |
| 2 | 0.29 |
| 3 | 0.21 |
| 4 | 0.09 |
| 5 | 0.04 |
What is the probability that the team will score three or more goals in the next game?
- A0.13
- B0.21
- C0.34
- D0.50
Show the answer
Correct answer: C
To find the probability that any one of several mutually exclusive events occurs, use the addition rule, and add the probabilities of each event:
Using the data in the table, the probability that the team will score 3 or more goals in the next game is represented by
Question analysis
A table gives the probabilities of a hockey team scoring 0 to 5 goals in a game, and students find the chance that it scores three or more goals in the next one. This probability question tests adding the probabilities of separate outcomes. Reading exactly which rows the phrase covers is the main point of care.
- Grade level
- Grade 6 content, by NYS standard
- Compared with grade 7
- Below grade 7 Finding the probability of an event from a given probability model is grade 6 work in New York. Here the model is a table, and the task is choosing the right rows and adding decimals, shorter than typical grade 7 work.
- Estimated difficulty
- Routine: one familiar step, little to misread.
- Thinking it demands
- Depth of knowledge 1, recall and reproduction · mainly apply
- What makes it hard
- Solution
- 2 steps
- Reading level
- Question and choices: about grade 8, 40 words.
- Students, last 30 days
- Not enough answers yet to show (it takes 10).
Why it is hard, traps and wrong answers (shows the answer)
Why it is hard
Adding three decimals is easy, so the question turns on which rows the words cover. Including the 3-goal row, and not stopping at it, are the two decisions, and each misreading gives a listed choice. Checking the complement, 1 − (0.16 + 0.21 + 0.29), confirms both the sum and the choice of rows.
Turning words into math minor Understanding the question
The phrase “three or more goals” has to become the three rows for 3, 4 and 5 goals, starting at the 3-goal row itself. (Hegarty, Mayer & Monk, 1995; Koedinger & Nathan, 2004)
Reading a figure, table or graph minor Understanding the question
The table lists six probabilities, two of them both 0.21, so the rows for 3, 4 and 5 goals must be picked out by their goal counts, not by their values. (Lesh, Post & Behr, 1987; Kirsch & Mosenthal, 1990)
Strategy: Decide which rows the words "three or more" cover, add their probabilities, and check by subtracting the total of the other rows from 1.
Traps
- Counting the ends: Inclusive or exclusive ends, fence posts, consecutive numbers: an answer that is one too many or too few, or an endpoint drawn open where it belongs closed (or the reverse).
- Misreads the question: Misses or misreads a condition or a word in the question: "at least", "each", "remaining", "not".
- Misunderstands the concept: A wrong belief about a concept: that percents can be added, that area grows like length, that averages can be averaged, that a bigger denominator means a bigger fraction.
The wrong answers, classified
A Counting the ends (Brown & Burton, 1978)
Adds only the rows for 4 and 5 goals, 0.09 + 0.04 = 0.13, reading three or more as more than three and leaving out the end row.
B Misreads the question (Hegarty, Mayer & Monk, 1995)
Reads only the row for exactly 3 goals, 0.21, overlooking the words “or more” and the two rows below it.
D Misunderstands the concept (Smith, diSessa & Roschelle, 1993; De Bock et al., 1998; Ni & Zhou, 2005)
Counts 3 of the 6 rows, for 3, 4 and 5 goals, as half the outcomes, ignoring that the table gives them different probabilities.
Worked solution, step by step
Formulas used
- Adding probabilities
- A and B are two events that cannot both happen at once, like scoring exactly 3 goals and exactly 4 goals. The chance that one or the other happens is the sum of their chances.
- The chance it does not happen
- The chances of all possible outcomes add up to 1. So the chance an event does not happen is 1 minus the chance it does. Use it to check an answer from the other side.
Sort out the question
The table gives the chance of each number of goals, from 0 to 5. You need the chance the team scores three or more goals in the next game.
Pick the right rows
Three or more means 3 goals, 4 goals or 5 goals. The row for 3 counts too. Read those three rows:
- 3 goals: 0.21
- 4 goals: 0.09
- 5 goals: 0.04
Watch out: leaving out the 3-goal row gives 0.09 + 0.04 = 0.13, choice A. Using only the 3-goal row gives 0.21, choice B.
Add the chances
A game can end with only one number of goals. So add the three chances:
Watch out: three of the six rows is half the rows, but that does not make the chance 0.50, choice D. The rows have different chances.
So the answer is C, 0.34.
Check your answer
Find the chance of fewer than 3 goals, the other rows: . Then the chance of 3 or more is . Both ways give 0.34.
More questions like this
The original DOE question
Question 14 of 61
2024 Test A Math, question 5Question
RESULTS FROM SURVEY OF 110 FAMILIES
| Number of Children in the Family | Number of Families |
|---|---|
| 0 | 45 |
| 1 | 32 |
| 2 | 19 |
| 3 | 8 |
| 4 | 6 |
The table above shows the number of children in each of 110 families. What is the median number of children in these families?
Grid-in question: work out the answer and enter it as a number.
Show the answer
Correct answer: 1
Since 110 families were surveyed, the median will have 55 values less than or equal to it, and 55 values greater than or equal to it.
If the values in the table were listed in order, they would look like this:
The first row of the table indicates that 45 families had 0 children.
The second row of the table indicates that 32 families had 1 child.
So 77 families had either 0 children or 1 child, and 45 families had 0 children.
Since 55 is between 45 and 77, the median must be a value in the second row of the table.
So the median is 1.
Question analysis
This statistics grid-in gives a frequency table from a survey of 110 families, showing how many families have each number of children from none to four. Students find the median number of children per family. The table lists counts rather than the 110 data values themselves, so locating the middle value takes a running total of the families.
- Grade level
- Grade 6 content, by NYS standard
- Compared with grade 7
- Above grade 7 Grade 7 median problems usually list a dozen or so values. Here 110 values are hidden in a frequency table, so students must reason about positions with a running count, a less familiar and more error-prone task.
- Estimated difficulty
- Hard: combines ideas, needs a plan, and has more than one tempting wrong answer.
- Thinking it demands
- Depth of knowledge 2, skills and concepts · mainly apply
- What makes it hard
- Reading a figure, table or graph major
- No obvious method moderate
- An answer in an unexpected form minor
- Solution
- 3 steps
- Reading level
- Question and choices: about grade 7, 35 words.
- Students, last 30 days
- Not enough answers yet to show (it takes 10).
Why it is hard, traps and wrong answers (shows the answer)
Why it is hard
Students know a median as the middle of a list, but here the list is never written out. Treating the table's columns as the data gives quick, confident answers, 2 from the middle of the children column or 19 from the middle of the family counts, and neither can be checked against choices. The question rewards counting positions: 45 families have no children, so the 55th and 56th families both fall among the 32 with one child.
Reading a figure, table or graph major Understanding the question
The table hides 110 data values in five rows: the 0 to 4 column lists the possible values, and 45, 32, 19, 8 and 6 say how many families have each. (Lesh, Post & Behr, 1987; Kirsch & Mosenthal, 1990)
No obvious method moderate Working it out
The median of 110 values lies between the 55th and 56th; finding them takes a running count of families, 45 and then 77, a method seldom practiced with tables. (Schoenfeld, 1985)
An answer in an unexpected form minor Choosing the answer
As a grid-in there are no choices to compare, so a student who takes the middle row's 2 has nothing on the page to suggest it is wrong. (Enright, Morley & Sheehan, 2002)
Strategy: With 110 values the median sits between the 55th and 56th; add the family counts row by row until the running total passes 55, and read that row's number of children.
Traps
- Misunderstands the concept: A wrong belief about a concept: that percents can be added, that area grows like length, that averages can be averaged, that a bigger denominator means a bigger fraction.
- Answers a different question: A choice is right for another quantity: the other unknown, the rest instead of the part, the part instead of the whole.
The wrong answers, classified
2 Misunderstands the concept (Smith, diSessa & Roschelle, 1993; De Bock et al., 1998; Ni & Zhou, 2005)
Takes the middle entry of the children column, 0 to 4, ignoring that each number of children belongs to a different number of families.
19 Answers a different question (King et al., 2004; Hegarty, Mayer & Monk, 1995)
Finds the median of the Number of Families column, 6, 8, 19, 32 and 45, a middle family count rather than a number of children.
1.07 Answers a different question (King et al., 2004; Hegarty, Mayer & Monk, 1995)
Computes the mean instead, 118 children among 110 families, about 1.07, a different measure of center from the median asked for.
Worked solution, step by step
Formulas used
- Spot of the median
- The median is the middle value when all the values are put in order. n is how many values there are. This gives the spot of the middle value, with the same number of values before and after it. If it ends in a half, the median is halfway between the two values on either side.
Sort out the table
The table covers 110 families. The left column is a number of children. The right column says how many families have that many children. For example, 45 families have 0 children. You need the median number of children. The median is the middle value when all the values are in order.
Picture the values in order
Think of a list with one number for each family: how many children it has. The list has 45 zeros, then 32 ones, then 19 twos, then 8 threes, then 6 fours. It is already in order, from least to most.
There are 110 values. Watch out: the median is not the middle row, 2. Each row stands for a different number of families.
Find the middle spot
Use the median rule with n = 110.
The middle is halfway between the 55th and 56th values. So you need those two values in the list.
Count down the list
Keep a running total of families, row by row. The zeros fill spots 1 to 45. Now add the 32 families with 1 child.
So the ones fill spots 46 to 77. Spot 55 and spot 56 are both in that range. So both values are 1.
Give the median
The 55th and 56th values are both 1. Halfway between 1 and 1 is 1. So the median is 1 child. Watch out: the median is a number of children, not of families. Gridding 19, from the families column, is wrong. So is the mean, or average, which is about 1.07. So you would grid 1.
Check your answer
Half of 110 is 55. Families with 0 children: 45, which is less than half. So the median is not 0. Families with 0 or 1 child: 77, which is more than half. So the median is not more than 1. It must be 1.
More questions like this
The original DOE question
Question 15 of 61
2024 Test A Math, question 15Question
A program on a computer randomly generates a sequence of whole numbers from 1 to 9, inclusive. If the computer generates a sequence of 300 numbers, what is the best prediction of the number of odd numbers in the sequence?
- A120
- B133
- C150
- D167
Show the answer
Correct answer: D
There are five odd numbers in the range 1 through 9: 1, 3, 5, 7, and 9.
So the proportion of odd numbers in the range 1 through 9 is .
The expected number of odd values in the sequence from the computer program is
So the best prediction for the number of odd numbers in the sequence is 167.
Question analysis
A probability question: a computer randomly generates 300 whole numbers from 1 to 9, and students predict how many will be odd. It asks students to find the probability of an odd number and use it to predict a count. Counting carefully which of the nine numbers are odd, and rounding the prediction sensibly, are the points to watch.
- Grade level
- Grade 6 content, by NYS standard
- Compared with grade 7
- At grade 7 Using a probability to predict how often an event happens is grade 6 and 7 work. This takes two short steps plus a rounding decision, about the demand of a typical grade 7 probability task.
- Estimated difficulty
- Straightforward: two steps or one careful reading.
- Thinking it demands
- Depth of knowledge 2, skills and concepts · mainly apply
- What makes it hard
- Solution
- 3 steps
- Reading level
- Question and choices: about grade 11, 37 words.
- Students, last 30 days
- Not enough answers yet to show (it takes 10).
Why it is hard, traps and wrong answers (shows the answer)
Why it is hard
The method is short, a probability times 300, so the question is decided by the probability. Odd and even feel like an even split, and half of 300 is a listed choice, but the numbers 1 to 9 hold five odd and four even. Listing the nine numbers before computing removes the trap, and the result, about 167, then needs only rounding.
Turning words into math minor Understanding the question
The phrase "whole numbers from 1 to 9, inclusive" means nine equally likely values, five of them odd, so the chance of odd is 5/9, not the one half that odd and even suggest. (Hegarty, Mayer & Monk, 1995; Koedinger & Nathan, 2004)
Something you must already know minor Working it out
The stem never says that an expected count is the probability times the number of trials, here 5/9 of the 300 numbers generated. (Anderson & Krathwohl, 2001)
Error-prone arithmetic minor Working it out
The product 300 × 5/9 is 166.67, not a whole number, so the prediction has to be rounded to the nearest whole number. (Brown & Burton, 1978; Junker & Sijtsma, 2001)
Strategy: Count the odd numbers from 1 to 9, write the probability as that count over 9, and multiply by 300, rounding to the nearest whole number.
Traps
- Misunderstands the concept: A wrong belief about a concept: that percents can be added, that area grows like length, that averages can be averaged, that a bigger denominator means a bigger fraction.
- Answers a different question: A choice is right for another quantity: the other unknown, the rest instead of the part, the part instead of the whole.
The wrong answers, classified
A Little reason to choose it (Haladyna & Downing, 1993; Rodriguez, 2005)
No count of the nine numbers gives 120, which is 40% of 300; reaching it takes two errors at once, so it mostly attracts guesses.
B Answers a different question (King et al., 2004; Hegarty, Mayer & Monk, 1995)
Counts the four even numbers instead of the five odd ones and predicts 4/9 of 300, about 133.
C Misunderstands the concept (Smith, diSessa & Roschelle, 1993; De Bock et al., 1998; Ni & Zhou, 2005)
Assumes odd and even numbers are equally likely and takes half of 300, ignoring that 1 to 9 holds one more odd number than even.
Worked solution, step by step
Formulas used
- Probability
- P is the probability, the chance that something happens. Possible results are all the results that are equally likely. Wanted results are the ones you are looking for. The chance is the fraction of the results that you want.
- Expected count
- E is the expected count, your best guess of how many times something will happen. P is its probability, and n is the number of tries. If something happens 5 times out of 9, it should happen about 5 ninths of the time in many tries.
Sort out the question
The computer picks whole numbers from 1 to 9. Inclusive means 1 and 9 count too. Randomly means each number has the same chance. It picks 300 numbers. You need the best guess of how many of them are odd.
Count the odd numbers
An odd number does not split evenly by 2. From 1 to 9, the odd numbers are 1, 3, 5, 7 and 9. That is 5 of the 9 numbers. The even ones, 2, 4, 6 and 8, are only 4. Watch out: odd and even are not equally likely here, since there is one more odd number. Taking half of 300 gives 150, choice C.
Find the chance of odd
Each number the computer picks has a 5 in 9 chance of being odd. Watch out: do not use the 4 even numbers. That gives about 133, choice B.
Multiply by the 300 numbers
The sign ≈ means about. You can’t have part of a number, so round to the nearest whole number. 166.7 is closer to 167 than to 166. So the answer is D, 167.
Check your answer
The odd numbers are a bit more than half of the nine. So the answer should be a bit more than half of 300, which is 150. Only 167 is a bit more than 150. Also, 167 odd plus about 133 even makes 300.
More questions like this
The original DOE question
Question 16 of 61
2024 Test A Math, question 17Question
The probability of drawing a red candy at random from a bag of 25 candies is . After 5 red candies are removed from the bag, what is the probability of randomly drawing a red candy from the bag?
- A0
- B
- C
- D
Show the answer
Correct answer: D
Start with a proportion to determine the total number of red candies in the bag:
There are currently 10 red candies out of 25 candies in the bag. After 5 red candies are removed, there would be 5 red candies left in the bag and 20 total candies.
The probability of randomly drawing a red candy would then be .
Question analysis
A probability question about a bag of 25 candies in which the chance of drawing red is 2/5; then 5 red candies are taken out. Students find the new probability of drawing a red candy. They must work out how many red candies there were, then rebuild the fraction from the counts left in the bag.
- Grade level
- Grade 6 content, by NYS standard
- Compared with grade 7
- At grade 7 Simple probability as a fraction of outcomes is grade 6 and 7 content. This adds a step back from the probability to a count and an update after removal, which is typical grade 7 multi-step work.
- Estimated difficulty
- Moderate: several steps, or a close reading with one strong distractor.
- Thinking it demands
- Depth of knowledge 2, skills and concepts · mainly apply
- What makes it hard
- Turning words into math moderate
- Many steps minor
- Solution
- 3 steps
- Reading level
- Question and choices: about grade 7, 40 words.
- Students, last 30 days
- Not enough answers yet to show (it takes 10).
Why it is hard, traps and wrong answers (shows the answer)
Why it is hard
The question gives a probability, not a count, so the first job is to rebuild the bag: 10 red candies among 25. Removing candies changes two numbers at once, and the strongest wrong choice comes from updating the red count while leaving the total at 25. A student who writes both new counts before forming the fraction avoids it.
Turning words into math moderate Understanding the question
The probability 2/5 has to be turned into a count, 10 red of 25, and "after 5 red candies are removed" lowers both the red count and the bag's total. (Hegarty, Mayer & Monk, 1995; Koedinger & Nathan, 2004)
Many steps minor Working it out
Three steps follow in order: 2/5 of 25 = 10, then 5 red among 20 candies left, then 5/20 reduced to lowest terms. (Daniel & Embretson, 2010; Enright, Morley & Sheehan, 2002)
Strategy: Use 2/5 of 25 to find the number of red candies, subtract 5 from both the red count and the total, and write the new fraction in lowest terms.
Traps
- Misreads the question: Misses or misreads a condition or a word in the question: "at least", "each", "remaining", "not".
The wrong answers, classified
A An arithmetic slip (Junker & Sijtsma, 2001)
Takes 2/5 of 25 as 25 ÷ 5 = 5, forgetting to multiply by 2, so removing 5 red candies seems to leave none.
B Little reason to choose it (Haladyna & Downing, 1993; Rodriguez, 2005)
No working gives 1/10, which would need 2 red candies among the 20 left; it mostly draws students who are guessing.
C Misreads the question (Hegarty, Mayer & Monk, 1995)
Subtracts the 5 removed candies from the 10 red ones but keeps 25 as the total, finding 5/25 = 1/5, though the bag now holds 20.
Worked solution, step by step
Formulas used
- Probability
- P is the probability, the chance of drawing a red candy. Red candies is how many red ones are in the bag. All candies is how many candies are in the bag in all. Each candy is equally likely, so the chance is the fraction of the bag that is red.
Sort out the question
The bag has 25 candies. The chance of drawing red is . Then 5 red candies are taken out. You need the new chance of drawing red. Taking out candies changes both the red count and the total.
Find the number of red candies
A chance of means 2 out of every 5 candies are red. Call the red count r.
There are 10 red candies. Watch out: do not stop at . You must also multiply by 2. Thinking there are 5 red candies leads to 0, choice A.
Take out the 5 red candies
Now 5 of the 20 candies are red. Watch out: the total goes down too. Keeping 25 gives , choice C.
Find the new probability
To simplify, divide the top and bottom by 5. So the answer is D, .
Check your answer
At first, is 40% of the bag. Taking out only red candies should lower the chance. is 25%, which is lower but not zero. That makes sense, because 5 red candies are still in the bag.
More questions like this
The original DOE question
Question 17 of 61
2024 Test A Math, question 19Question
8.9, 8.2, 8.5, 9.0, 8.4, 8.6, 8.8
At a skating championship, there are seven judges who each award a score for each skater’s performance. The highest and lowest scores given to each skater are discarded, and the mean of the remaining scores is then calculated and reported as the skater’s final score. What is the final score for the skater who received the scores shown above from the judges?
- A8.60
- B8.62
- C8.64
- D8.70
Show the answer
Correct answer: C
The highest and lowest scores are discarded: 8.2 and 9.0.
To find the mean, add the remaining scores and then divide that sum by the total number of remaining scores.
Question analysis
A statistics question about a skating championship with seven judges: the highest and lowest of a skater's seven scores are dropped, and the rest are averaged. Students apply that rule to the listed scores, decimals close together. Following the dropping rule exactly and adding the decimals carefully both matter, since the choices are very close.
- Grade level
- Grade 6 content, by NYS standard
- Compared with grade 7
- Below grade 7 Finding a mean is grade 6 content, and this adds only a rule about which scores to drop. Grade 7 statistics usually compares whole data sets, so this is easier, though the close choices demand exact decimal arithmetic.
- Estimated difficulty
- Straightforward: two steps or one careful reading.
- Thinking it demands
- Depth of knowledge 2, skills and concepts · mainly apply
- What makes it hard
- A very close wrong answer moderate
- Error-prone arithmetic minor
- Turning words into math minor
- Solution
- 3 steps
- Reading level
- Question and choices: about grade 9, 62 words.
- Students, last 30 days
- Not enough answers yet to show (it takes 10).
Why it is hard, traps and wrong answers (shows the answer)
Why it is hard
The arithmetic is short, but the choices are spaced so closely that a small slip or a skipped rule lands on a neighbor. Averaging all seven scores, or picking the middle score, gives values within a few hundredths of the answer. The question rewards following the stated rule exactly and adding the five remaining scores with care.
A very close wrong answer moderate Choosing the answer
The choices 8.60, 8.62 and 8.64 lie within 0.04 of one another, so no estimate separates them; only the exact sum of the five kept scores, 43.2, does. (Embretson & Wetzel, 1987; Gorin & Embretson, 2006; Ascalon et al., 2007)
Error-prone arithmetic minor Working it out
Five one-decimal scores must be added and divided by 5; subtracting 8 from each first leaves 0.9, 0.5, 0.4, 0.6 and 0.8, which are easier to add. (Brown & Burton, 1978; Junker & Sijtsma, 2001)
Turning words into math minor Understanding the question
The scoring rule takes two sentences to state: discard the single highest and the single lowest score, then average the five that remain. (Hegarty, Mayer & Monk, 1995; Koedinger & Nathan, 2004)
Strategy: Cross out the single highest and the single lowest score, add the five that remain, and divide that sum by 5.
Traps
- Misreads the question: Misses or misreads a condition or a word in the question: "at least", "each", "remaining", "not".
- Answers a different question: A choice is right for another quantity: the other unknown, the rest instead of the part, the part instead of the whole.
The wrong answers, classified
A Answers a different question (King et al., 2004; Hegarty, Mayer & Monk, 1995)
Gives the median, the middle score 8.6, instead of the mean of the five scores left after the highest and lowest are dropped.
B Misreads the question (Hegarty, Mayer & Monk, 1995)
Averages all seven scores without discarding any, 60.4 ÷ 7 = 8.628…, and takes 8.62, the nearest choice to that mean.
D Misreads the question (Hegarty, Mayer & Monk, 1995)
Drops only the lowest score, 8.2, and averages the other six, (60.4 − 8.2) ÷ 6 = 8.7, keeping the top score of 9.0.
Worked solution, step by step
Formulas used
- Mean, or average
- The mean is the average. The sum is what you get when you add all the scores. Divide it by how many scores you added. It shares the total out evenly, as if every score were the same.
Sort out the rule
Seven judges gave the seven scores shown. The rule has two parts. First, throw out the highest score and the lowest score. Then find the mean of the scores that are left. The mean is the average. That is the final score you need.
Cross out the highest and lowest
The highest score is 9.0. The lowest is 8.2. Cross both out. Five scores are left: 8.9, 8.5, 8.4, 8.6 and 8.8. Watch out: drop both. Dropping only 8.2 gives 8.70, choice D. Keeping all seven gives about 8.63, which is closest to 8.62, choice B.
Add the five scores
A shortcut: each score is 8 plus a bit. The bits are 0.9, 0.5, 0.4, 0.6 and 0.8, and they add to 3.2. Five 8s make 40, and .
Divide by the number of scores
Watch out: do not just take the middle score, 8.6. That is the median, choice A. The question asks for the mean. So the answer is C, 8.64.
Check your answer
Multiply back: , the sum. Also, the mean should sit between the lowest kept score, 8.4, and the highest kept score, 8.9. 8.64 does.
More questions like this
The original DOE question
Question 18 of 61
2024 Test A Math, question 28Question
QUIZ SCORES IN
MRS. ARCH’S CLASS
| Quiz Score | Number of Students |
|---|---|
| 60 | 9 |
| 70 | 7 |
| 80 | 4 |
| 90 | 5 |
| 100 | 3 |
In the table above, what is the mean quiz score?
- A60
- B70
- C75
- D80
Show the answer
Correct answer: C
First, find the total number of students who took the quiz.
Multiply each quiz score by the number of students who received that score. Add those products together to find the total number of points scored.
To find the mean quiz score, divide the total number of points by the number of students who took the quiz.
Question analysis
A frequency table question: the table lists five quiz scores from 60 to 100 and how many students in Mrs. Arch's class earned each. Students find the mean quiz score for the whole class. Each score has to count once for every student who earned it, and the class size has to be added up from the table.
- Grade level
- Grade 6 content, by NYS standard
- Compared with grade 7
- At grade 7 A mean from a frequency table is grade 6 content in a three-step form that grade 7 students meet regularly. Five rows of products make it slightly longer than a typical exercise, but the arithmetic is friendly.
- Estimated difficulty
- Moderate: several steps, or a close reading with one strong distractor.
- Thinking it demands
- Depth of knowledge 2, skills and concepts · mainly apply
- What makes it hard
- Reading a figure, table or graph moderate
- Many steps minor
- Error-prone arithmetic minor
- Solution
- 3 steps
- Reading level
- Question and choices: about grade 2, 19 words.
- Students, last 30 days
- Not enough answers yet to show (it takes 10).
Why it is hard, traps and wrong answers (shows the answer)
Why it is hard
The table invites a shortcut: average the five scores in the first column and get a round number that is a choice. That ignores the fact that more students earned the low scores than the high ones, which pulls the true mean down. Weighting each score by its count is a five-row calculation with friendly numbers, and the other choices catch students who confuse the mean with the most common or the middle score.
Reading a figure, table or graph moderate Understanding the question
Each row of the table stands for several students, 9 with 60, 7 with 70 and so on, so a score counts once per student and the class size, 28, must be added up. (Lesh, Post & Behr, 1987; Kirsch & Mosenthal, 1990)
Many steps minor Working it out
Five products, 540, 490, 320, 450 and 300, must be found and added to 2,100 before dividing by the 28 students. (Daniel & Embretson, 2010; Enright, Morley & Sheehan, 2002)
Error-prone arithmetic minor Working it out
The last step, 2,100 ÷ 28, is not a familiar fact; noticing that 28 × 75 = 2,100, or testing the choices, keeps it quick. (Brown & Burton, 1978; Junker & Sijtsma, 2001)
Strategy: Multiply each score by its number of students, add the products for the total points, add the student counts, and divide the points by the students.
Traps
- Misunderstands the concept: A wrong belief about a concept: that percents can be added, that area grows like length, that averages can be averaged, that a bigger denominator means a bigger fraction.
- Answers a different question: A choice is right for another quantity: the other unknown, the rest instead of the part, the part instead of the whole.
The wrong answers, classified
A Answers a different question (King et al., 2004; Hegarty, Mayer & Monk, 1995)
Picks the score that the most students earned, 60, the mode of the class, instead of computing the mean.
B Answers a different question (King et al., 2004; Hegarty, Mayer & Monk, 1995)
Finds the median instead: in the ordered list of 28 scores, the 14th and 15th are both 70.
D Misunderstands the concept (Smith, diSessa & Roschelle, 1993; De Bock et al., 1998; Ni & Zhou, 2005)
Averages the five listed scores, (60 + 70 + 80 + 90 + 100) ÷ 5 = 80, without weighting each by its number of students.
Worked solution, step by step
Formulas used
- Mean from a table
- The mean is the average score. Total points is every student’s score added up. Each score in the table counts once for every student who got it. Number of students is how many took the quiz.
Sort out the table
The left column lists quiz scores. The right column says how many students got each score. For example, 9 students scored 60. You need the mean quiz score, which is the average.
Count the students
28 students took the quiz. So there are 28 scores in all, not just 5.
Find the total points
Each score counts once for each student who got it. So multiply each score by its number of students.
Score Students Points 60 9 70 7 80 4 90 5 100 3 The class scored 2,100 points in all.
Divide to find the mean
To divide, try . That leaves , and . So the mean is . Watch out: do not just average the five scores in the table. That gives 80, choice D. Also, 70 is the median and 60 is the most common score, choices B and A. So the answer is C, 75.
Check your answer
More students scored low, 60 or 70, than high. So the mean should be below 80, the middle of the listed scores. 75 is below 80. Also, , the total points.
More questions like this
The original DOE question
Question 19 of 61
2024 Test A Math, question 41Question
Terrell played 5 computer games and earned a mean score of 8 points per game. If his mean score for the first 4 games was 7 points per game, how many points was his score in the fifth game?
- A9
- B11
- C12
- D14
Show the answer
Correct answer: C
If the mean number of points for the first four games is 7, the total number of points earned in those games is 28.
If the mean number of points for all five games is 8, the total number of points earned is 40.
To find the number of points in the fifth game, find the difference between 40 and 28.
Question analysis
This mean, or average, word problem says Terrell averaged 8 points over 5 computer games and 7 points over the first 4, and asks for his score in the fifth game. Students turn each average into a total and compare the totals. Combining the two averages directly, without going through totals, is the tempting shortcut that fails.
- Grade level
- Grade 6 content, by NYS standard
- Compared with grade 7
- At grade 7 Computing a mean is grade 6 content. Working backward from two means to the totals they stand for, then to one missing score, is a common grade 7 test task, and it comes with a tempting shortcut.
- Estimated difficulty
- Moderate: several steps, or a close reading with one strong distractor.
- Thinking it demands
- Depth of knowledge 2, skills and concepts · mainly apply
- What makes it hard
- Turning words into math moderate
- Something you must already know minor
- Solution
- 3 steps
- Reading level
- Question and choices: about grade 4, 35 words.
- Students, last 30 days
- Not enough answers yet to show (it takes 10).
Why it is hard, traps and wrong answers (shows the answer)
Why it is hard
The question rewards turning both means into totals, 40 points for five games and 28 for four, after which one subtraction finishes it. Averaging 7 with the unknown score is a quick shortcut that gives a listed choice, but it weighs four games as one. Checking that 28 plus the answer, divided by 5, gives 8 catches that error and the near miss next to the answer.
Turning words into math moderate Understanding the question
Each mean has to become a total before the fifth game can be found: "a mean score of 8 points per game" over 5 games means 40 points in all. (Hegarty, Mayer & Monk, 1995; Koedinger & Nathan, 2004)
Something you must already know minor Working it out
Students must know that a total is the mean times the number of games, and that means over different numbers of games cannot simply be averaged. (Anderson & Krathwohl, 2001)
Strategy: Turn each mean into a total by multiplying by its number of games, then subtract the four-game total from the five-game total.
Traps
- Misunderstands the concept: A wrong belief about a concept: that percents can be added, that area grows like length, that averages can be averaged, that a bigger denominator means a bigger fraction.
The wrong answers, classified
A Misunderstands the concept (Smith, diSessa & Roschelle, 1993; De Bock et al., 1998; Ni & Zhou, 2005)
Averages the four-game mean with the fifth score, (7 + x) ÷ 2 = 8, so x = 9, as if the first four games counted once.
B Counting the ends (Brown & Burton, 1978)
Sees the fifth game must lift the mean 1 point above 7 but spreads that over only 4 games, 7 + 4 = 11, instead of all 5.
D Little reason to choose it (Haladyna & Downing, 1993; Rodriguez, 2005)
No common working gives 14, which is twice the four-game mean and matches no total or difference, so it mostly draws guesses.
Worked solution, step by step
Formulas used
- Total from a mean
- The mean, or average, is what each game would score if the total were shared out equally. So the total is the mean times the number of games. Use it to turn each mean back into a total. Totals can be subtracted, but means over different numbers of games can’t.
Sort out the question
Terrell played 5 games. His mean score for all 5 was 8 points per game. His mean for the first 4 games was 7 points per game. The mean, or average, is the total split equally among the games. You need his score in game 5.
Find the total for all 5 games
Turn the mean for all 5 games into a total. Multiply the mean by the number of games.
He scored 40 points in all 5 games together.
Find the total for the first 4 games
Use the same formula with the mean of 7 and 4 games.
He scored 28 points in the first 4 games.
Subtract to find game 5
The 40 points include the first 4 games and game 5. Take away the first 4 games to leave game 5.
He scored 12 points in game 5. Watch out: don’t average 7 and the fifth score as if they were two games. That gives 9, choice A. The 7 stands for 4 games, not 1. Watch out: adding 4 to 7 gives 11, choice B. Each of the first 4 games was 1 point below 8. So game 5 needs 8 plus 4 more points.
So the answer is C, 12 points.
Check your answer
Try scores of 7, 7, 7, 7 and 12. They add up to , and . That is the mean for all 5 games, so 12 is right.
More questions like this
The original DOE question
Question 20 of 61
2024 Test A Math, question 47Question
In a survey of 200 adults in the town of Waskegon, 45 reported reading the online version of the Waskegon Bulletin the previous day. If 25,000 adults live in Waskegon, which number is the best estimate of the number of adults who read the online version of the Waskegon Bulletin the previous day?
- A5,600
- B9,000
- C11,300
- D24,800
Show the answer
Correct answer: A
In the survey, 45 out of 200 adults reported reading the online version of the Waskegon Bulletin, and there are 25,000 adults living in Waskegon. Set up a proportion to find the number of adults who read the online version.
Rounded to the nearest 100, this number is 5,600.
Question analysis
In a survey of 200 adults in Waskegon, 45 said they read the online Waskegon Bulletin the day before, and the town has 25,000 adults. This sampling question asks for the best estimate of how many adults in town read it. Students scale the sample's rate up to the population with a proportion and round.
- Grade level
- Grade 6 content, by NYS standard
- Compared with grade 7
- At grade 7 Using a sample to estimate a count for a whole population is typical grade 7 statistics and ratio work. This version takes one proportion with large numbers and a rounding step, about the usual grade 7 demand.
- Estimated difficulty
- Straightforward: two steps or one careful reading.
- Thinking it demands
- Depth of knowledge 2, skills and concepts · mainly apply
- What makes it hard
- Turning words into math minor
- Error-prone arithmetic minor
- Solution
- 3 steps
- Reading level
- Question and choices: about grade 13, 50 words.
- Students, last 30 days
- Not enough answers yet to show (it takes 10).
Why it is hard, traps and wrong answers (shows the answer)
Why it is hard
The idea is a single proportion, and the choices are far apart, so a reasonable estimate is enough. The main trap is treating 45 out of 200 as 45 percent, which doubles the estimate; the other wrong choices combine the survey numbers without a proportion. Noting that 45 is a bit under a quarter of 200, so the town figure must be a bit under a quarter of 25,000, confirms the choice.
Turning words into math minor Understanding the question
The survey's 45 out of 200 is a rate to scale up to the town's 25,000 adults, a fraction of the sample rather than a percent. (Hegarty, Mayer & Monk, 1995; Koedinger & Nathan, 2004)
Error-prone arithmetic minor Working it out
The scale factor 25,000 ÷ 200 = 125 and the product 45 × 125 = 5,625 involve large numbers, and the result must then be rounded to the nearest hundred. (Brown & Burton, 1978; Junker & Sijtsma, 2001)
Strategy: Set the survey's fraction, 45 out of 200, equal to the unknown number out of 25,000, then scale up: 25,000 is 125 times 200.
Traps
- Numbers taken from the question: Combines the numbers in the question without a model of the situation, or is simply a number that appears in the question.
- Misunderstands the concept: A wrong belief about a concept: that percents can be added, that area grows like length, that averages can be averaged, that a bigger denominator means a bigger fraction.
The wrong answers, classified
B Numbers taken from the question (Hegarty, Mayer & Monk, 1995)
Multiplies the two survey numbers, 45 × 200 = 9,000, combining numbers from the question without setting up a proportion.
C Misunderstands the concept (Smith, diSessa & Roschelle, 1993; De Bock et al., 1998; Ni & Zhou, 2005)
Treats 45 out of 200 as 45 percent, as if 100 adults were surveyed: 0.45 × 25,000 = 11,250, about 11,300.
D Numbers taken from the question (Hegarty, Mayer & Monk, 1995)
Subtracts the 200 surveyed adults from the 25,000 in town, giving the number of adults who were not surveyed.
Worked solution, step by step
Formulas used
- Proportion
- A proportion says two ratios are equal. A ratio compares two numbers by dividing. Here a out of b in the survey matches c out of d in the whole town. Use it when a small group stands for a bigger group.
Sort out the question
A survey asked 200 adults, and 45 of them read the online paper. The town has 25,000 adults. You need a good estimate of how many adults in the whole town read it. Assume the town is like the survey. Then the same fraction of adults read it.
Set up a proportion
A proportion says two fractions are equal. Let x be the number of readers in the town. The fraction of readers is the same in both groups.
Watch out: multiplying 45 by 200 gives 9,000, choice B. That mixes the numbers without a plan.Find the scale factor
The scale factor is how many times bigger the town is than the survey group.
The town is 125 times as big. So multiply the top, 45, by 125 too.
Scale up the readers
Break 125 into 100 and 25.
About 5,625 adults read it. Watch out: 45 out of 200 is not 45%. A percent is out of 100. Using 45% gives about 11,300, choice C.
Round to the nearest hundred
The choices are rounded, since this is an estimate. 5,625 is between 5,600 and 5,700. Its last two digits, 25, are less than 50, so round down to 5,600.
So the answer is A, 5,600.
Check your answer
45 out of 200 is a bit less than 50 out of 200, which is one fourth. One fourth of 25,000 is 6,250. So the answer should be a bit less than 6,250. 5,600 fits, and the other choices are all much bigger.
More questions like this
The original DOE question
Question 21 of 61
2024 Test A Math, question 54Question
The probability of an event occurring is 0.05. What is the chance that the event will occur?
- Alikely
- Bunlikely
- Cimpossible
- Dneither likely nor unlikely
Show the answer
Correct answer: B
The probability of the event is 0.05, which equals 5%, which is less than 50%.
Option A:
An event that is likely has a probability over 50%.
Option B:
An event that is unlikely has a probability less than 50% but greater than 0%.
Option C:
An event that is impossible has a 0% probability.
Option D:
An event that is neither likely nor unlikely has a 50% probability.
Question analysis
This probability question gives an event a probability of 0.05 and asks how likely the event is to occur, described in words. Students place the decimal on the scale from 0, impossible, to 1, certain. Reading the place value of the decimal correctly is the only real hurdle.
- NYS standards
- 6.SP.6 probability from 0 to 1
- Grade level
- Grade 6 content, by NYS standard
- Compared with grade 7
- Below grade 7 Describing in words how likely an event is from its probability between 0 and 1 is a grade 6 standard. This is one quick judgment with no computation, well below grade 7 probability work with compound events.
- Estimated difficulty
- Routine: one familiar step, little to misread.
- Thinking it demands
- Depth of knowledge 1, recall and reproduction · mainly understand
- What makes it hard
- Solution
- 1 step
- Reading level
- Question and choices: about grade 10, 23 words.
- Students, last 30 days
- Not enough answers yet to show (it takes 10).
Why it is hard, traps and wrong answers (shows the answer)
Why it is hard
One judgment answers the question: 0.05 is a small probability, but it is not zero. The two tempting errors are treating a small chance as no chance at all and misreading 0.05 as 0.5, an even chance. Writing the probability as 5% or as 1 in 20 makes its size plain.
Something you must already know minor Working it out
The probability scale, 0 for impossible, 1/2 for an even chance and 1 for certain, is assumed, and 0.05 has to be placed near its low end. (Anderson & Krathwohl, 2001)
Strategy: Picture the probability scale from 0 to 1, with 0 for impossible, 1/2 for an even chance and 1 for certain, and see where 0.05 falls.
Traps
- Misunderstands the concept: A wrong belief about a concept: that percents can be added, that area grows like length, that averages can be averaged, that a bigger denominator means a bigger fraction.
- An arithmetic slip: The right method with a plausible arithmetic error: a digit, a place value or a times-table fact.
The wrong answers, classified
A Little reason to choose it (Haladyna & Downing, 1993; Rodriguez, 2005)
No common reading makes 0.05 likely, which would need a probability above one half, so it mostly draws guesses.
C Misunderstands the concept (Smith, diSessa & Roschelle, 1993; De Bock et al., 1998; Ni & Zhou, 2005)
Treats a probability close to 0 as exactly 0, as if an event with a 1 in 20 chance could never happen.
D An arithmetic slip (Junker & Sijtsma, 2001)
Reads 0.05 as 0.5, a place-value slip, which would mean an even chance of happening or not.
Worked solution, step by step
Formulas used
- Probability scale
- P is the probability of an event, a number that tells how likely it is to happen. It is always from 0 to 1. 0 means impossible, and 1 means certain. One half, or 0.5, means an even chance. The closer P is to 0, the less likely the event.
Sort out the question
Probability is a number that tells how likely an event is. An event is something that might happen. Here the probability is 0.05. You need the word that best describes that chance.
Change 0.05 to a percent
So 0.05 is 5 out of 100, or 5%. That is the same as 1 chance in 20. Watch out: 0.05 is not 0.5. A probability of 0.5 would be an even chance, choice D.
Place it on the scale
Probability Chance 0 impossible more than 0, less than 0.5 unlikely 0.5 neither likely nor unlikely more than 0.5, less than 1 likely 1 certain 0.05 is more than 0 but much less than 0.5. So the event is unlikely.
Rule out the other choices
Watch out: a small chance is still a chance. 0.05 is more than 0, so the event can happen. It is not impossible, choice C. Likely, choice A, would need more than 0.5.So the answer is B, unlikely.
Check your answer
Picture 20 tries. With a 5% chance, the event would happen about once, since 5% of 20 is 1. It would not happen about 19 times. That is rare but possible, so unlikely fits.
More questions like this
The original DOE question
Question 22 of 61
2024 Test B Math, question 17Question
A bowl contains 12 green candies, 4 yellow candies, and some red candies. The probability of choosing a green candy at random is twice as great as the probability of choosing a red candy at random. What is the probability of choosing a yellow candy at random?
- A
- B
- C
- D
Show the answer
Correct answer: A
The probability of choosing a green candy is twice as great as the probability of choosing a red candy. There are 12 green candies. Let r = the number of red candies.
So there are 6 red candies. 12 green candies + 4 yellow candies + 6 red candies = 22 total candies.
There are 4 yellow candies out of a total of 22 candies. So the probability of choosing a yellow candy is
.
Question analysis
A probability question about a bowl of 12 green candies, 4 yellow candies and an unknown number of red ones. A green candy is twice as likely to be picked as a red one, and students find the chance of picking a yellow candy. The missing red count has to be worked out before any probability can be found.
- Grade level
- Grade 6 content, by NYS standard
- Compared with grade 7
- Above grade 7 Simple probability is grade 6 content in New York, and grade 7 problems usually give every count. Working backward from a comparison of two probabilities to a missing count, then forward to a third probability, is more than typical grade 7 work.
- Estimated difficulty
- Hard: combines ideas, needs a plan, and has more than one tempting wrong answer.
- Thinking it demands
- Depth of knowledge 2, skills and concepts · mainly apply
- What makes it hard
- Turning words into math moderate
- Combines ideas moderate
- Solution
- 3 steps
- Reading level
- Question and choices: about grade 7, 49 words.
- Students, last 30 days
- Not enough answers yet to show (it takes 10).
Why it is hard, traps and wrong answers (shows the answer)
Why it is hard
The question withholds the red count, and everything depends on recovering it from the comparison of probabilities. Students who cannot make that step tend to leave red out altogether, while those who find 6 red candies can still slip at the end by using the wrong total or the wrong color. Writing all three counts and the total of 22 before forming any fraction prevents both endings.
Turning words into math moderate Understanding the question
“Twice as great as the probability of choosing a red candy” must become 12 = 2 × the red count, which works only because both probabilities share one total. (Hegarty, Mayer & Monk, 1995; Koedinger & Nathan, 2004)
Combines ideas moderate Working it out
An unknown count has to be found from a ratio before any probability can be written, joining proportional reasoning with probability as a part over the total. (Embretson, 1998; Daniel & Embretson, 2010)
Strategy: Turn twice as likely into a statement about numbers of candies to find the red count, add all three colors for the total, then put the yellow count over that total and simplify.
Traps
- Answers a different question: A choice is right for another quantity: the other unknown, the rest instead of the part, the part instead of the whole.
- Numbers taken from the question: Combines the numbers in the question without a model of the situation, or is simply a number that appears in the question.
The wrong answers, classified
B Misunderstands the concept (Smith, diSessa & Roschelle, 1993; De Bock et al., 1998; Ni & Zhou, 2005)
Finds the 6 red candies but compares the 4 yellow with the 18 green and red ones, 4/18, a part-to-part ratio instead of part to whole.
C Numbers taken from the question (Hegarty, Mayer & Monk, 1995)
Leaves out the red candies, whose number is not given, and divides the 4 yellow by the 16 green and yellow candies.
D Answers a different question (King et al., 2004; Hegarty, Mayer & Monk, 1995)
Finds the 6 red candies and the total of 22 correctly but gives the chance of red, 6/22 = 3/11, instead of yellow.
Worked solution, step by step
Formulas used
- Probability
- P is the probability, the chance that something happens. The top is how many candies are the kind you want. The bottom is how many candies there are in all. Each candy is just as likely to be picked, so this fraction gives the chance.
Sort out what you know
The bowl has 12 green candies, 4 yellow candies and some red candies. You are not told how many are red. Let r be the number of red candies.
The chance of picking green is twice the chance of picking red. You need the probability (the chance) of picking yellow.
Compare green and red
Write each chance with the probability formula.
Green and red have the same bottom number, the total number of candies. So if the chance of green is twice the chance of red, there are twice as many green candies as red ones.
Find the red candies and the total
There are 6 red candies. Now add up all the candies.
There are 22 candies in all. Watch out: do not leave out the red candies just because their number was not given. Using 16 as the total gives 1/4, choice C.
Find the chance of yellow
There are 4 yellow candies out of 22.
Divide the top and the bottom by 2 to simplify. Watch out: the question asks for yellow, not red. 6/22 = 3/11 is the chance of red, choice D. The bottom must be all 22 candies. Using 18 gives 2/9, choice B.
So the answer is A, .
Check your answer
Check the clue. The chance of green is , and the chance of red is . Twelve is twice 6, so green is twice as likely. Also, the three chances add up to 1: .
More questions like this
The original DOE question
Question 23 of 61
2024 Test B Math, question 20Question
Centerville will hold a vote on whether to build a new park. The town council surveyed a random sample of 200 residents to determine whether they would be in favor of building this park. The table shows the results of the survey.
SURVEY RESULTS
| Opinion | Number of Residents |
|---|---|
| Yes | 142 |
| No | 38 |
| Undecided | 20 |
The mayor estimates that half the undecided voters will vote in favor of building the park. Based on the survey results, if the mayor is correct, how many of the 24,100 voters will be in favor of building the park?
- A17,111
- B18,316
- C19,401
- D19,521
Show the answer
Correct answer: B
If half the undecided voters (half of 20) vote in favor of building the park, the total number of “yes” votes from the survey will be 152.
There are 24,100 voters, and 200 residents were surveyed. Set up a proportion to solve:
Question analysis
A survey question: a random sample of 200 Centerville residents answered yes, no or undecided about building a park, and the mayor expects half the undecided to vote yes. Students use the sample to predict how many of 24,100 voters will favor the park. It joins a proportion from a sample with large-number arithmetic.
- Grade level
- Grade 7 content, by NYS standard
- Compared with grade 7
- At grade 7 Using a random sample to estimate a count in a whole population is a typical grade 7 proportion task. The extra step for the undecided group and the large numbers add care without going beyond grade 7.
- Estimated difficulty
- Hard: combines ideas, needs a plan, and has more than one tempting wrong answer.
- Thinking it demands
- Depth of knowledge 2, skills and concepts · mainly apply
- What makes it hard
- Error-prone arithmetic moderate
- Turning words into math moderate
- Reading a figure, table or graph minor
- Solution
- 3 steps
- Reading level
- Question and choices: about grade 5, 88 words.
- Students, last 30 days
- Not enough answers yet to show (it takes 10).
Why it is hard, traps and wrong answers (shows the answer)
Why it is hard
The setup is a sample-to-population proportion, and the trap is the mayor's assumption in the middle of the stem. Students who scale the 142 yes answers directly, or who count every undecided resident, reach believable totals that sit right among the choices. Once the count of 152 is settled, a rough estimate, about three quarters of 24,000, is enough to confirm the exact product.
Error-prone arithmetic moderate Working it out
Scaling 152 out of 200 up to 24,100 voters means computing 24,100 × 0.76, or 120.5 × 152, by hand with five-digit numbers. (Brown & Burton, 1978; Junker & Sijtsma, 2001)
Turning words into math moderate Understanding the question
The mayor's sentence adds a step: “half the undecided voters” turns the 20 undecided residents into 10 more yes votes, giving 152 before any scaling. (Hegarty, Mayer & Monk, 1995; Koedinger & Nathan, 2004)
Reading a figure, table or graph minor Understanding the question
The table gives Yes, No and Undecided counts, and the half must be taken of the Undecided row, not of the No row just above it. (Lesh, Post & Behr, 1987; Kirsch & Mosenthal, 1990)
Strategy: Count the sample's expected yes votes, including half of the undecided, write them as a fraction of 200, and multiply that fraction by 24,100; estimate first to check the choice.
Traps
- Misreads the question: Misses or misreads a condition or a word in the question: "at least", "each", "remaining", "not".
- Misreads the figure: Reads a value, label or tick spacing in a figure, table or graph wrongly.
The wrong answers, classified
A Misreads the question (Hegarty, Mayer & Monk, 1995)
Uses only the 142 yes answers, 142/200 of 24,100 = 17,111, leaving out the undecided residents the mayor expects to vote yes.
C Misreads the figure (Lesh, Post & Behr, 1987; Kirsch & Mosenthal, 1990)
Takes half of the 38 No answers instead of the 20 Undecided, reading the wrong row, so 161/200 of 24,100 ≈ 19,401.
D Misreads the question (Hegarty, Mayer & Monk, 1995)
Counts all 20 undecided residents as yes votes instead of half of them, so 162/200 of 24,100 = 19,521.
Worked solution, step by step
Formulas used
- Scaling up a sample
- A random sample is a smaller group picked by chance. Its share of yes votes should be about the same as the whole town’s share. So the two fractions are set equal. Use it to scale a survey up to a whole group.
Sort out what you know
The town surveyed 200 people. 142 said Yes, 38 said No, and 20 were Undecided (not sure yet). The mayor thinks half of the undecided people will vote yes. There are 24,100 voters in all. You need how many of them will vote yes.
Count the yes votes in the survey
Half of the 20 undecided people is . Add them to the yes votes.
So 152 of the 200 people surveyed would vote yes. Watch out: take half of the Undecided row, not the No row. Half of 38 leads to 19,401, choice C.
Find the share who vote yes
That is 76% of the people surveyed. The sample was random, so about 76% of all the voters should vote yes too. Watch out: using only the 142 yes votes gives 17,111, choice A. Counting all 20 undecided people gives 19,521, choice D.
Scale up to all the voters
Break it into easy parts. 75% is , and 1% is .
So the answer is B, 18,316.
Check your answer
Estimate. 76% is a little more than three fourths. Three fourths of 24,000 is 18,000. So the answer should be a little more than 18,000, and 18,316 fits. Also, , the same share as the survey.
More questions like this
The original DOE question
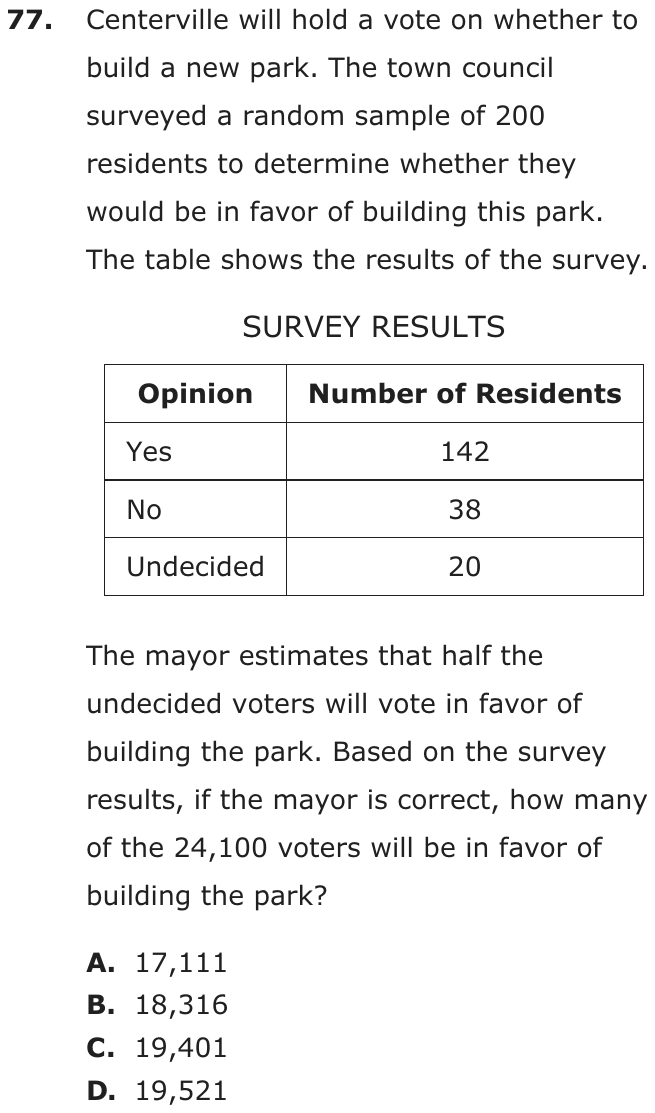
Question 24 of 61
2024 Test B Math, question 29Question
Jar Q contains 12 balls, and Jar R contains 8 balls. The probability of drawing a yellow ball at random from Jar Q is . The probability of drawing a yellow ball at random from Jar R is . All the balls are poured into an empty jar, Jar S. What is the probability of drawing a yellow ball at random from Jar S?
- A
- B
- C
- D
Show the answer
Correct answer: C
Jar Q contains 12 balls, and the probability of drawing a yellow ball at random is .
There are 4 yellow balls in Jar Q.
Jar R contains 8 balls, and the probability of drawing a yellow ball at random is .
There are 6 yellow balls in Jar R.
Jar S contains all the balls from Jar Q and Jar R.
There are 20 balls in Jar S.
There are 10 yellow balls in Jar S.
The probability of drawing a yellow ball at random from Jar S is .
Question analysis
Two jars hold different numbers of balls and give different chances of drawing a yellow ball, and then everything is poured into a third jar. Students find the probability of drawing yellow from the combined jar. The tricky part is that the jars are different sizes, so their probabilities cannot be merged without first counting the yellow balls.
- Grade level
- Grade 6 content, by NYS standard
- Compared with grade 7
- At grade 7 Grade 7 probability tasks usually give the counts and ask for a fraction. Here each jar's probability must be turned back into a count of yellow balls before the jars are pooled, a reverse step that typical classwork rarely asks for.
- Estimated difficulty
- Moderate: several steps, or a close reading with one strong distractor.
- Thinking it demands
- Depth of knowledge 2, skills and concepts · mainly apply
- What makes it hard
- Turning words into math moderate
- A very close wrong answer minor
- Solution
- 4 steps
- Reading level
- Question and choices: about grade 6, 66 words.
- Students, last 30 days
- Not enough answers yet to show (it takes 10).
Why it is hard, traps and wrong answers (shows the answer)
Why it is hard
The arithmetic is light; the hurdle is seeing that chances from jars of different sizes cannot be combined as fractions. Every wrong choice works on 1/3 and 3/4 directly, by multiplying them, by keeping one, or by adding tops and bottoms, while the right path runs through counts of balls. Asking how many yellow balls each jar holds before anything is poured avoids all three.
Turning words into math moderate Understanding the question
Each jar's probability, 1/3 of 12 balls and 3/4 of 8 balls, has to be turned back into a count of yellow balls, 4 and 6, before the two jars can be combined. (Hegarty, Mayer & Monk, 1995; Koedinger & Nathan, 2004)
A very close wrong answer minor Choosing the answer
The straight-across 4/7, about 0.57, sits just above the right 1/2, and both lie between the jars' chances of 1/3 and 3/4, so a rough estimate does not rule it out. (Embretson & Wetzel, 1987; Gorin & Embretson, 2006; Ascalon et al., 2007)
Strategy: Turn each jar's probability into a number of yellow balls by multiplying it by that jar's total, then divide all the yellow balls by all the balls.
Traps
- Misunderstands the concept: A wrong belief about a concept: that percents can be added, that area grows like length, that averages can be averaged, that a bigger denominator means a bigger fraction.
- A faulty procedure: A systematic but wrong procedure: adding fractions straight across, applying an exponent to each term of a sum, dropping a sign when moving a term.
The wrong answers, classified
A Misunderstands the concept (Smith, diSessa & Roschelle, 1993; De Bock et al., 1998; Ni & Zhou, 2005)
Multiplies the jars' chances, 1/3 × 3/4 = 1/4, the rule for two draws that must both be yellow, though only one ball is drawn from the mixture.
B Numbers taken from the question (Hegarty, Mayer & Monk, 1995)
Repeats Jar Q's 1/3 from the stem, as if the bigger jar's chance carried over to the mixture unchanged.
D A faulty procedure (Brown & Burton, 1978; Tatsuoka, 1983)
Adds the fractions straight across, (1 + 3)/(3 + 4) = 4/7, treating 1/3 and 3/4 as if they were counts of balls rather than chances.
Worked solution, step by step
Formulas used
- Probability
- P(yellow) is the probability, or chance, of drawing a yellow ball. It is a number from 0 to 1. The top counts the yellow balls. The bottom counts all the balls. It works because every ball is equally likely to be drawn.
Sort out what you know
Jar Q holds 12 balls. The probability, or chance, of drawing yellow from it is .
Jar R holds 8 balls. The chance of drawing yellow from it is .
All the balls are poured into Jar S. You need the chance of drawing yellow from Jar S.
Count the yellow balls in Jar Q
The jars are different sizes, so you can’t mix their chances directly. Count the yellow balls instead. The chance tells what fraction of the balls are yellow. So multiply it by the number of balls.
Jar Q has 4 yellow balls.
Count the yellow balls in Jar R
Do the same for Jar R. Three fourths of its 8 balls are yellow.
Jar R has 6 yellow balls.
Count the balls in Jar S
Jar S gets every ball from both jars. Add all the balls. Then add the yellow balls.
Jar S has 20 balls, and 10 of them are yellow.
Find the chance for Jar S
Use the probability formula with the Jar S counts.
Watch out: Adding the tops and the bottoms, 1 + 3 over 3 + 4, gives , choice D. Those numbers are parts of fractions, not balls. Multiplying gives , choice A. That is the chance of two yellow draws, one from each jar.
So the answer is C, .
Check your answer
Half of the 20 balls is 10, and 4 + 6 = 10 yellow balls. That matches. Also, the mixed jar’s chance should land between the two jars’ chances, and . One half does.
More questions like this
The original DOE question
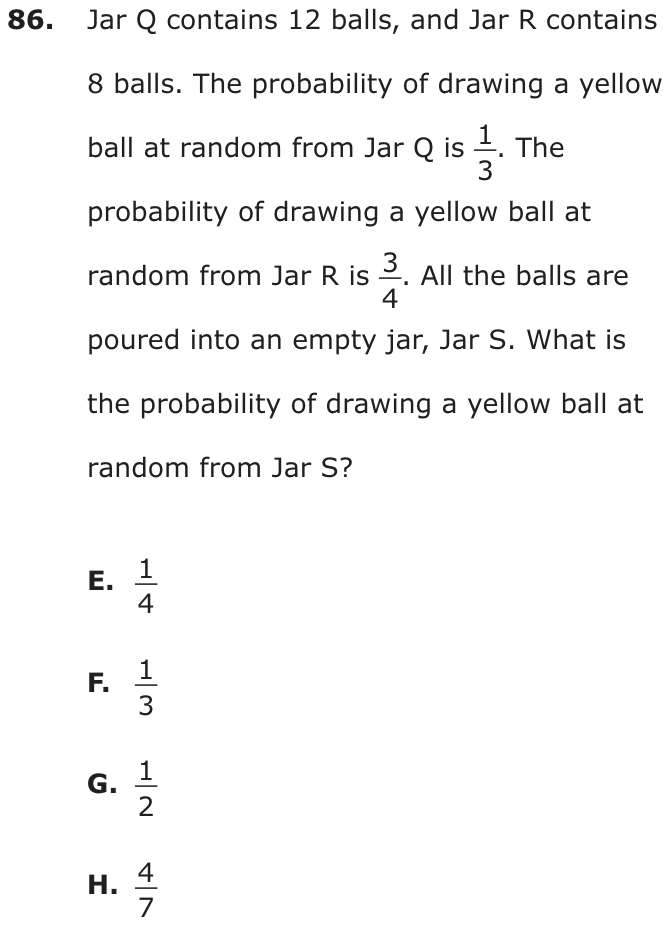
Question 25 of 61
2024 Test B Math, question 45Question
A box contains a total of 30 paper clips with colors in the ratio . Suppose that one paper clip of each color is removed from the box and not replaced. What is the probability that the next paper clip chosen will be blue?
- A
- B
- C
- D
Show the answer
Correct answer: C
The ratio is . Find the number of each color in a box of 30 paper clips.
If one paper clip of each color is removed (3 total), there will be 8 blue paper clips out of 27 in the box. The probability that the next paper clip chosen will be blue is .
Question analysis
A box of 30 paper clips has red, white and blue clips in the ratio 2 to 5 to 3, and one clip of each color is taken out. Students find the probability that the next clip drawn is blue. It tests ratios and simple probability; the ratio gives shares rather than counts, and the removals change both the blue count and the total.
- Grade level
- Grade 6 content, by NYS standard
- Compared with grade 7
- At grade 7 Splitting a total by a three-part ratio and finding a simple probability are both familiar skills. Combining them, then adjusting the counts after the removals, adds steps but stays within typical grade 7 multi-step work.
- Estimated difficulty
- Moderate: several steps, or a close reading with one strong distractor.
- Thinking it demands
- Depth of knowledge 2, skills and concepts · mainly apply
- What makes it hard
- Many steps moderate
- A very close wrong answer moderate
- Turning words into math minor
- Solution
- 4 steps
- Reading level
- Question and choices: about grade 5, 47 words.
- Students, last 30 days
- Not enough answers yet to show (it takes 10).
Why it is hard, traps and wrong answers (shows the answer)
Why it is hard
The question chains a ratio problem into a probability problem, with a small change in between. Students who skip the removal get 3/10, a choice that is almost the right value and looks natural because it matches the ratio. The cleanest route lists the actual counts, 6, 15 and 9, takes one from each, and writes blue's 8 over the remaining 27.
Many steps moderate Working it out
The ratio 2:5:3 must become counts of 6, 15 and 9 clips, one clip of each color must come out, and only then can blue's 8 be put over 27. (Daniel & Embretson, 2010; Enright, Morley & Sheehan, 2002)
A very close wrong answer moderate Choosing the answer
3/10 = 0.3 and 8/27, about 0.296, are almost equal, so an estimate cannot separate them; only subtracting the three removed clips does. (Embretson & Wetzel, 1987; Gorin & Embretson, 2006; Ascalon et al., 2007)
Turning words into math minor Understanding the question
The removal of one clip of each color, not replaced, happens before the draw, so it changes both the blue count and the total in the box. (Hegarty, Mayer & Monk, 1995; Koedinger & Nathan, 2004)
Strategy: Divide 30 by the sum of the ratio parts to find each color's count, take one clip away from each color, then put the blue count over the new total.
Traps
- Without replacement: In a second pick there is one fewer item, which changes the probability.
- Misunderstands the concept: A wrong belief about a concept: that percents can be added, that area grows like length, that averages can be averaged, that a bigger denominator means a bigger fraction.
- Answers a different question: A choice is right for another quantity: the other unknown, the rest instead of the part, the part instead of the whole.
The wrong answers, classified
A Answers a different question (King et al., 2004; Hegarty, Mayer & Monk, 1995)
Works out the counts correctly but puts red's remaining 5 clips over the 27 left, answering for the wrong color.
B Misunderstands the concept (Smith, diSessa & Roschelle, 1993; De Bock et al., 1998; Ni & Zhou, 2005)
Treats the ratio terms as actual counts and removes one from each, so blue is 3 − 1 = 2 of 10 − 3 = 7 clips.
D Without replacement (Fischbein & Schnarch, 1997)
Gives blue's share of the full box, 9 of 30 or 3 of 10 ratio parts, ignoring the three clips removed before the draw.
Worked solution, step by step
Formulas used
- Size of one ratio part
- The ratio numbers tell how many parts each color gets. Their sum is the number of parts in all. total is the number of clips. Dividing gives the size of one part. Each color is then its ratio number times one part.
- Probability
- P(blue) is the chance of picking a blue clip. The top counts the blue clips in the box. The bottom counts all the clips in the box. It works because each clip is equally likely to be picked.
Sort out the question
The box has 30 clips. The ratio red : white : blue = 2 : 5 : 3 means that for every 2 red clips, there are 5 white clips and 3 blue clips.
Then one clip of each color is taken out and not put back. You need the chance that the next clip picked is blue.
Find the size of one part
The ratio has parts in all. The 30 clips are shared among those 10 parts.
Each part is 3 clips.
Count the clips of each color
Multiply each ratio number by the size of one part.
Check: 6 + 15 + 9 = 30 clips. That matches the total.
Take out one of each color
One red, one white and one blue clip come out. Each color drops by 1, and the total drops by 3.
Color Before After Red 6 5 White 15 14 Blue 9 8 All 30 27 Find the chance of blue
Watch out: , choice D, ignores the 3 clips taken out. , choice A, is the chance of red. Taking 1 from each ratio number, as if the box held only 10 clips, gives , choice B.
So the answer is C, .
Check your answer
Add the clips left: 5 + 14 + 8 = 27. That matches. Also, is about 0.296, a bit less than blue’s share of the full box, 0.3. That makes sense, since one blue clip came out.
More questions like this
The original DOE question
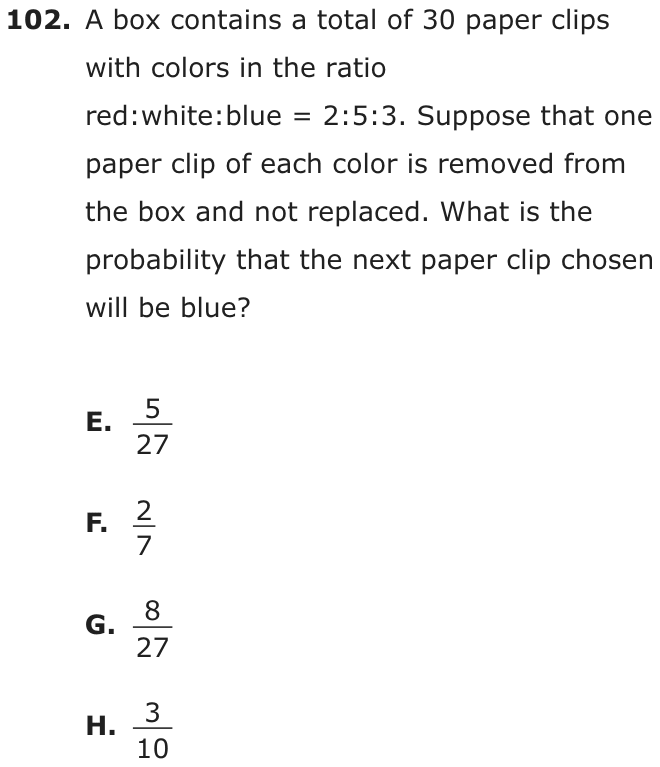
Question 26 of 61
2023 Test A Math, question 5Question
The mean value of 8 numbers is 17. Three of these numbers (9, 11, and 20) are discarded. What is the mean of the 5 remaining numbers?
Grid-in question: work out the answer and enter it as a number.
Show the answer
Correct answer: 19.2
First, find the sum of the original 8 numbers. Let x equal the sum of those numbers and use the mean formula to solve for x:
Next, subtract the 3 discarded numbers from the sum:
Finally, calculate the mean of the remaining 5 numbers by dividing the new sum, 96, by 5:
Question analysis
Eight numbers have a mean of 17, and three of them, 9, 11 and 20, are removed. This statistics grid-in asks for the mean of the five numbers that are left. Students have to rebuild the total from the mean before removing anything, and then divide by the new count rather than the old one.
- Grade level
- Grade 6 content, by NYS standard
- Compared with grade 7
- At grade 7 Finding a mean is grade 6 content, but working back from a mean to a total, removing values and averaging again is a typical grade 7 multistep task. As a grid-in, it offers no choices to check a wrong total against.
- Estimated difficulty
- Moderate: several steps, or a close reading with one strong distractor.
- Thinking it demands
- Depth of knowledge 2, skills and concepts · mainly apply
- What makes it hard
- Many steps moderate
- Much to keep track of minor
- An answer in an unexpected form minor
- Solution
- 3 steps
- Reading level
- Question and choices: about grade 3, 21 words.
- Students, last 30 days
- Not enough answers yet to show (it takes 10).
Why it is hard, traps and wrong answers (shows the answer)
Why it is hard
A mean cannot be adjusted directly when numbers are removed, so the question rewards switching from the mean to the total and back. The removed numbers, 9, 11 and 20, average less than 17, so the new mean must rise above 17; that quick check rules out an answer such as 12. Points are lost by dividing by the wrong count or by stopping at the new total.
Many steps moderate Working it out
Three operations come in a fixed order: multiply the mean by 8 to get 136, subtract 9, 11 and 20 to leave 96, then divide by the numbers that remain. (Daniel & Embretson, 2010; Enright, Morley & Sheehan, 2002)
Much to keep track of minor Working it out
The count changes partway through, from 8 numbers to 5, and the divisor at the end must be the new count, not the 8 from the first sentence. (Sweller, 1988; Carpenter, Just & Shell, 1990)
An answer in an unexpected form minor Choosing the answer
The answer, 19.2, is a decimal that must be gridded with its point, and with no choices a total of 96 or a mean over 8 numbers looks complete. (Enright, Morley & Sheehan, 2002)
Strategy: Turn the mean into a total by multiplying by 8, subtract the three discarded numbers, and divide what is left by the count of numbers that remain.
Traps
- Misreads the question: Misses or misreads a condition or a word in the question: "at least", "each", "remaining", "not".
- Stops one step early: A choice is a number from partway through the solution.
The wrong answers, classified
12 Misreads the question (Hegarty, Mayer & Monk, 1995)
Finds the remaining total, 136 − 40 = 96, correctly but divides it by the original 8 numbers instead of the 5 that are left.
96 Stops one step early (King et al., 2004; Gierl et al., 2017)
Subtracts the three discarded numbers from the total of 136 and grids the new sum, 96, without dividing by the 5 numbers left.
27.2 Misreads the question (Hegarty, Mayer & Monk, 1995)
Turns the mean into the total, 136, and divides it by 5 without first subtracting the three discarded numbers, 9, 11 and 20.
Worked solution, step by step
Formulas used
- Mean, or average
- The mean is the average. The sum is what you get when you add all the numbers. Divide it by how many numbers there are. The mean is the value each number would have if the total were shared out equally.
- Sum from a mean
- This is the mean formula turned around. If you know the mean and how many numbers there are, multiply them to get the sum. It works even when you don’t know the numbers themselves.
Sort out the question
There are 8 numbers. Their mean, or average, is 17. You don’t know what the 8 numbers are. Three of them, 9, 11 and 20, are discarded, or thrown away. That leaves 5 numbers. You need the mean of those 5 numbers.
Find the sum of all 8 numbers
You can’t add the 8 numbers, because you don’t know them. But the mean tells you their sum.
The 8 numbers add up to 136.
Take away the three discarded numbers
Subtract the three numbers that were thrown away.
The 5 numbers left add up to 96. Watch out: 96 is a sum, not a mean, so gridding 96 is wrong. Also, dividing 136 by 5 without subtracting first gives 27.2, which is wrong.
Divide by the 5 numbers left
Now use the mean formula for the numbers that are left.
Watch out: divide by 5, not by 8. Only 5 numbers are left. Dividing by 8 gives 12. So you would grid 19.2, with the decimal point in its own column.
Check your answer
The three numbers thrown away add to 40, so their mean is about 13. That is less than 17. Removing small numbers should make the mean go up, and 19.2 is more than 17. Also, , the sum of the 5 numbers left.
More questions like this
The original DOE question
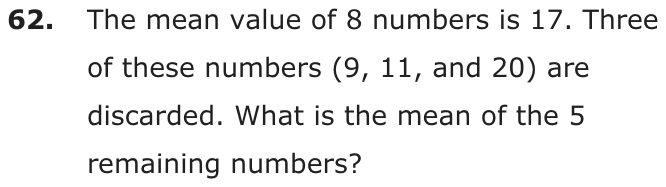
Question 27 of 61
2023 Test A Math, question 15Question
A swim instructor used the box plot below to display the distribution of the ages of students who signed up for swim lessons.
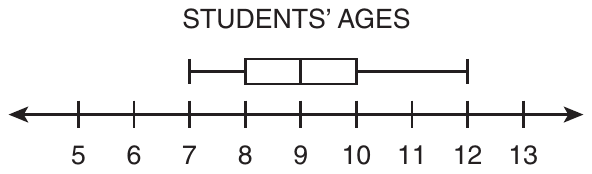
Which statement about the distribution of ages is true?
- AThe data contain an outlier.
- BApproximately half the students are exactly 9 years old.
- CApproximately one-fourth of the students are at least 10 years old.
- DThe interquartile range is 3 greater than the range of the data.
Show the answer
Correct answer: C
The data points in the box plot are as follows:
- minimum: 7
- first quartile: 8
- median: 9
- third quartile: 10
- maximum: 12
Since the value of the third quartile is 10, approximately one-fourth of the students are 10–12 years old.
Question analysis
A swim instructor's box plot shows the ages of students who signed up for lessons. Students decide which of four statements about the distribution is true, using the minimum, quartiles, median and maximum. The statements test different box plot ideas, including outliers, the median, the quartiles and the range, so each needs its own check.
- Grade level
- Grade 7 content, by NYS standard
- Compared with grade 7
- At grade 7 New York places box plots, the interquartile range and outliers in grade 7. Here four statements test those ideas one at a time; each check is short, so the item matches typical grade 7 work.
- Estimated difficulty
- Moderate: several steps, or a close reading with one strong distractor.
- Thinking it demands
- Depth of knowledge 2, skills and concepts · mainly understand
- What makes it hard
- Something you must already know moderate
- Every choice must be checked moderate
- Reading a figure, table or graph minor
- Solution
- 3 steps
- Reading level
- Question and choices: about grade 8, 66 words.
- Students, last 30 days
- Not enough answers yet to show (it takes 10).
Why it is hard, traps and wrong answers (shows the answer)
Why it is hard
Reading the five values off the plot is quick; the work is knowing what a box plot can and cannot say. It shows where quarters of the data begin and end, not how many students share any one age, and a long whisker is not an outlier unless it passes the 1.5 × IQR cutoff, here 13. The true statement uses the third quartile: about a quarter of the students are 10 or older.
Something you must already know moderate Working it out
The statements rely on box plot facts the question does not give: each section holds about a quarter of the data, the middle line is the median, and outliers lie beyond 1.5 IQRs. (Anderson & Krathwohl, 2001)
Every choice must be checked moderate Choosing the answer
Four statements test four separate ideas, an outlier, the share at one age, a quarter of the data and two spreads, so ruling one out says nothing about the rest. (Embretson & Wetzel, 1987)
Reading a figure, table or graph minor Understanding the question
The five values, 7, 8, 9, 10 and 12, are read off a 5-to-13 scale, where the longer right whisker draws the eye more than the box does. (Lesh, Post & Behr, 1987; Kirsch & Mosenthal, 1990)
Strategy: Read the five key values off the plot, then test each statement: compute the range, the interquartile range and the outlier cutoffs, and recall what share of the data each part holds.
Traps
- Misunderstands the concept: A wrong belief about a concept: that percents can be added, that area grows like length, that averages can be averaged, that a bigger denominator means a bigger fraction.
- Wrong formula: Uses a related but wrong formula: perimeter for area, diameter for radius, area for volume, or a misremembered one.
The wrong answers, classified
A Misunderstands the concept (Smith, diSessa & Roschelle, 1993; De Bock et al., 1998; Ni & Zhou, 2005)
Takes the long right whisker, reaching 12, as a sign of an outlier, but 12 is below the cutoff 10 + 1.5 × 2 = 13.
B Misunderstands the concept (Smith, diSessa & Roschelle, 1993; De Bock et al., 1998; Ni & Zhou, 2005)
Reads the median line at 9 as the age of half the students, though a median only splits the ages into a lower and an upper half.
D Wrong formula (King et al., 2004)
Swaps the two measures, taking the box's 2 years as the range and the whiskers' 5 years as the interquartile range, so the IQR seems 3 greater.
Worked solution, step by step
Formulas used
- Range
- The maximum is the largest value, the right end of a box plot. The minimum is the smallest, the left end. The range is how far apart they are. It shows how spread out all the data are.
- Interquartile range
- IQR is short for interquartile range. Q1, the first quartile, is the left edge of the box. Q3, the third quartile, is the right edge. The IQR is the width of the box. It is the spread of the middle half of the data. The four parts of a box plot each hold about one-fourth of the data.
- Outlier test
- An outlier is a value far from the rest of the data. A common rule says a value is an outlier if it lies more than 1.5 IQRs below Q1 or above Q3.
Read the five values off the plot
A box plot shows five numbers. The median is the middle value when the ages are in order.
Part Age Minimum, the left whisker’s end 7 First quartile, Q1, the box’s left edge 8 Median, the line in the box 9 Third quartile, Q3, the box’s right edge 10 Maximum, the right whisker’s end 12 Check choice A, an outlier
An outlier would be above 13 or below 5. The ages only run from 7 to 12. So there is no outlier. Watch out: a long whisker is not an outlier. It just means the top ages are spread out. Choice A is false.
Check choice B, the median
The median, 9, is the middle age. About half the students are 9 or younger. About half are 9 or older. It does not tell how many are exactly 9. Watch out: the median line does not mean half the students are 9. Choice B is false.
Check choice C, the top fourth
The box plot splits the students into four groups of about the same size. Each group holds about one-fourth of them. The last group runs from Q3, 10, to the maximum, 12. At least 10 means 10 or more. So about one-fourth of the students are at least 10 years old. Choice C is true.
Check choice D, the two spreads
The IQR is 3 less than the range, not 3 greater. The box always fits inside the whiskers, so the IQR can never be bigger. Watch out: swapping the two measures gives choice D. So the answer is C: about one-fourth of the students are at least 10 years old.
Check your answer
Picture 20 students. About 5 would be in each fourth of the plot. The top 5 would be ages 10 to 12. That is about one-fourth, just as choice C says. Each other choice fails a fact you can read straight off the plot.
More questions like this
The original DOE question
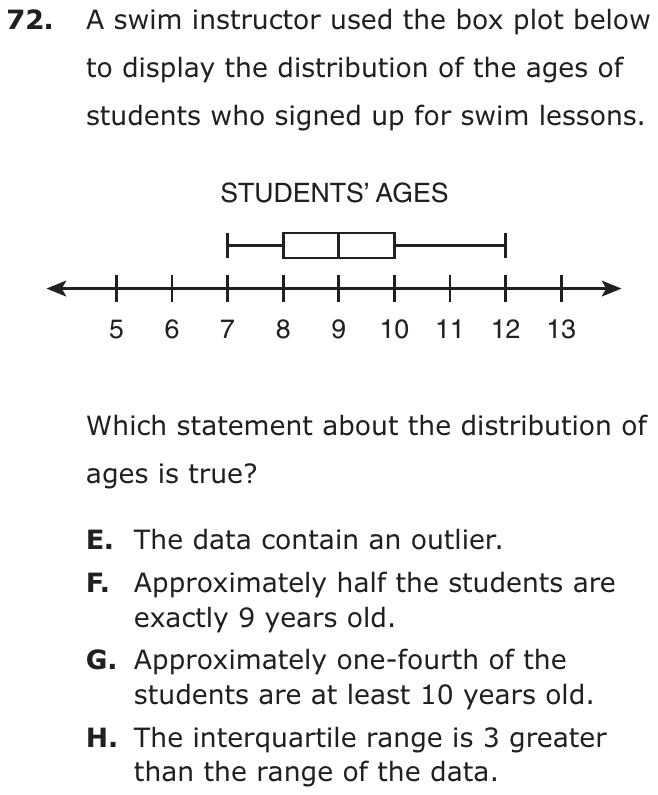
Question 28 of 61
2023 Test A Math, question 23Question
If a person chooses a number at random from the set above, what is the probability that the number is less than 0.005?
- A
- B
- C
- D
Show the answer
Correct answer: C
Three of the five numbers listed (0.001, 0.0001, and 0.00001) are less than 0.005. So, the probability of a person selecting a number less than 0.005 is .
Question analysis
A set holds five decimals, from one tenth down to one hundred-thousandth, and one number is chosen at random. Students find the probability that the number is less than 0.005. Comparing decimals with many zeros is the real task here, along with putting the count over the right total.
- Grade level
- Grade 6 content, by NYS standard
- Compared with grade 7
- Below grade 7 Probability with equally likely outcomes is grade 6 content in New York, and this needs one comparison per number and one fraction. The only real demand is comparing decimals with many zeros correctly.
- Estimated difficulty
- Straightforward: two steps or one careful reading.
- Thinking it demands
- Depth of knowledge 2, skills and concepts · mainly apply
- What makes it hard
- Error-prone arithmetic moderate
- Something you must already know minor
- Solution
- 2 steps
- Reading level
- Question and choices: about grade 6, 27 words.
- Students, last 30 days
- Not enough answers yet to show (it takes 10).
Why it is hard, traps and wrong answers (shows the answer)
Why it is hard
Each number in the set is a tenth of the one before, so only the three smallest fall below 0.005, which lies between 0.01 and 0.001. Students lose the point either by counting the numbers above 0.005 instead of below it or by writing the count over the wrong total. Lining the decimals up with the same number of places makes every comparison easy.
Error-prone arithmetic moderate Working it out
0.005 has to be compared with decimals from 0.1 down to 0.00001; written to five places, 0.00500 against 0.01000 and 0.00100, the order becomes a comparison of whole numbers. (Brown & Burton, 1978; Junker & Sijtsma, 2001)
Something you must already know minor Working it out
The probability is the count of numbers below 0.005 over all 5 numbers in the set; the stem leaves that part-to-whole rule to the student. (Anderson & Krathwohl, 2001)
Strategy: Write each number with five decimal places, compare it with 0.00500, count those that are smaller, and divide by the five numbers in the set.
Traps
- Answers a different question: A choice is right for another quantity: the other unknown, the rest instead of the part, the part instead of the whole.
- Misunderstands the concept: A wrong belief about a concept: that percents can be added, that area grows like length, that averages can be averaged, that a bigger denominator means a bigger fraction.
The wrong answers, classified
A Answers a different question (King et al., 2004; Hegarty, Mayer & Monk, 1995)
Gives 1/5, the chance of picking any one particular number from the set, without counting how many of the five are below 0.005.
B Answers a different question (King et al., 2004; Hegarty, Mayer & Monk, 1995)
Counts the 2 numbers greater than 0.005, 0.1 and 0.01, instead of those less than it, finding the chance of the opposite event.
D Misunderstands the concept (Smith, diSessa & Roschelle, 1993; De Bock et al., 1998; Ni & Zhou, 2005)
Writes a part-to-part ratio, the 2 numbers above 0.005 over the 3 below it, instead of dividing by all 5 numbers in the set.
Worked solution, step by step
Formulas used
- Probability
- P is the probability, the chance that something happens. Possible results are all the results that are equally likely. Wanted results are the ones you are looking for. The chance is the fraction of all the results that you want.
- Adding zeros to a decimal
- Zeros added to the right end of a decimal don’t change its value. One tenth is the same as ten hundredths. Giving every number the same number of decimal places lets you compare them like whole numbers.
Sort out the question
The set has five numbers. A person picks one at random, so each number has the same chance. You need the probability, or chance, that the number picked is less than 0.005.
Give every number five decimal places
Decimals are easier to compare with the same number of places. Add zeros to the end of each.
Number With five places 0.1 0.10000 0.01 0.01000 0.001 0.00100 0.0001 0.00010 0.00001 0.00001 0.005 0.00500 Count the numbers below 0.005
Compare each number with 0.00500 like whole numbers: 10000, 1000, 100, 10 and 1 against 500. Two numbers are bigger: 0.1 and 0.01. Three are smaller: 0.001, 0.0001 and 0.00001. Watch out: 0.01 has fewer digits than 0.005, but it is bigger. Counting the 2 bigger numbers gives , choice B.
Write the probability
Watch out: divide by all 5 numbers in the set. Comparing the 2 bigger numbers with the 3 smaller ones gives , choice D. So the answer is C, .
Check your answer
The numbers below 0.005 and the numbers above it make up the whole set: 3 + 2 = 5. So the two chances, and , add up to 1, as they should.
More questions like this
The original DOE question
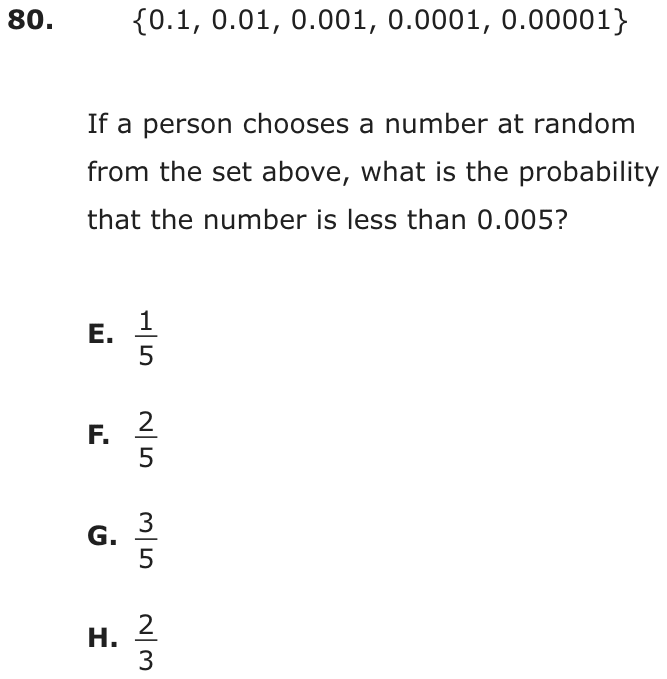
Question 29 of 61
2023 Test A Math, question 27Question
A basket contains red balls, green balls, and white balls. There are 12 red balls in the basket. The probability of randomly choosing a red ball is 1 in 3. If the probability of randomly choosing a green ball is 1 in 4, how many green balls are in the basket?
- A3
- B8
- C9
- D16
Show the answer
Correct answer: C
First, use the information about the red balls to calculate the total number of balls in the basket:
| Cross multiply. | |
There are a total of 36 balls in the basket. The probability of selecting a green ball is 1 in 4. Use that information to calculate how many green balls are in the basket:
| Cross multiply. | |
| Apply the multiplicative inverse property; divide both sides of the equation by 4. | |
There are 9 green balls in the basket.
Question analysis
A basket holds red, green and white balls, including 12 red ones, and the chances of drawing red and green are 1 in 3 and 1 in 4. Students find how many green balls are in the basket. Getting the total from the red count is the step students skip when they apply a probability to the wrong number.
- Grade level
- Grade 6 content, by NYS standard
- Compared with grade 7
- At grade 7 Simple probability is grade 6 content, but here it runs backward: a count and a probability give the total, which then gives another count. Two linked steps like this are typical of grade 7 work.
- Estimated difficulty
- Straightforward: two steps or one careful reading.
- Thinking it demands
- Depth of knowledge 2, skills and concepts · mainly apply
- What makes it hard
- Turning words into math minor
- Many steps minor
- Solution
- 2 steps
- Reading level
- Question and choices: about grade 6, 46 words.
- Students, last 30 days
- Not enough answers yet to show (it takes 10).
Why it is hard, traps and wrong answers (shows the answer)
Why it is hard
The basket's total is never stated, and that missing number is the whole problem: it has to be recovered from the red balls before the green probability means anything. Applying the green chance straight to the 12 red balls is the quick wrong move. Checking that 12 red and 9 green fit in 36 balls with 15 white left over confirms the setup.
Turning words into math minor Understanding the question
The sentence "The probability of randomly choosing a red ball is 1 in 3" has to become 12 = one third of the total, which makes the basket hold 36 balls. (Hegarty, Mayer & Monk, 1995; Koedinger & Nathan, 2004)
Many steps minor Working it out
Two linked steps: the red balls give the total, 12 × 3 = 36, and only then does the green probability give a count, 36 ÷ 4 = 9. (Daniel & Embretson, 2010; Enright, Morley & Sheehan, 2002)
Strategy: Use the red balls to find the total, since 12 is one third of it, then take one fourth of that total for the green balls.
Traps
- Numbers taken from the question: Combines the numbers in the question without a model of the situation, or is simply a number that appears in the question.
- Wrong operation: Adds instead of multiplying, divides the wrong way round, turns a ratio or rate upside down, or undoes a step in the wrong direction (subtracts what should be added back).
The wrong answers, classified
A Numbers taken from the question (Hegarty, Mayer & Monk, 1995)
Takes one fourth of the 12 red balls, 12 ÷ 4 = 3, applying the green probability to the only count the stem gives instead of to the total.
B Little reason to choose it (Haladyna & Downing, 1993; Rodriguez, 2005)
No use of the two probabilities gives 8, which is one third of the 24 balls that are not red, so it mostly catches guesses.
D Wrong operation (Hegarty, Mayer & Monk, 1995; King et al., 2004)
Scales the 12 red balls by 4/3 instead of 3/4, taking the 1-in-4 chance to mean more balls than the 1-in-3 chance: 12 × 4/3 = 16.
Worked solution, step by step
Formulas used
- Probability
- P is the probability, the chance of picking that color. Each ball is equally likely to be picked. So the chance is the fraction of all the balls that have that color. A chance of 1 in 3 means one third of the balls.
Sort out the question
The basket has red, green and white balls. There are 12 red balls. The chance of picking red is 1 in 3. The chance of picking green is 1 in 4. You need the number of green balls. You don’t know the total number of balls yet, so find it first.
Find the total number of balls
1 in 3 means one third of all the balls are red. So 12 is one third of the total. Call the total number of balls b.
There are 36 balls in all.
Find the number of green balls
1 in 4 means one fourth of all 36 balls are green. Call the number of green balls g.
Watch out: take one fourth of all 36 balls, not of the 12 red ones. gives choice A. Multiplying 12 by gives 16, choice D. So the answer is C, 9.
Check your answer
A 1 in 4 chance is smaller than a 1 in 3 chance. So there should be fewer green balls than red ones, and 9 is less than 12. Check: . The rest, , are white.
More questions like this
The original DOE question
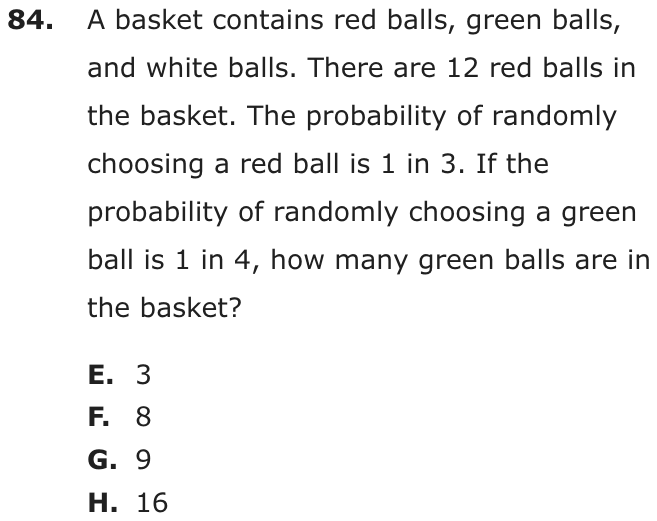
Question 30 of 61
2023 Test A Math, question 30Question
Lamel has a jar containing 6 red chips, 10 blue chips, and 4 yellow chips. If he removes one chip at random, what is the probability that it will not be red?
- A
- B
- C
- D
Show the answer
Correct answer: B
There are currently 20 chips in the jar (). Of those chips, 14 are not red. So the probability of choosing a chip that is not red is .
Question analysis
In this probability word problem, Lamel's jar holds red, blue and yellow chips, and students find the chance that one chip drawn at random is not red. It tests counting the favorable outcomes against the total and writing the probability as a fraction. Missing the bold word not, or counting the wrong colors, leads to tempting wrong fractions.
- NYS standards
- 6.SP.8a uniform probability models
- Grade level
- Grade 6 content, by NYS standard
- Compared with grade 7
- Below grade 7 Probability of a single event with equally likely outcomes is grade 6 content in New York. Students add three counts and form one fraction, and the only extra care is the bold word not, so it sits below grade 7.
- Estimated difficulty
- Straightforward: two steps or one careful reading.
- Thinking it demands
- Depth of knowledge 2, skills and concepts · mainly apply
- What makes it hard
- Solution
- 2 steps
- Reading level
- Question and choices: about grade 5, 33 words.
- Students, last 30 days
- Not enough answers yet to show (it takes 10).
Why it is hard, traps and wrong answers (shows the answer)
Why it is hard
This is a one-event probability with small whole numbers, so the bold not carries the question. A student who skims past it computes the chance of red, a tidy fraction that is waiting among the choices. The other wrong fractions come from removing the wrong color or keeping only one of the two colors that are not red. Adding blue and yellow first, then dividing by all 20 chips, avoids each of them.
Turning words into math minor Understanding the question
The bold not turns the question around: the chips that count are the 10 blue and 4 yellow ones, 14 in all, or equivalently 1 minus the red share of 6/20. (Hegarty, Mayer & Monk, 1995; Koedinger & Nathan, 2004)
An answer in an unexpected form minor Choosing the answer
The count of 14 out of 20 matches no choice until it is reduced to 7/10, so a correct fraction left unsimplified can look missing from the list. (Enright, Morley & Sheehan, 2002)
Strategy: Add all the chips for the total, then count the chips that are blue or yellow, or subtract the chance of red from 1, and simplify the fraction.
Traps
- Misreads the question: Misses or misreads a condition or a word in the question: "at least", "each", "remaining", "not".
- Answers a different question: A choice is right for another quantity: the other unknown, the rest instead of the part, the part instead of the whole.
The wrong answers, classified
A Answers a different question (King et al., 2004; Hegarty, Mayer & Monk, 1995)
Leaves out the 4 yellow chips instead of the 6 red ones, finding the chance of not yellow, 16/20 = 4/5.
C Misreads the question (Hegarty, Mayer & Monk, 1995)
Overlooks the bold not and gives the chance that the chip is red, 6 out of 20, which reduces to 3/10.
D Answers a different question (King et al., 2004; Hegarty, Mayer & Monk, 1995)
Counts only the 4 yellow chips as not red and forgets the 10 blue ones, so it finds 4/20 = 1/5, the chance of yellow alone.
Worked solution, step by step
Formulas used
- Probability
- P is the probability, the chance that something happens. The top counts the outcomes you want. The bottom counts every outcome that could happen. It works when each outcome is equally likely, like pulling one chip without looking.
Sort out the question
Lamel’s jar holds 6 red chips, 10 blue chips and 4 yellow chips. He takes one chip without looking. You need the probability that it is not red. That means the chip is blue or yellow.
Count all the chips
There are 20 chips in all. That is the bottom of the fraction, because any of the 20 could come out.
Count the chips that are not red
The blue and yellow chips are the ones that are not red.
So 14 chips are not red. Watch out: the question asks for not red. Counting the 6 red chips gives , choice C. Counting only the 4 yellow chips gives , choice D.
Find and simplify the probability
Dividing the top and bottom by 2 puts the fraction in lowest terms. So the answer is B, .
Check your answer
A chip is either red or not red, so the two chances must add up to 1. The chance of red is . Then . It works.
More questions like this
The original DOE question
Question 31 of 61
2023 Test A Math, question 46Question
ESSAY LENGTH
| Number of Words | Number of Essays |
|---|---|
| <100 | 6 |
| 100–250 | 4 |
| 251–500 | 11 |
| >500 | 9 |
All 150 students in Grade 8 at a school are assigned to write an essay on the same topic. A teacher records the number of words in a random sample of the essays, as shown in the table above. Based on this sample, how many students in the entire grade would be expected to write essays with at least 100 words?
- A20
- B30
- C100
- D120
Show the answer
Correct answer: D
The number of students in the sample who wrote an essay with at least 100 words is 24 out of the 30 students. Write it as a fraction: . To predict the number of students in the entire grade who would write an essay with at least 100 words, find of 150, which is .
Question analysis
This statistics question gives a table of word counts for a random sample of Grade 8 essays and asks how many of all 150 students would be expected to write at least 100 words. Students find the sample size, the share meeting the condition, and scale it to the whole grade. Matching the words at least to the table's ranges is the tricky part.
- Grade level
- Grade 6 content, by NYS standard
- Compared with grade 7
- At grade 7 Using a random sample to predict a count for a whole population is typical grade 7 statistics and ratio work. Students total the sample from a table, read at least 100 against the table's ranges, and scale by a whole-number factor.
- Estimated difficulty
- Moderate: several steps, or a close reading with one strong distractor.
- Thinking it demands
- Depth of knowledge 2, skills and concepts · mainly apply
- What makes it hard
- Reading a figure, table or graph moderate
- Turning words into math minor
- Many steps minor
- Solution
- 3 steps
- Reading level
- Question and choices: about grade 6, 65 words.
- Students, last 30 days
- Not enough answers yet to show (it takes 10).
Why it is hard, traps and wrong answers (shows the answer)
Why it is hard
The proportion at the end is routine; the question is decided at the table. Students must turn “at least 100 words” into the right rows and also find the sample size, which is printed nowhere. Each listed wrong answer scales up a different group of rows, so a careless reading still produces a believable number. Noting that only 6 of 30 essays fall short, one fifth, gives a quick check.
Reading a figure, table or graph moderate Understanding the question
The table never prints the sample size; it has to be built by adding all four rows, 6 + 4 + 11 + 9 = 30, and the qualifying essays sit in three rows, not one. (Lesh, Post & Behr, 1987; Kirsch & Mosenthal, 1990)
Turning words into math minor Understanding the question
The bold “at least 100 words” must be matched to the rows 100–250, 251–500 and >500, keeping the row that begins at 100 and leaving out only the <100 row. (Hegarty, Mayer & Monk, 1995; Koedinger & Nathan, 2004)
Many steps minor Working it out
Four steps follow in order: the sample total, the qualifying count of 24, the fraction 24/30 = 4/5, and that fraction of all 150 students. (Daniel & Embretson, 2010; Enright, Morley & Sheehan, 2002)
Strategy: Add the table's counts to find the sample size, add the rows with 100 or more words, and scale that fraction of the sample up to all 150 students.
Traps
- Misreads the question: Misses or misreads a condition or a word in the question: "at least", "each", "remaining", "not".
- Answers a different question: A choice is right for another quantity: the other unknown, the rest instead of the part, the part instead of the whole.
The wrong answers, classified
A Misreads the question (Hegarty, Mayer & Monk, 1995)
Counts only the 100–250 row as at least 100 words, then scales its 4 essays up to the grade: 4/30 of 150 = 20.
B Answers a different question (King et al., 2004; Hegarty, Mayer & Monk, 1995)
Scales up the 6 essays with fewer than 100 words, 6/30 of 150 = 30, the very students the question leaves out.
C Misreads the question (Hegarty, Mayer & Monk, 1995)
Leaves out the 100–250 row, as if at least 100 meant more than 250, so it scales 11 + 9 = 20 essays up to 100.
Worked solution, step by step
Formulas used
- Predicting from a sample
- A sample is a smaller group picked at random from the whole group. The fraction of the sample with some feature is your best guess for the fraction of the whole group. So multiply that fraction by the size of the whole group.
Sort out the question
The table shows a random sample of the essays from a grade of 150 students. You need to predict how many of the 150 students wrote at least 100 words. At least 100 means 100 or more.
Find the sample size
The table doesn’t give the total, so add all four rows.
The sample has 30 essays.
Count the essays with enough words
Three rows count: 100–250, 251–500 and >500. Only the <100 row is left out.
Watch out: the 100–250 row counts, because 100 is at least 100. Leaving it out gives 100, choice C. Using the 6 short essays instead gives 30, choice B.
Scale up to the whole grade
About 4 out of every 5 students write at least 100 words. So the answer is D, 120 students.
Check your answer
The whole grade, 150, is 5 times the sample of 30. So multiply the sample count by 5: . The short essays scale to , and 120 + 30 = 150, the whole grade.
More questions like this
The original DOE question
Question 32 of 61
2023 Test B Math, question 1Question
LAST YEAR’S TOTAL SALES
| Vehicles | Number |
|---|---|
| Four-door cars | 5,850 |
| Two-door cars | 2,250 |
| Trucks | 900 |
| Total | 9,000 |
The table above shows the number of each type of vehicle sold at a dealership last year. If 1,000 vehicles will be sold next month, what is the best estimate (based on last year’s sales) of the number of two-door cars that will be sold?
Grid-in question: work out the answer and enter it as a number.
Show the answer
Correct answer: 250
Let x represent the number of two-door cars that will be sold next month. Use the information in the table to set up a proportion:
Question analysis
A table shows last year's sales at a car dealership: four-door cars, two-door cars and trucks, 9,000 vehicles in all. This grid-in asks for the best estimate of how many two-door cars will be sold next month if 1,000 vehicles are sold. Students set up a proportion from the table; most of its rows are not needed.
- Grade level
- Grade 6 content, by NYS standard
- Compared with grade 7
- Below grade 7 Grade 7 proportion problems often take several steps or awkward numbers. This one scales a single share from a table to a new total, with numbers that divide cleanly, which is closer to grade 6 ratio work.
- Estimated difficulty
- Straightforward: two steps or one careful reading.
- Thinking it demands
- Depth of knowledge 2, skills and concepts · mainly apply
- What makes it hard
- Solution
- 2 steps
- Reading level
- Question and choices: about grade 4, 55 words.
- Students, last 30 days
- Not enough answers yet to show (it takes 10).
Why it is hard, traps and wrong answers (shows the answer)
Why it is hard
Once the share is seen as 2,250 out of 9,000, a quarter, the arithmetic is light, which makes this one of the easier grid-ins. Points are lost by entering the share itself as a percent, by reading the wrong row of the table, or by building a monthly average when the question supplies next month’s total. With no choices to compare, checking that the entry is a quarter of 1,000 is the only safeguard.
Turning words into math minor Understanding the question
The phrase “best estimate (based on last year’s sales)” has to become a proportion: two-door cars keep the same share of next month’s 1,000 vehicles as of last year’s 9,000. (Hegarty, Mayer & Monk, 1995; Koedinger & Nathan, 2004)
Reading a figure, table or graph minor Understanding the question
The table lists three vehicle types and a total; only the two-door row, 2,250, and the 9,000 total are needed, so the four-door and truck rows are distractions. (Lesh, Post & Behr, 1987; Kirsch & Mosenthal, 1990)
Strategy: Find what fraction of last year's 9,000 vehicles were two-door cars, simplify it, then take that fraction of the 1,000 vehicles expected next month.
Traps
- Stops one step early: A choice is a number from partway through the solution.
- Information you don't need: The question gives numbers or facts that play no part in the answer.
The wrong answers, classified
25 Stops one step early (King et al., 2004; Gierl et al., 2017)
Finds that 2,250 of 9,000 sales is 25 percent and enters that percent, stopping before taking a quarter of next month’s 1,000 vehicles.
650 Misreads the figure (Lesh, Post & Behr, 1987; Kirsch & Mosenthal, 1990)
Reads the four-door row instead of the two-door row and scales it correctly: 5,850 of 9,000 is 650 of 1,000.
187.5 Misreads the question (Hegarty, Mayer & Monk, 1995)
Divides last year’s 2,250 two-door sales by 12 months, a monthly average that ignores the stated 1,000 vehicles for next month.
Worked solution, step by step
Formulas used
- Proportion
- A proportion says two fractions are equal. Each fraction here is a part over its whole: two-door cars over all vehicles sold. Use it when a share stays the same while the total changes. Then you can find the missing part.
Sort out the question
The table shows last year’s sales. In all, 9,000 vehicles were sold, and 2,250 of them were two-door cars. Next month, 1,000 vehicles will be sold. You need about how many of them will be two-door cars.
“Based on last year’s sales” means two-door cars keep the same share of all sales. A share is a part out of a whole. The four-door and truck rows don’t matter here.
Find last year’s share of two-door cars
Last year, 2,250 out of 9,000 vehicles were two-door cars. Write that as a fraction and simplify it.
This works because . So 1 out of every 4 vehicles sold was a two-door car.
Set up the proportion and solve
Let x be the number of two-door cars next month. Next month’s share must match last year’s share.
To get x alone, multiply both sides by 1,000.
So about 250 two-door cars will be sold.
Give the answer
Watch out: one fourth is the same as 25%. Gridding 25 gives the percent, not the number of cars. Also be sure to use the two-door row. The four-door row would give 650. So you would grid 250.
Check your answer
Try it another way. Next month’s 1,000 vehicles are of last year’s 9,000. So take of the 2,250 two-door cars: . Both ways give 250 cars.
More questions like this
The original DOE question
Question 33 of 61
2023 Test B Math, question 13Question
Shiow-Chen has a box that contains 4 green cards, 7 yellow cards, and 6 red cards. She randomly draws one card at a time from the box and does not return the cards to the box after they have been drawn. The first card she draws is yellow. The second card she draws is green. What is the probability that the third card she draws will also be green?
- A
- B
- C
- D
Show the answer
Correct answer: A
After Shiow-Chen draws a yellow card and a green card, the remaining cards are 3 green, 6 yellow, and 6 red. The probability of drawing a green card from that group is:
Question analysis
Shiow-Chen's box holds 4 green, 7 yellow and 6 red cards, and she draws cards one at a time without putting them back. Her first card is yellow and her second is green. Students find the probability that the third card is also green, which means updating both the green count and the total first.
- NYS standards
- 6.SP.8a uniform probability models
- Grade level
- Grade 6 content, by NYS standard
- Compared with grade 7
- At grade 7 Simple probability is grade 6 content. The extra demand is tracking two earlier draws that were not put back, which changes the counts for the third draw, a step typical grade 7 problems often leave out.
- Estimated difficulty
- Moderate: several steps, or a close reading with one strong distractor.
- Thinking it demands
- Depth of knowledge 2, skills and concepts · mainly apply
- What makes it hard
- Much to keep track of moderate
- Turning words into math minor
- Solution
- 3 steps
- Reading level
- Question and choices: about grade 3, 70 words.
- Students, last 30 days
- Not enough answers yet to show (it takes 10).
Why it is hard, traps and wrong answers (shows the answer)
Why it is hard
The probability itself is one fraction, but it has to be built from a box that two draws have already changed. Students who use the original 17 cards, or who compare green with the other colors instead of with all the cards, reach listed choices that look reasonable. Listing the counts after each draw, then putting the green cards over all the cards left, avoids both.
Much to keep track of moderate Working it out
Three color counts and the total must each be updated after two draws, 4 green, 7 yellow and 6 red becoming 3, 6 and 6 out of 15, before the third draw is considered. (Sweller, 1988; Carpenter, Just & Shell, 1990)
Turning words into math minor Understanding the question
“Does not return the cards” and the two named draws are the conditions that change the box, and the stem states them in passing before asking about the third card. (Hegarty, Mayer & Monk, 1995; Koedinger & Nathan, 2004)
Strategy: Take the two drawn cards out of the box: lower the yellow and green counts by one each, recount the total, then put the green cards left over the cards left.
Traps
- Without replacement: In a second pick there is one fewer item, which changes the probability.
- Misunderstands the concept: A wrong belief about a concept: that percents can be added, that area grows like length, that averages can be averaged, that a bigger denominator means a bigger fraction.
The wrong answers, classified
B Without replacement (Fischbein & Schnarch, 1997)
Uses the full box, 4 green cards out of 17, as if neither of the first two cards had been taken out.
C Misunderstands the concept (Smith, diSessa & Roschelle, 1993; De Bock et al., 1998; Ni & Zhou, 2005)
Updates the counts correctly but compares the 3 green cards with the 12 cards of other colors, 3/12 = 1/4, a part-to-part ratio.
D Misunderstands the concept (Smith, diSessa & Roschelle, 1993; De Bock et al., 1998; Ni & Zhou, 2005)
Treats the three colors as equally likely, giving green a 1-in-3 chance whatever the number of cards of each color.
Worked solution, step by step
Formulas used
- Probability
- P is the probability, how likely something is, from 0 (never) to 1 (always). The top counts the results you want, here green cards. The bottom counts every possible result, here every card in the box. It works when each result is equally likely, as in a random draw.
Sort out the question
The box starts with 4 green, 7 yellow and 6 red cards. Shiow-Chen draws cards one at a time, and she does not put them back. The first card is yellow, and the second is green. You need the probability that the third card is green.
Take out the two cards
The cards are not put back, so the box changes. Lower the yellow count by 1 and the green count by 1.
Color At the start After two draws Green 4 3 Yellow 7 6 Red 6 6 Total 17 15 Use the probability formula
For the third draw, the results you want are the 3 green cards left. The total is the 15 cards left.
Watch out: using the full box gives , choice B. But two cards are gone.
Simplify and answer
Divide the top and bottom by 3.
Watch out: compare the green cards with all 15 cards, not with the 12 cards of other colors. That gives , choice C. And the three colors are not equally likely, so is wrong too. So the answer is A, .
Check your answer
17 cards minus the 2 drawn leaves 15. One fifth of 15 is 3, the number of green cards left. Also, the chance went down from . That makes sense, because a green card was taken out.
More questions like this
The original DOE question
Question 34 of 61
2023 Test B Math, question 22Question
A vendor is selling 10 packages of homemade fudge at a bake sale. The vendor weighed and labeled each package. The package weights are given in ounces:
| 4.6 | 6.0 | 3.8 | 3.5 | 4.5 |
| 5.4 | 3.9 | 6.5 | 4.8 | 6.2 |
The vendor created a box plot of the package weights. Which box plot best represents the data?
- A
- B
- C
- D
Show the answer
Correct answer: C
A set of 10 data points is given. The first step for determining the quartiles and minimum and maximum values of the box plot is to order the data from smallest to greatest value. For this data set the order is:
| 3.5 | 3.8 | 3.9 | 4.5 | 4.6 |
| 4.8 | 5.4 | 6.0 | 6.2 | 6.5 |
The minimum value is the smallest decimal, 3.5, and the maximum value is the greatest decimal, 6.5.
To determine the median in a set with an even number of values, locate the two middle values (5th and 6th in this case): 4.6 and 4.8. Determine the mean, or average, of the two middle numbers by adding them together and dividing the sum by 2:
To determine the value of the first quartile (Q1), locate the middle value of the 5 terms to the left of the median:
| 3.5 | 3.8 | 3.9 | 4.5 | 4.6 |
To determine the value of the third quartile (Q3), locate the middle value of the 5 terms to the right of the median:
| 4.8 | 5.4 | 6.0 | 6.2 | 6.5 |
Box plot C identifies the correct minimum, maximum, median, and quartiles of the data set.
Question analysis
A vendor weighs 10 packages of homemade fudge, from 3.5 to 6.5 ounces, and makes a box plot of the weights. Students choose the box plot that matches the data. They must sort the decimals, find the median of an even number of values and both quartiles, then compare plots that differ only slightly.
- Grade level
- Grade 7 content, by NYS standard
- Compared with grade 7
- Above grade 7 Building a box plot from data is grade 7 content. This version needs all five summary values from ten unsorted decimals, including a median between two values, then a close comparison of plots, longer and finer than typical.
- Estimated difficulty
- Hard: combines ideas, needs a plan, and has more than one tempting wrong answer.
- Thinking it demands
- Depth of knowledge 2, skills and concepts · mainly apply
- What makes it hard
- Many steps moderate
- A very close wrong answer moderate
- Reading a figure, table or graph moderate
- Slow to do carefully minor
- Solution
- 4 steps
- Reading level
- Question and choices: about grade 4, 43 words.
- Students, last 30 days
- Not enough answers yet to show (it takes 10).
Why it is hard, traps and wrong answers (shows the answer)
Why it is hard
Most of the work happens before the plots are even read: the weights must be sorted, and the median of ten values is the average of two of them. After that, three plots look almost identical, so a careless median, taken from the unsorted list or placed halfway between the extremes, settles on a wrong one. The careful student checks the median line and the box’s left edge against values that fall between the tick marks.
Many steps moderate Working it out
Ten unsorted decimals must be ordered, then five values found: the median as the mean of the fifth and sixth, 4.6 and 4.8, and each quartile as the middle of its half. (Daniel & Embretson, 2010; Enright, Morley & Sheehan, 2002)
A very close wrong answer moderate Choosing the answer
Three plots share whiskers at 3.5 and 6.5 and a box ending at 6; they differ only in the median line, at 4.5, near 4.75 or at 5, and in where the box starts. (Embretson & Wetzel, 1987; Gorin & Embretson, 2006; Ascalon et al., 2007)
Reading a figure, table or graph moderate Understanding the question
The axis is ticked every half ounce, and the correct plot’s median, 4.7, and lower quartile, 3.9, both fall between ticks, so each line’s position must be judged by eye. (Lesh, Post & Behr, 1987; Kirsch & Mosenthal, 1990)
Slow to do carefully minor Choosing the answer
Sorting ten decimals, computing a five-number summary and comparing four plots takes well over a minute and a half when done carefully. (Lu & Sireci, 2007)
Strategy: Sort the ten weights, then find the least and greatest, the median as the mean of the fifth and sixth values, and each quartile as the middle of its half.
Traps
- Wrong formula: Uses a related but wrong formula: perimeter for area, diameter for radius, area for volume, or a misremembered one.
- A faulty procedure: A systematic but wrong procedure: adding fractions straight across, applying an exponent to each term of a sum, dropping a sign when moving a term.
The wrong answers, classified
A Little reason to choose it (Haladyna & Downing, 1993; Rodriguez, 2005)
No working from these weights gives whiskers near 4.1 and 6.3 or a median of 5.5, since the data run from 3.5 to 6.5, so it mostly draws guesses.
B A faulty procedure (Brown & Burton, 1978; Tatsuoka, 1983)
Skips sorting and takes 4.5, the fifth weight as printed, for the median, so the plot with its median line on 4.5 seems to fit.
D Wrong formula (King et al., 2004)
Finds the median with the midrange formula, (3.5 + 6.5) ÷ 2 = 5, halfway between the lightest and heaviest packages instead of the middle of the sorted weights.
Worked solution, step by step
Formulas used
- Median of an even number of values
- First put the values in order. With an even number of values, two sit in the middle. The median is their mean, or average: add them and divide by 2. The median splits the data in half.
- Quartiles
- Q1 is the first quartile and Q3 is the third quartile. Split the ordered data in half at the median. Q1 is the middle of the lower half, and Q3 is the middle of the upper half. A box plot’s box runs from Q1 to Q3.
Sort out the question
The vendor weighed 10 packages of fudge, in ounces. You need the box plot that matches the weights. A box plot is built from five numbers. They are the minimum (least), the first quartile Q1, the median, the third quartile Q3 and the maximum (greatest). So find those five numbers first.
Put the weights in order
List the 10 weights from least to greatest.
3.5 3.8 3.9 4.5 4.6 4.8 5.4 6.0 6.2 6.5 Watch out: you must sort first. The fifth weight as printed is 4.5. Using it as the median points to choice B.
Find the least and greatest
The minimum is 3.5 ounces and the maximum is 6.5 ounces. So the whiskers must run from 3.5 to 6.5. Plot A’s whiskers run from about 4.1 to about 6.3, so A is out.
Find the median
With 10 weights, the two middle ones are the 5th and 6th: 4.6 and 4.8.
The median is 4.7 ounces. Watch out: the median is not halfway between the least and greatest. That gives and points to choice D.
Find the two quartiles
The lower half is the 5 weights below the median: 3.5, 3.8, 3.9, 4.5 and 4.6. Its middle value is .
The upper half is the 5 weights above the median: 4.8, 5.4, 6.0, 6.2 and 6.5. Its middle value is .
Match the summary to a plot
The five numbers are 3.5, 3.9, 4.7, 6.0 and 6.5. Plots B, C and D all run from 3.5 to 6.5, and their boxes end at 6. They differ in the median line and where the box starts.
- B: the box starts at 4, and the median line is at 4.5.
- D: the box starts at 4, and the median line is at 5.
- C: the box starts just left of 4, and the median line is between 4.5 and 5.
C is the closest match to a Q1 of 3.9 and a median of 4.7. So the answer is C.
Check your answer
A median splits the data in half. Five weights, 3.5 to 4.6, are below 4.7. Five, 4.8 to 6.5, are above it. A median line at 5, as in D, would have six weights below it. A line at 4.5, as in B, would have only three below it.
More questions like this
The original DOE question
Question 35 of 61
2023 Test B Math, question 27Question
Set L (not shown) is a list of 25 consecutive integers. The median of the integers in set N above is equal to the least integer in set L. What is the median of the integers in set L?
- A25
- B26
- C27
- D28
Show the answer
Correct answer: B
First, find the median of set N. There are 17 integers in set N, so the 9th integer is the median. The 9th integer is 14.
The least integer in set L is equal to the median of set N, so the least integer in set L is 14.
There are 25 integers in set L, so the median is the 13th integer. That integer is 26.
Question analysis
Set N lists the consecutive integers from 6 to 22, and set L is a list of 25 consecutive integers whose least member equals the median of N. Students find the median of set L. It chains two median questions together, and counting positions in a run of consecutive integers invites off-by-one slips.
- NYS standards
- 6.SP.5c range, center, and overall pattern
- Grade level
- Grade 6 content, by NYS standard
- Compared with grade 7
- Above grade 7 Medians of short lists are grade 6 content. This item hides both lists, one behind set notation with an ellipsis and one not shown at all, and links them, so it needs more planning and careful counting than typical grade 7 work.
- Estimated difficulty
- Hard: combines ideas, needs a plan, and has more than one tempting wrong answer.
- Thinking it demands
- Depth of knowledge 2, skills and concepts · mainly apply
- What makes it hard
- A very close wrong answer moderate
- No obvious method moderate
- Reading a figure, table or graph minor
- Solution
- 3 steps
- Reading level
- Question and choices: about grade 5, 39 words.
- Students, last 30 days
- Not enough answers yet to show (it takes 10).
Why it is hard, traps and wrong answers (shows the answer)
Why it is hard
The question chains two medians, and both depend on counting members correctly in runs of consecutive integers. The easy slip is between position and distance: the 13th member of L is 12 steps above its first, not 13. With four consecutive choices, every counting error has a home, so writing out the first and last members of L, 14 and 38, and averaging them is the safest check.
A very close wrong answer moderate Choosing the answer
The choices 25, 26, 27 and 28 are consecutive, so a count that is off by one position lands on a neighboring choice with nothing to flag it. (Embretson & Wetzel, 1987; Gorin & Embretson, 2006; Ascalon et al., 2007)
No obvious method moderate Working it out
Set L is never listed; its median has to be found from its least member, 14, and its size, 25, by working out that the middle is the 13th member. (Schoenfeld, 1985)
Reading a figure, table or graph minor Understanding the question
Set N is written with an ellipsis, {6, 7, …, 21, 22}, so its 17 members must be counted, and 22 − 6 = 16 undercounts by one. (Lesh, Post & Behr, 1987; Kirsch & Mosenthal, 1990)
Strategy: Find N's median by averaging its least and greatest members. L's median is its middle member, so work out that member's position and count up from L's least member.
Traps
- Counting the ends: Inclusive or exclusive ends, fence posts, consecutive numbers: an answer that is one too many or too few, or an endpoint drawn open where it belongs closed (or the reverse).
- Numbers taken from the question: Combines the numbers in the question without a model of the situation, or is simply a number that appears in the question.
The wrong answers, classified
A Numbers taken from the question (Hegarty, Mayer & Monk, 1995)
Gives 25, the number of integers in set L stated in the question, instead of finding which integer sits in the middle.
C Counting the ends (Brown & Burton, 1978)
Counts 13 places up from 14 instead of 12, mixing up the median’s position, 13th, with its distance from the first integer.
D Little reason to choose it (Haladyna & Downing, 1993; Rodriguez, 2005)
No common working gives 28, which is twice N’s median of 14 and matches no count along set L, so it mostly draws guesses.
Worked solution, step by step
Formulas used
- Counting the integers in a list
- This counts the whole numbers in a list that goes up by 1, like 6, 7, 8. Subtracting gives the number of steps from the first number to the last. You add 1 because the first number counts too.
- Position of the median
- The count is how many numbers are in a list that is in order. When the count is odd, the median is at this position. It has the same number of values before it and after it.
Sort out the question
Set N is 6, 7, and so on up to 22. The dots stand for every integer in between. Integers are whole numbers. Set L has 25 consecutive integers, one right after another. Its least number equals the median of N. You need the median of L.
Count the numbers in set N
Set N has 17 integers. Watch out: misses one, because the first number counts too.
Find the median of set N
The median is the 9th number. 6 is the 1st, so the 9th is 8 steps up: 6 + 8 = 14. The median of N is 14.
Find the middle place in set L
So set L starts at 14 and has 25 integers. Find the position of its median.
The median of L is its 13th number.
Count up to the 13th number
14 is the 1st number. The 13th is 12 steps after it.
Watch out: the 13th number is 12 steps up, not 13. Adding 13 gives 27, choice C. And 25 is how many numbers L has, not its median. So the answer is B, 26.
Check your answer
Set L runs from 14 to . For consecutive integers, the median is halfway between the ends: . That matches. The same trick gives N’s median: .
More questions like this
The original DOE question
Question 36 of 61
2023 Test B Math, question 30Question
PRICE OF A USED VIDEO GAME AT VARIOUS STORES
| Price of Used Video Game | Number of Stores |
|---|---|
| $10.99 | 5 |
| $11.99 | 2 |
| $12.99 | 1 |
| $13.99 | 4 |
The table above shows the price of a certain used video game at 12 different stores. What is the median price of this video game?
- A$10.99
- B$11.49
- C$11.99
- D$12.32
Show the answer
Correct answer: C
There are 5 stores where the video game is priced at $10.99 and a total of 5 stores where it is priced at either $12.99 or $13.99, so the median price must be $11.99.
Question analysis
A statistics question with a table showing the price of a used video game at 12 stores, grouped by price, and asking for the median price. Students put the prices in order using the number of stores at each price and find the middle. The table gives counts rather than a list, so the position of the middle value has to be worked out from the running totals.
- Grade level
- Grade 6 content, by NYS standard
- Compared with grade 7
- At grade 7 Finding a median is grade 6 work that grade 7 students meet often. The twist is the frequency table: the 12 prices are not listed one by one, so students count positions instead of reading down a list.
- Estimated difficulty
- Straightforward: two steps or one careful reading.
- Thinking it demands
- Depth of knowledge 2, skills and concepts · mainly apply
- What makes it hard
- Solution
- 2 steps
- Reading level
- Question and choices: about grade 4, 40 words.
- Students, last 30 days
- Not enough answers yet to show (it takes 10).
Why it is hard, traps and wrong answers (shows the answer)
Why it is hard
The arithmetic is trivial once the positions are found: counting down 5 stores at $10.99 and then 2 at $11.99 puts both the 6th and 7th prices at $11.99. The wrong choices reward three different misreadings of a frequency table: the most common price, a middle pair one place too early, and the mean, which takes a long computation to reach. A student who writes the running totals 5, 7, 8 and 12 beside the table avoids all three.
Reading a figure, table or graph moderate Understanding the question
The 12 prices are never listed; the table gives four prices with store counts of 5, 2, 1 and 4, so the 6th and 7th prices must be found by a running count. (Lesh, Post & Behr, 1987; Kirsch & Mosenthal, 1990)
Something you must already know minor Working it out
With 12 values the median is the mean of the 6th and 7th in order, a rule the question assumes; here both fall in the $11.99 row, so no averaging is needed. (Anderson & Krathwohl, 2001)
Strategy: Keep a running total of the store counts down the table; with 12 prices in order, the median is the average of the 6th and 7th, so find the rows where they fall.
Traps
- Answers a different question: A choice is right for another quantity: the other unknown, the rest instead of the part, the part instead of the whole.
- Counting the ends: Inclusive or exclusive ends, fence posts, consecutive numbers: an answer that is one too many or too few, or an endpoint drawn open where it belongs closed (or the reverse).
The wrong answers, classified
A Answers a different question (King et al., 2004; Hegarty, Mayer & Monk, 1995)
Gives the mode, $10.99, the price that 5 stores charge, more than any other, instead of the middle price of the 12.
B Counting the ends (Brown & Burton, 1978)
Knows to average two middle prices but takes the 5th and 6th instead of the 6th and 7th, averaging $10.99 and $11.99 to get $11.49.
D Answers a different question (King et al., 2004; Hegarty, Mayer & Monk, 1995)
Computes the mean instead, $147.88 for all 12 prices divided by 12, about $12.32, a different measure of center from the median asked for.
Worked solution, step by step
Formulas used
- Median of an even number of values
- The median is the middle value when all the values are listed from least to greatest. With an even number of values, no single value sits in the middle. So take the two middle values and find their average: add them and divide by 2.
Sort out the table
Each row gives a price and how many stores charge it. For example, 5 stores charge $10.99. So $10.99 shows up 5 times in the list of prices. Add the stores to check the count.
There are 12 prices. You need the median. That is the middle price when the prices are in order from least to greatest.
Find the middle places
12 is an even number, so no single price sits in the middle. The two middle prices are the 6th and the 7th. Five prices come before the 6th one. Five prices come after the 7th one.
Count down the table
The table already lists the prices from least to greatest. Keep a running total of the stores. It shows which places in the list each price fills.
Price Stores Places in the list $10.99 5 1st to 5th $11.99 2 6th and 7th $12.99 1 8th $13.99 4 9th to 12th The 6th and 7th prices are both $11.99.
Find the median
Use the formula with the 6th and 7th prices.
The median price is $11.99.
Watch out: $10.99 is the mode, the price that shows up most often. That is choice A, not the median. Averaging the 5th and 6th prices gives $11.49, choice B. Adding all 12 prices and dividing by 12 gives the mean, about $12.32. That is choice D.
So the answer is C, $11.99.
Check your answer
Count the prices on each side of $11.99. Five stores charge less: the five at $10.99. Five stores charge more: one at $12.99 and four at $13.99. The two sides match, so $11.99 is in the middle.
More questions like this
The original DOE question
Question 37 of 61
2023 Test B Math, question 44Question
In a certain class, Rosa will take a total of 4 tests. She has already taken 2 of the tests and earned scores of 81 and 83. What is the least possible score Rosa can earn on the third test and still be able to finish the class with an average score of 85 on all 4 tests? (Assume that test scores can range from 0 to 100.)
- A76
- B82
- C88
- D90
Show the answer
Correct answer: A
Let x represent Rosa’s score on the third test, and let y represent her score on the fourth test.
If Rosa scores 100 on the fourth test, then the least score she can earn on the third test is 76.
Question analysis
Rosa has scores of 81 and 83 on the first two of four tests and wants a mean of 85 on all four. Students find the lowest score she can earn on the third test and still reach that average, with scores capped at 100. Two tests are still unknown, so the problem needs a plan, not a single equation.
- Grade level
- Grade 6 content, by NYS standard
- Compared with grade 7
- Above grade 7 Grade 7 mean problems usually find one missing score. Here two tests remain, and the least possible score depends on how high the other unknown score is allowed to go, a planning step beyond typical grade 7 work.
- Estimated difficulty
- Hard: combines ideas, needs a plan, and has more than one tempting wrong answer.
- Thinking it demands
- Depth of knowledge 2, skills and concepts · mainly apply
- What makes it hard
- No obvious method moderate
- Many steps minor
- Solution
- 3 steps
- Reading level
- Question and choices: about grade 5, 60 words.
- Students, last 30 days
- Not enough answers yet to show (it takes 10).
Why it is hard, traps and wrong answers (shows the answer)
Why it is hard
Most students can find that Rosa needs 176 more points, but the question is about the least third score, which only comes from pushing the fourth score to its limit. Splitting the 176 evenly gives a natural-looking 88 that ignores the word least. The parenthesis about the 0 to 100 range is the key information, so it pays to ask what each stated limit is for.
No obvious method moderate Working it out
The least third score depends on how high the fourth can go; only the parenthesis “test scores can range from 0 to 100” tells students to set the fourth test at 100. (Schoenfeld, 1985)
Many steps minor Working it out
The 340 points needed, the 164 already earned, the 176 still needed and the 100 allowed on the last test make four steps, each a chance to lose track. (Daniel & Embretson, 2010; Enright, Morley & Sheehan, 2002)
Strategy: Multiply the target mean by 4 for the total points needed, subtract the two scores so far, then decide how the remaining points can be split so the third score is as low as possible.
Traps
- Misreads the question: Misses or misreads a condition or a word in the question: "at least", "each", "remaining", "not".
- Numbers taken from the question: Combines the numbers in the question without a model of the situation, or is simply a number that appears in the question.
The wrong answers, classified
B Numbers taken from the question (Hegarty, Mayer & Monk, 1995)
Takes the mean of the two scores Rosa already has, (81 + 83) ÷ 2 = 82, a number that answers nothing the question asks.
C Misreads the question (Hegarty, Mayer & Monk, 1995)
Finds the 176 points still needed and splits them evenly, 88 on each test, missing that the word least lets the fourth test carry more.
D Little reason to choose it (Haladyna & Downing, 1993; Rodriguez, 2005)
No common working gives 90; leaving out the fourth test gives (81 + 83 + x) ÷ 3 = 85 and x = 91, the nearest route, so it mostly draws guesses.
Worked solution, step by step
Formulas used
- Average
- The sum is all the scores added together. The number of scores is how many there are. The average, or mean, shares the total equally among them. Turned around, the sum equals the average times the number of scores.
Sort out the question
Rosa takes 4 tests. She scored 81 and 83 on the first two. She wants an average of 85 on all 4. You need the lowest score she can get on test 3 and still reach that average. Each score is from 0 to 100.
Find the total points needed
Turn the average formula around. The sum is the average times the number of tests.
Rosa needs 340 points in all.
Find the points still needed
Subtract the points she already has.
Tests 3 and 4 must add up to 176 points.
Make test 4 as high as possible
To make test 3 as low as it can be, test 4 must carry as many points as it can. The highest score is 100.
So the lowest score on test 3 is 76.
Watch out: Splitting 176 evenly gives 88 on each test, choice C. That works, but it is not the least score. And 82 is just the average of her first two tests, choice B.
So the answer is A, 76.
Check your answer
Add all four scores: 81 + 83 + 76 + 100 = 340. Then 340 ÷ 4 = 85, the average she wants. A score of 75 on test 3 would need 101 on test 4, which is not possible.
More questions like this
The original DOE question
Question 38 of 61
2023 Test B Math, question 57Question
A box contains 14 red marbles, 10 black marbles, and 16 white marbles. How many more white marbles need to be added to the box so that the probability of randomly drawing a white marble is ?
- A8
- B10
- C14
- D20
Show the answer
Correct answer: D
Let w represent the number of additional white marbles.
Set the probability of drawing a white marble equal to and solve the equation for w:
Question analysis
A box holds 14 red, 10 black and 16 white marbles, and students find how many white marbles must be added so that the chance of drawing a white one is 3/5. Working backward from a target probability to a number of marbles is the unusual step.
- Grade level
- Grade 7 content, by NYS standard
- Compared with grade 7
- Above grade 7 Grade 7 probability questions usually give the counts and ask for a probability. This runs the other way: the target probability is given, and the number to add changes both the white count and the total.
- Estimated difficulty
- Hard: combines ideas, needs a plan, and has more than one tempting wrong answer.
- Thinking it demands
- Depth of knowledge 2, skills and concepts · mainly apply
- What makes it hard
- Turning words into math moderate
- Variables instead of numbers minor
- Many steps minor
- Solution
- 3 steps
- Reading level
- Question and choices: about grade 8, 34 words.
- Students, last 30 days
- Not enough answers yet to show (it takes 10).
Why it is hard, traps and wrong answers (shows the answer)
Why it is hard
The tempting shortcut is to take 3/5 of the 40 marbles already in the box, which forgets that the new white marbles join the total. Students who set up the probability with the unknown in both the top and the bottom solve it in a few lines, and testing choices works too: adding 20 gives 36 white of 60, exactly 3/5. The other two choices are counts copied from the stem.
Turning words into math moderate Understanding the question
“How many more white marbles need to be added” puts the unknown in two places, (16 + w)/(40 + w), because each white marble added also raises the total. (Hegarty, Mayer & Monk, 1995; Koedinger & Nathan, 2004)
Variables instead of numbers minor Understanding the question
The unknown number of added marbles has to be carried as a letter through a proportion, 5(16 + w) = 3(40 + w), before it can be found. (Koedinger & Nathan, 2004; Enright, Morley & Sheehan, 2002)
Many steps minor Working it out
Totaling the marbles, setting up the proportion, cross-multiplying and solving 80 + 5w = 120 + 3w make four steps, unless the choices are tested one by one. (Daniel & Embretson, 2010; Enright, Morley & Sheehan, 2002)
Strategy: Let w be the number of white marbles added, write the new probability with w in both the top and the bottom, set it equal to 3/5 and solve; or test each choice.
Traps
- Percent of the wrong amount: Finding the whole from a part, or a percent change measured from the wrong starting amount.
- Numbers taken from the question: Combines the numbers in the question without a model of the situation, or is simply a number that appears in the question.
The wrong answers, classified
A Percent of the wrong amount (Parker & Leinhardt, 1995)
Takes 3/5 of the 40 marbles now in the box, 24, and subtracts the 16 white ones, forgetting that added marbles raise the total.
B Numbers taken from the question (Hegarty, Mayer & Monk, 1995)
Picks 10, the number of black marbles in the stem, without setting up the new probability or testing it.
C Numbers taken from the question (Hegarty, Mayer & Monk, 1995)
Picks 14, the number of red marbles in the stem, without checking that adding 14 white marbles gives 30 of 54, not 3/5.
Worked solution, step by step
Formulas used
- Probability
- P(white) is the probability, or chance, of drawing a white marble. The top counts the white marbles. The bottom counts every marble in the box. It works because each marble is equally likely to be drawn.
- Cross multiplication
- a and c are the tops. b and d are the bottoms. When two fractions are equal, each top times the other bottom gives the same product. It works because you multiply both sides by both bottoms. Use it to clear fractions from an equation.
Sort out the box
The box has 14 red, 10 black and 16 white marbles.
That is 40 marbles. You will add some white marbles. Call that number w. You need w so that the chance of drawing white is .
Write the new probability
Adding w white marbles changes both counts. There will be 16 + w white marbles and 40 + w marbles in all. Use the probability formula.
Watch out: Taking of 40 gives 24, and 24 − 16 = 8, choice A. That forgets that the new marbles also make the box bigger.
Cross multiply
Fractions are hard to solve with. Clear them with cross multiplication.
Then multiply each outside number by both terms inside the parentheses.
Solve for w
Subtract 3w from both sides. Then subtract 80 from both sides.
Divide both sides by 2.
You need to add 20 white marbles.
So the answer is D, 20.
Check your answer
Add 20 white marbles. Then there are 16 + 20 = 36 white marbles and 40 + 20 = 60 marbles in all. Divide the top and bottom by 12: . It works.
More questions like this
The original DOE question
Question 39 of 61
2022 Test A Math, question 37Question
Based on the circle graph, how many pounds of milk and eggs does the average American consume each year?
- A300
- B368
- C460
- D552
Show the answer
Correct answer: D
First, determine the missing percentage for “milk and eggs” consumed, based on the circle graph.
Then, determine 30% of 1,840 pounds. Multiply:
Question analysis
A circle graph shows how the 1,840 pounds of food the average American eats in a year divide among six groups, with the percent for milk and eggs left as x. Students find how many pounds of milk and eggs that is. They first work out the missing percent, then take that percent of the total.
- Grade level
- Grade 6 content, by NYS standard
- Compared with grade 7
- Below grade 7 Reading a circle graph and finding a percent of a total are grade 6 skills. Finding the missing sector from 100% adds one easy step, so this is shorter and simpler than typical grade 7 multistep percent problems.
- Estimated difficulty
- Straightforward: two steps or one careful reading.
- Thinking it demands
- Depth of knowledge 2, skills and concepts · mainly apply
- What makes it hard
- Reading a figure, table or graph moderate
- Error-prone arithmetic minor
- Solution
- 2 steps
- Reading level
- Question and choices: about grade 9, 19 words.
- Students, last 30 days
- Not enough answers yet to show (it takes 10).
Why it is hard, traps and wrong answers (shows the answer)
Why it is hard
Two short steps decide the question: find the missing percent from the other five, then take that percent of 1,840 pounds. The drawing does not help, since the milk-and-eggs sector is drawn larger than the 38% sector beside it, so the share must come from the labels. Students who find the 30 and then pick the choice whose digits match it skip the second step.
Reading a figure, table or graph moderate Understanding the question
Milk and eggs is labeled only x%, so its share comes from the five labeled sectors, 100 − 70 = 30, and the 1,840-pound total sits in a caption below the circle. (Lesh, Post & Behr, 1987; Kirsch & Mosenthal, 1990)
Error-prone arithmetic minor Working it out
Taking 30% of 1,840 by hand, 0.3 × 1,840 = 552, means a decimal times a four-digit number, best done as 184 × 3. (Brown & Burton, 1978; Junker & Sijtsma, 2001)
Strategy: Subtract the five labeled percents from 100% to find x, then multiply the 1,840-pound total by that percent written as a decimal.
Traps
- Stops one step early: A choice is a number from partway through the solution.
The wrong answers, classified
A Stops one step early (King et al., 2004; Gierl et al., 2017)
Finds the missing share, 30%, and stops; 300 is the choice whose digits match it, though 30% of 1,840 pounds is still to be taken.
B Little reason to choose it (Haladyna & Downing, 1993; Rodriguez, 2005)
No common working gives 368, which is 20% of 1,840; it would need a slip such as 80 for the labeled percents' sum, so it mostly draws guesses.
C Little reason to choose it (Haladyna & Downing, 1993; Rodriguez, 2005)
No common working gives 460, a quarter of 1,840; the sector is drawn larger than a quarter, so even judging by eye does not lead here.
Worked solution, step by step
Formulas used
- Parts of a circle graph
- A circle graph shows one whole split into parts. Each part, or section, shows its percent. The whole is 100%, so all the percents add up to 100. Use it to find a missing section.
- Percent of a number
- p is the percent. The whole is the full amount. The part is the piece that matches the percent. Percent means out of 100, so p% is p hundredths of the whole.
Sort out the question
The circle graph splits all the food an average American eats in a year into six sections. The total is 1,840 pounds per person. Five sections show a percent. Milk and eggs shows only x%. You need the pounds of milk and eggs. First find x. Then find x% of 1,840 pounds.
Trust the labels, not the drawing
This graph is not drawn to scale, though it does not say so. The milk and eggs section looks bigger than the fruits and vegetables section, which is labeled 38%. But you will see that milk and eggs is smaller. So don’t judge the size of any section by eye here. Work only from the printed numbers.
Find the missing percent
All six sections add to 100%. Put in the five labeled percents and x.
Milk and eggs is 30% of the total. That is less than 38%, though it is drawn bigger.
Find 30% of 1,840 pounds
Another way: 10% of 1,840 is 184. 30% is 3 times that, . Watch out: don’t stop at 30. Choice A, 300, only looks like 30. So the answer is D, 552 pounds.
Check your answer
Estimate. 30% is a bit less than one third. One third of 1,840 is about 613. So the answer should be a bit under 613, and 552 is. Also, , which is 30%. Choice C, 460, is only one quarter, 25%.
More questions like this
The original DOE question
Question 40 of 61
2022 Test A Math, question 41Question
LAST YEAR’S TOTAL ATTENDANCE
| Attendees | Number |
|---|---|
| Children | 1,750 |
| Adults | 2,250 |
| Seniors | 1,000 |
| Total | 5,000 |
If 100 individuals will attend the museum next week, what is the best estimate (based on last year’s attendance) of the number of children who will be in that group?
- A30
- B34
- C35
- D50
Show the answer
Correct answer: C
First, determine what percentage of the total attendees last year were children.
The best estimate based on last year’s attendance is 35% of 100.
Question analysis
A table gives last year's attendance by children, adults and seniors, 5,000 people in all. If 100 people attend the museum next week, students estimate how many of them will be children. It tests using a ratio or percent from data to make a prediction; only the children's row and the total matter.
- Grade level
- Grade 6 content, by NYS standard
- Compared with grade 7
- Below grade 7 Using last year's share of visitors to predict a smaller group is grade 6 ratio and probability work. A group of exactly 100 makes the scaling easy, so the arithmetic is lighter than in typical grade 7 proportion problems.
- Estimated difficulty
- Straightforward: two steps or one careful reading.
- Thinking it demands
- Depth of knowledge 2, skills and concepts · mainly apply
- What makes it hard
- Solution
- 2 steps
- Reading level
- Question and choices: about grade 5, 38 words.
- Students, last 30 days
- Not enough answers yet to show (it takes 10).
Why it is hard, traps and wrong answers (shows the answer)
Why it is hard
The share 1,750 out of 5,000 converts neatly to 35 out of 100, and next week's group happens to be exactly 100, so the arithmetic is nearly done once the proportion is written. Points slip away when a student works out the scale factor between the two totals and gives it, or estimates the share instead of computing it. Dividing 1,750 by 50 checks the result.
Turning words into math minor Understanding the question
The phrase “best estimate (based on last year’s attendance)” has to become a proportion: children keep the share of next week's 100 that they had of last year's 5,000. (Hegarty, Mayer & Monk, 1995; Koedinger & Nathan, 2004)
Reading a figure, table or graph minor Understanding the question
Only the children row, 1,750, and the 5,000 total are needed; the adults and seniors rows add numbers that play no part in the estimate. (Lesh, Post & Behr, 1987; Kirsch & Mosenthal, 1990)
Strategy: Find what fraction of last year's 5,000 visitors were children, rewrite it as an equivalent fraction out of 100, and apply it to next week's group.
Traps
- Stops one step early: A choice is a number from partway through the solution.
- Information you don't need: The question gives numbers or facts that play no part in the answer.
The wrong answers, classified
A Little reason to choose it (Haladyna & Downing, 1993; Rodriguez, 2005)
No common working gives 30, which would need 1,500 children last year; it mostly draws students who round the share down or guess a round number.
B Little reason to choose it (Haladyna & Downing, 1993; Rodriguez, 2005)
No common working gives 34; splitting 100 evenly among three groups gives 33 1/3, the closest route, so it mostly draws guesses.
D Stops one step early (King et al., 2004; Gierl et al., 2017)
Divides 5,000 by 100 to get the scale factor, 50, and gives it, stopping before dividing the 1,750 children by that factor.
Worked solution, step by step
Formulas used
- Percent of a total
- The part is the number in one group, here children. The whole is the total of all groups. Dividing gives the fraction of the whole that the group makes up. Times 100 turns it into a percent, a number out of 100.
- Percent of a number
- p is the percent. The whole is the full amount. The part is the piece that matches the percent. Percent means out of 100, so p% is p hundredths of the whole.
Sort out the question
Last year 5,000 people came in all. 1,750 of them were children. Next week 100 people will come. You need the best estimate of how many will be children. Best estimate means children make up the same share as last year. You don’t need the adults and seniors rows.
Find last year’s percent of children
So 35% of last year’s visitors were children. That means 35 out of every 100.
Use that percent for 100 people
About 35 of the 100 people should be children. Watch out: tells how many times bigger last year’s crowd was. It is not a number of children. Don’t pick 50, choice D. So the answer is C, 35.
Check your answer
Shrink both numbers the same way. Since , divide the children by 50 too: . That matches. Also, 1,750 is a bit more than one third of 5,000, and 35 is a bit more than one third of 100.
More questions like this
The original DOE question
Question 41 of 61
2022 Test A Math, question 43Question
A bag contains 15 marbles: 11 blue marbles and 4 red marbles. Sarah picks one marble randomly, returns it to the bag, and then randomly picks one marble again. What is the probability that she picks a red marble both times?
- A
- B
- C
- D
Show the answer
Correct answer: A
The probability of drawing a red marble at random from a bag of 15 marbles (11 blue and 4 red) is shown:
When the red marble is replaced in the bag, the probability of picking a red marble is unchanged, .
The two events are independent, so the multiplication rule of probability applies.
Question analysis
A bag holds 11 blue and 4 red marbles. Sarah picks one at random, puts it back, and picks again, and students find the probability that she picks red both times. It tests the probability of a compound event made of two independent picks; the bold word both and the replacement shape the calculation.
- Grade level
- Grade 7 content, by NYS standard
- Compared with grade 7
- At grade 7 Finding the probability of two independent picks is grade 7 compound-event work. Because the marble is put back, the two picks are alike, and the numbers are small, which makes this a typical grade 7 probability task.
- Estimated difficulty
- Straightforward: two steps or one careful reading.
- Thinking it demands
- Depth of knowledge 2, skills and concepts · mainly apply
- What makes it hard
- Something you must already know moderate
- Turning words into math minor
- Solution
- 2 steps
- Reading level
- Question and choices: about grade 6, 42 words.
- Students, last 30 days
- Not enough answers yet to show (it takes 10).
Why it is hard, traps and wrong answers (shows the answer)
Why it is hard
The arithmetic is two small fractions multiplied, so the question rests on knowing which rule applies. Adding the two chances gives more than either chance alone, which cannot be right for two reds in a row, and comparing red with blue instead of with all 15 marbles changes every denominator. A sense check helps: two reds in a row must be less likely than a single red, 4/15.
Something you must already know moderate Working it out
The multiplication rule for independent events is not given: because the marble goes back, each pick is 4 out of 15, and red both times means 4/15 × 4/15. (Anderson & Krathwohl, 2001)
Turning words into math minor Understanding the question
Two phrases carry the method: “returns it to the bag” keeps the second pick at 4 out of 15, and “red marble both times” asks for both events, not either. (Hegarty, Mayer & Monk, 1995; Koedinger & Nathan, 2004)
Strategy: Find the chance of red on a single pick out of all the marbles. Since the marble goes back, the second pick has the same chance; then use the rule for two independent events both happening.
Traps
- Wrong operation: Adds instead of multiplying, divides the wrong way round, turns a ratio or rate upside down, or undoes a step in the wrong direction (subtracts what should be added back).
- Misunderstands the concept: A wrong belief about a concept: that percents can be added, that area grows like length, that averages can be averaged, that a bigger denominator means a bigger fraction.
- Answers a different question: A choice is right for another quantity: the other unknown, the rest instead of the part, the part instead of the whole.
The wrong answers, classified
B Misunderstands the concept (Smith, diSessa & Roschelle, 1993; De Bock et al., 1998; Ni & Zhou, 2005)
Uses red to blue, 4 to 11, as the chance of red instead of 4 out of all 15 marbles, then squares it, a part-to-part ratio.
C Wrong operation (Hegarty, Mayer & Monk, 1995; King et al., 2004)
Adds the two chances, 4/15 + 4/15 = 8/15, instead of multiplying, as if a red marble on either pick were enough.
D Answers a different question (King et al., 2004; Hegarty, Mayer & Monk, 1995)
Finds the chance of blue both times, (11/15)² = 121/225, answering for the wrong color with the right method.
Worked solution, step by step
Formulas used
- Probability of an event
- P is the probability, the chance that something happens, from 0 (never) to 1 (always). An outcome is one possible result, here one marble. Divide the number of results you want by the number of all results.
- Two independent events both happening
- A and B are two events. Independent means one does not change the chance of the other. P(A) is the chance of A, and P(B) is the chance of B. Multiply them to get the chance that both happen.
Sort out the question
The bag has 15 marbles: 11 blue and 4 red. Sarah picks one, puts it back, then picks again. You need the probability, or chance, that both picks are red. Putting the marble back matters. The bag is the same for the second pick.
Find the chance of red on one pick
There are 4 red marbles out of 15 in all. Watch out: compare red with all 15 marbles, not with the 11 blue ones. Using 4 out of 11 leads to , choice B.
See that the picks are independent
Sarah puts the marble back. So the bag again has 4 red marbles out of 15. The second pick has the same chance, 4/15. The first pick does not change the second one. That makes the two picks independent.
Multiply the two chances
To multiply fractions, multiply the tops and multiply the bottoms. Watch out: don’t add. , choice C, is a bigger chance than one red. And , choice D, is the chance of blue both times. So the answer is A, .
Check your answer
Two reds in a row should be less likely than one red. One red is , about 0.27. is about 0.07, much smaller. That makes sense. Adding gave , about 0.53, which is too big.
More questions like this
The original DOE question
Question 42 of 61
2022 Test B Math, question 5Question
A row of seats in a theater contains 20 seats numbered from 101 to 120. The probability that a randomly chosen seat in this row will be numbered 104 is x%. What is the value of x?
Grid-in question: work out the answer and enter it as a number.
Show the answer
Correct answer: 5
The probability that any 1 seat will be selected at random from 20 seats is 1 out of 20. To find the probability as a percentage, convert the fraction to a decimal.
Then convert the decimal to a percentage by multiplying by 100.
The probability is 5%.
Question analysis
A theater row has 20 seats numbered 101 to 120, and one seat is chosen at random. Students find the probability that it is one particular seat, written as x%, and type the value of x. It tests simple probability and changing a fraction to a percent; the seat numbers themselves play no part in the answer.
- Grade level
- Grade 6 content, by NYS standard
- Compared with grade 7
- Below grade 7 The probability of one equally likely outcome is grade 6 content, and turning it into a percent is a short grade 6 step. Grade 7 probability usually involves compound events, which this question does not.
- Estimated difficulty
- Straightforward: two steps or one careful reading.
- Thinking it demands
- Depth of knowledge 2, skills and concepts · mainly apply
- What makes it hard
- An answer in an unexpected form moderate
- Error-prone arithmetic minor
- Solution
- 2 steps
- Reading level
- Question and choices: about grade 5, 33 words.
- Students, last 30 days
- Not enough answers yet to show (it takes 10).
Why it is hard, traps and wrong answers (shows the answer)
Why it is hard
The seat numbers, 101 to 120, and the chosen seat 104 play no part: the row holds 20 equally likely seats, so the chance is 1 in 20. What the item tests is the change of form, from a fraction to the number in front of a percent sign. Knowing that 1/20 is half of 1/10, which is 10%, gives the value at once and rules out both 0.05 and 50.
An answer in an unexpected form moderate Choosing the answer
The probability is asked for as the x in x%, so 1 out of 20 must become the number 5, not the fraction 1/20 or the decimal 0.05 it is first found as. (Enright, Morley & Sheehan, 2002)
Error-prone arithmetic minor Working it out
Dividing 1 by 20 gives 0.05, with a zero in the tenths place, and losing that zero makes the percent ten times too large. (Brown & Burton, 1978; Junker & Sijtsma, 2001)
Strategy: Count the seats, write the chance of one particular seat as a fraction, then change it to a percent and enter only the number in front of the percent sign.
Traps
- Stops one step early: A choice is a number from partway through the solution.
- Information you don't need: The question gives numbers or facts that play no part in the answer.
- Misunderstands the concept: A wrong belief about a concept: that percents can be added, that area grows like length, that averages can be averaged, that a bigger denominator means a bigger fraction.
The wrong answers, classified
0.05 Stops one step early (King et al., 2004; Gierl et al., 2017)
Finds the probability, 1 ÷ 20 = 0.05, and enters the decimal without multiplying by 100 to give x as a number of percent.
50 An arithmetic slip (Junker & Sijtsma, 2001)
Loses the zero after the decimal point when dividing, taking 1 ÷ 20 as 0.5, as 1 ÷ 2 would be, and so enters 50.
20 Misunderstands the concept (Smith, diSessa & Roschelle, 1993; De Bock et al., 1998; Ni & Zhou, 2005)
Reads 1 chance in 20 as 20 percent, putting the number of seats in place of the percent instead of dividing 1 by 20.
Worked solution, step by step
Formulas used
- Probability of one outcome
- P is the probability, the chance that something happens, from 0 to 1. The top counts the outcomes you want. The bottom counts all the outcomes that could happen. Use it when every outcome is equally likely, like one seat picked from a row.
- Fraction to percent
- A percent is a number out of 100. Multiplying a fraction or decimal by 100 tells how many out of 100 it is. So 1/2 times 100 is 50, which means 50%.
Sort out the question
The row has 20 seats, numbered 101 to 120. One seat is picked at random. At random means every seat has the same chance. You need the chance that it is seat 104, written as x%. Then you grid x.
The seat numbers don’t change the math. Only the number of seats matters.
Write the chance as a fraction
Seat 104 is 1 seat. There are 20 seats in all.
So the chance is 1 out of 20.
Change the fraction to a percent
Use the formula: multiply the fraction by 100.
So the chance is 5%. As a decimal, it is 0.05.
Give the answer
The question asks for x, the number in front of the % sign. That is 5.
Watch out: 0.05 is the decimal, not the percent. Writing 1 ÷ 20 as 0.5 gives 50. And 20 is the number of seats, not the percent. So you would grid 5.
Check your answer
All 20 seats share 100% equally. Each seat gets percent. That includes seat 104. Also, 1/20 is half of 1/10, and 1/10 is 10%. Half of 10% is 5%.
More questions like this
The original DOE question
Question 43 of 61
2022 Test B Math, question 38Question
WINTER TEMPERATURES IN CHICAGO
| Day | 1 | 2 | 3 | 4 | 5 | 6 | 7 |
|---|---|---|---|---|---|---|---|
| Temperature (°F) | 17 | 7 | 2 | 4 | −3 | −5 | 1 |
The table above shows temperatures for a one-week period during the winter in Chicago. What is the range of temperatures shown in the table?
- A12
- B17
- C22
- D27
Show the answer
Correct answer: C
Range is the difference between the largest and the smallest values in a given set of data. In this case, the highest temperature is 17 and the lowest temperature is −5. Therefore, the range is .
Question analysis
A table gives Chicago's temperatures in degrees Fahrenheit for seven winter days, some above zero and some below. Students find the range of the temperatures. It tests the meaning of range and subtracting a negative number, and treating a below-zero reading as if it were positive gives a wrong spread.
- Grade level
- Grade 7 content, by NYS standard
- Compared with grade 7
- At grade 7 Range is a grade 6 idea, and subtracting a negative number is grade 7. Here they meet in a single subtraction from a short table, typical grade 7 practice with integers rather than anything longer.
- Estimated difficulty
- Straightforward: two steps or one careful reading.
- Thinking it demands
- Depth of knowledge 2, skills and concepts · mainly apply
- What makes it hard
- Solution
- 2 steps
- Reading level
- Question and choices: about grade 8, 31 words.
- Students, last 30 days
- Not enough answers yet to show (it takes 10).
Why it is hard, traps and wrong answers (shows the answer)
Why it is hard
Finding a range is routine, but the lowest reading is below zero, so the subtraction crosses zero: from −5 up to 0 is 5 degrees, and from 0 up to 17 is 17 more. Students who treat −5 as 5 find a smaller gap that is listed. Picturing a thermometer, or a number line, shows the full spread at a glance.
Error-prone arithmetic moderate Working it out
The lowest reading is −5°F, so the range is 17 − (−5), and subtracting a negative number means adding 5, the step where a gap of 12 appears instead. (Brown & Burton, 1978; Junker & Sijtsma, 2001)
Reading a figure, table or graph minor Understanding the question
The seven readings run across one table row in day order, 17, 7, 2, 4, −3, −5, 1, so the extremes have to be picked out, including the lower of the two below zero. (Lesh, Post & Behr, 1987; Kirsch & Mosenthal, 1990)
Something you must already know minor Working it out
The word range is not defined in the question; students must know it means the highest value minus the lowest, not the highest value alone. (Anderson & Krathwohl, 2001)
Strategy: Pick out the highest and the lowest temperature in the table, then subtract the lowest from the highest, writing the subtraction of a negative as an addition.
Traps
- Negatives and direction: Arithmetic with negative numbers, the order of a subtraction, or direction on a number line. (Moving a term across the equals sign without changing its sign is a faulty procedure.)
- Answers a different question: A choice is right for another quantity: the other unknown, the rest instead of the part, the part instead of the whole.
The wrong answers, classified
A Negatives and direction (Brown & Burton, 1978)
Subtracts 5 from 17 as if −5 were 5, so the range comes out 12, missing that a reading below zero lies further from 17, not closer.
B Answers a different question (King et al., 2004; Hegarty, Mayer & Monk, 1995)
Gives the highest temperature, 17°F, as the range, taking the top of the readings for the spread between the highest and the lowest.
D Little reason to choose it (Haladyna & Downing, 1993; Rodriguez, 2005)
No common working gives 27: it is 5 more than the true spread and matches no sign or subtraction mistake with these readings, so it mostly draws guesses.
Worked solution, step by step
Formulas used
- Range
- The range tells how spread out the data are. Find the highest value and the lowest value, then subtract. It is the distance between the two ends of the data on a number line.
- Subtracting a negative
- a is any number, and −b is a negative number. Taking away a negative is the same as adding the positive number b. On a number line, the gap from −5 up to 17 is 5 to reach 0, then 17 more.
Sort out the question
The table gives seven temperatures, in degrees Fahrenheit (°F): 17, 7, 2, 4, −3, −5 and 1. A minus sign means below zero. You need the range, the highest temperature minus the lowest.
Find the highest and lowest
The highest is 17°F, on day 1. For the lowest, look at the numbers below zero: −3 and −5. −5 is colder, since it is further below zero. So the lowest is −5°F, on day 6.
Subtract the lowest from the highest
Subtracting a negative is the same as adding. The range is 22 degrees Fahrenheit.
Watch out: −5 is not 5. Doing 17 − 5 = 12 gives choice A. And 17 alone is just the highest temperature, choice B. So the answer is C, 22.
Check your answer
Picture a thermometer. From −5°F up to 0°F is 5 degrees. From 0°F up to 17°F is 17 more. In all, degrees. That matches.
More questions like this
The original DOE question
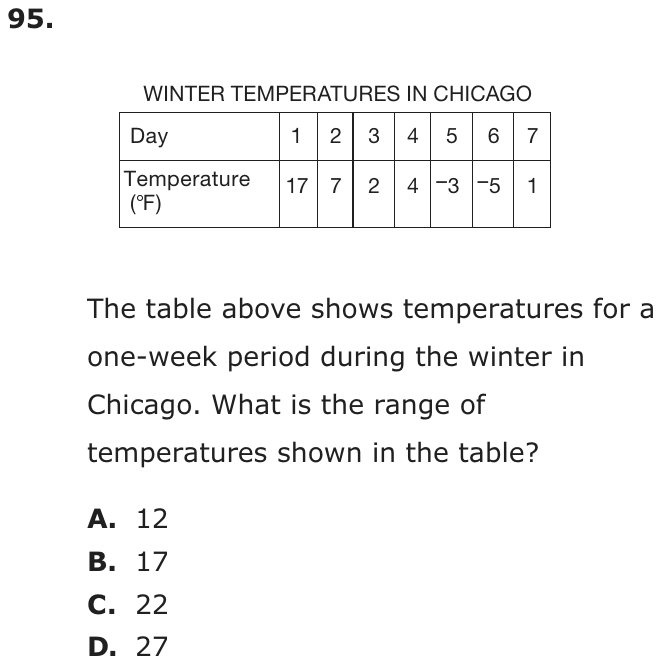
Question 44 of 61
2022 Test B Math, question 39Question
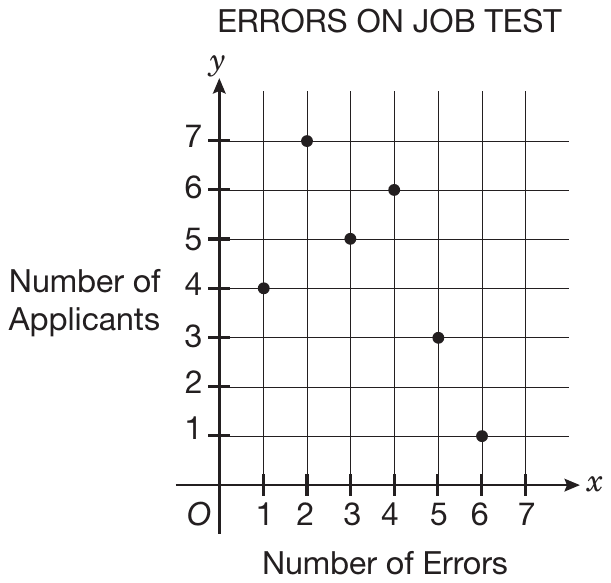
A total of 26 job applicants took a computer-competency test, and the number of errors (x) was recorded for each applicant. The graph above shows how many applicants made x errors, for each value of x. How many applicants made fewer than 3 errors?
- A6
- B11
- C12
- D26
Show the answer
Correct answer: B
Each (x, y) ordered pair represents y, the number of applicants that made x errors.
First, determine the points with x-values less than 3.
The point (1, 4) means that 4 applicants made 1 error.
The point (2, 7) means that 7 applicants made 2 errors.
Then, add the y-values to find the total applicants who made fewer than 3 errors.
Question analysis
A graph titled Errors on Job Test shows, for each number of errors, how many of 26 job applicants made that many. Students find how many applicants made fewer than 3 errors. It tests reading a data display in which each point's height is a count of people, and the words fewer than decide which points to use.
- Grade level
- Grade 6 content, by NYS standard
- Compared with grade 7
- Below grade 7 Reading counts from a data display and adding them is grade 6 statistics. It needs only a few readings from the graph and one addition, less than typical grade 7 data work, which compares distributions or uses box plots.
- Estimated difficulty
- Routine: one familiar step, little to misread.
- Thinking it demands
- Depth of knowledge 2, skills and concepts · mainly apply
- What makes it hard
- Solution
- 2 steps
- Reading level
- Question and choices: about grade 9, 42 words.
- Students, last 30 days
- Not enough answers yet to show (it takes 10).
Why it is hard, traps and wrong answers (shows the answer)
Why it is hard
This is a reading question more than a computing one: two heights from the graph and one addition. The point at 3 errors is the one to leave out, since fewer than 3 stops at 2. Checking that all six heights add up to the 26 applicants named in the stem confirms the readings before they are used.
Reading a figure, table or graph minor Understanding the question
Each point’s height is a number of applicants, so the counts for 1 and 2 errors, 4 and 7, are read on the vertical axis above those error values. (Lesh, Post & Behr, 1987; Kirsch & Mosenthal, 1990)
Turning words into math minor Understanding the question
The words “fewer than 3 errors” mean the points at 1 and 2 errors only, leaving out the 5 applicants who made exactly 3. (Hegarty, Mayer & Monk, 1995; Koedinger & Nathan, 2004)
Strategy: Read the number of applicants at each error count below 3 from the heights of the points, then add those numbers.
Traps
- Misreads the figure: Reads a value, label or tick spacing in a figure, table or graph wrongly.
- Answers a different question: A choice is right for another quantity: the other unknown, the rest instead of the part, the part instead of the whole.
The wrong answers, classified
A Misreads the figure (Lesh, Post & Behr, 1987; Kirsch & Mosenthal, 1990)
Reads the axes the wrong way round, so the one point with a height below 3, (6, 1), seems to show 6 applicants making 1 error.
C Little reason to choose it (Haladyna & Downing, 1993; Rodriguez, 2005)
No single misreading gives 12; working from the total, 26 − 15 = 11, reaches it only if a point is skipped, so it mostly draws guesses.
D Answers a different question (King et al., 2004; Hegarty, Mayer & Monk, 1995)
Gives the 26 applicants stated in the stem, everyone who took the test, instead of only those who made fewer than 3 errors.
Worked solution, step by step
Formulas used
- Reading a point
- Each point on the graph is an ordered pair. The first number, x, is read on the bottom axis: the number of errors. The second number, y, is read on the side axis: how many applicants made that many errors.
Sort out the question
In all, 26 applicants took a test. The graph shows how many made each number of errors. You need how many made “fewer than 3 errors.”
Fewer than 3 means 0, 1 or 2 errors. It does not include 3.
Read the points you need
Find the error count on the bottom axis. Then go up to the point and read across to the side axis.
- At 1 error, the point is at height 4. So 4 applicants made 1 error.
- At 2 errors, the point is at height 7. So 7 applicants made 2 errors.
There is no point at 0 errors.
Add the two counts
So 11 applicants made fewer than 3 errors.
Watch out: leave out the point at 3 errors, (3, 5). Those 5 applicants made exactly 3 errors, not fewer. Reading the axes the wrong way round can give 6, choice A. And 26 is everyone, choice D. So the answer is B, 11.
Check your answer
Add all six heights: . That is the 26 applicants in the question, so the readings are right. It also shows nobody made 0 errors. The other made 3 or more.
More questions like this
The original DOE question
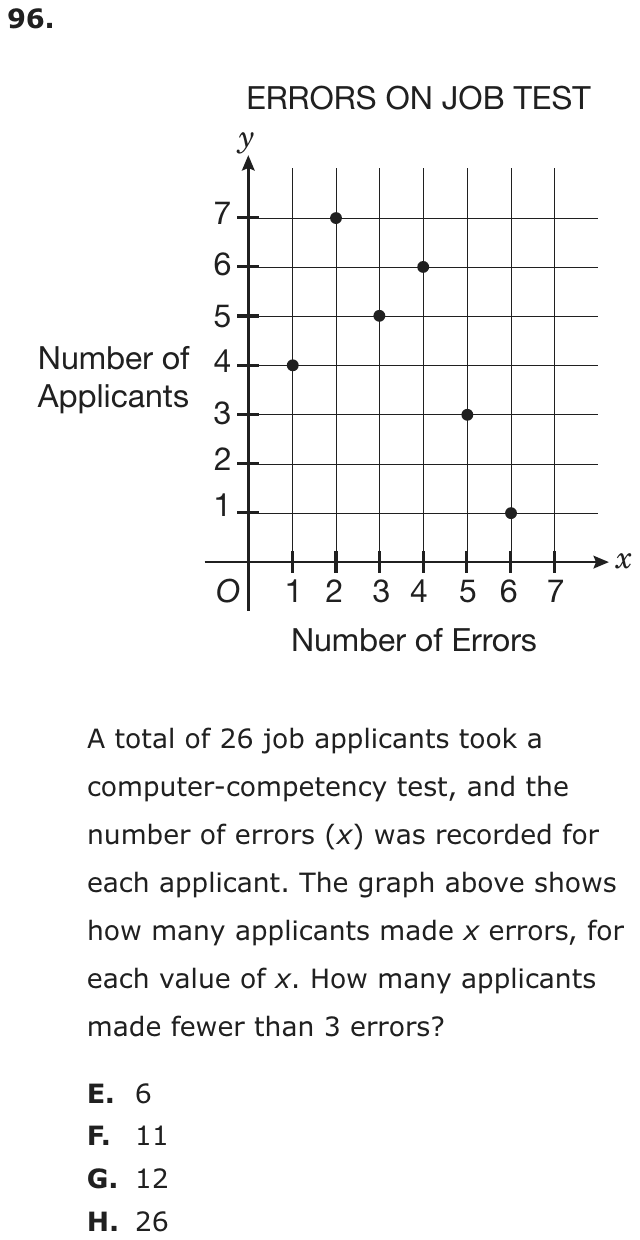
Question 45 of 61
2022 Test B Math, question 42Question
At any given time, one person out of every 20 people has the common cold. Assume that the common cold can be caused by any one of 200 different viruses, each of which is equally likely to cause the cold. One of these 200 viruses is cold virus V144. What is the probability that a randomly selected person is suffering from a cold caused by virus V144?
- A
- B
- C
- D
Show the answer
Correct answer: D
To calculate the joint probability, you must first determine the probability of each independent event. The probability that a randomly selected person has a common cold is . The probability that a cold is caused by V144 is . The probability that a person has a cold and the cold is caused by the V144 virus is the product of those two probabilities, .
Question analysis
One person in 20 has a common cold at any given time, and each cold comes from one of 200 equally likely viruses. Students find the probability that a randomly selected person has a cold caused by one particular virus, V144. It tests the probability of a compound event, which is hidden here inside a single phrase.
- Grade level
- Grade 7 content, by NYS standard
- Compared with grade 7
- At grade 7 Grade 7 students find compound probabilities, usually from organized lists or tree diagrams. Here the two stages are hidden in one phrase, a cold caused by one particular virus, and there are far too many outcomes to list.
- Estimated difficulty
- Moderate: several steps, or a close reading with one strong distractor.
- Thinking it demands
- Depth of knowledge 2, skills and concepts · mainly apply
- What makes it hard
- Turning words into math moderate
- Something you must already know moderate
- Solution
- 2 steps
- Reading level
- Question and choices: about grade 6, 68 words.
- Corrected from the DOE handbook
- A probability in the explanation that was stated for the wrong event was corrected.
- Students, last 30 days
- Not enough answers yet to show (it takes 10).
Why it is hard, traps and wrong answers (shows the answer)
Why it is hard
The arithmetic is one multiplication; the difficulty is seeing that the event has two stages. Each stated chance, 1 in 20 for a cold and 1 in 200 for the virus behind it, is listed as a choice on its own, and each answers only half the question. A chance that both stages happen must be smaller than either one alone, which leaves a single choice.
Turning words into math moderate Understanding the question
The single phrase “a cold caused by virus V144” holds two events, having a cold at all and that cold coming from V144, and they must be separated before any rule applies. (Hegarty, Mayer & Monk, 1995; Koedinger & Nathan, 2004)
Something you must already know moderate Working it out
The stem never says that the chance of both stages is the product of their chances, so students must bring that rule to the 1 in 20 and the 1 in 200 themselves. (Anderson & Krathwohl, 2001)
Strategy: Split the event into two stages, having a cold and that cold coming from V144, write each stage's chance as a fraction, and combine them with the rule for events that must both happen.
Traps
- Stops one step early: A choice is a number from partway through the solution.
- Wrong operation: Adds instead of multiplying, divides the wrong way round, turns a ratio or rate upside down, or undoes a step in the wrong direction (subtracts what should be added back).
The wrong answers, classified
A Wrong operation (Hegarty, Mayer & Monk, 1995; King et al., 2004)
Divides one chance by the other, 1/200 ÷ 1/20 = 20/200 = 1/10, instead of multiplying them, giving a chance larger than either stage.
B Stops one step early (King et al., 2004; Gierl et al., 2017)
Gives the chance that a person has a cold of any kind, 1 in 20, and stops before multiplying by the 1/200 chance that V144 caused it.
C Stops one step early (King et al., 2004; Gierl et al., 2017)
Gives the chance that a cold is caused by V144, one virus out of 200, forgetting that only 1 person in 20 has a cold at all.
What was corrected from the DOE handbook, and why
- Explanation: The handbook says “The probability that a person has a cold caused by V144 is 1/200.” A person having a cold caused by V144 is exactly what the question asks about, and the same paragraph goes on to give its probability as 1/4,000; as printed, the sentence gives that event the value of choice C. The 1/200 is the probability that a cold is caused by V144 (one of 200 equally likely viruses), so the site reads “The probability that a cold is caused by V144 is 1/200.” The working and the answer are unchanged: 1/20 × 1/200 = 1/4,000.
Worked solution, step by step
Formulas used
- Probability of one outcome
- P is the probability, the chance that something happens, from 0 to 1. The top counts the outcomes you want. The bottom counts all the outcomes that could happen. Use it when every outcome is equally likely, like one virus out of 200.
- Chance that two events both happen
- A is the first event and B is the second. P(A) is the chance of A. P(B given A) is the chance of B among the times A has happened. Multiply them to get the chance that both happen. The result is smaller than either chance, since both things must happen.
Sort out the question
One person in 20 has a cold. Every cold comes from one of 200 viruses, all equally likely. V144 is one of them. You need the chance that a random person has a cold caused by V144.
That phrase holds two events. First, the person has a cold. Second, that cold comes from V144.
Find the chance of a cold
The question says “one person out of every 20 people has the common cold.” So 1 person is the part with a cold, and 20 is the whole group.
Find the chance it is V144
Now think only about people who have a cold. Each cold comes from one of 200 viruses, all equally likely. V144 is 1 of the 200.
This chance is only about people who already have a cold. So the second event depends on the first.
Multiply the two chances
Use the rule for two events that must both happen. Event A is a cold, and event B is V144 as its cause.
Multiply the tops: 1 × 1 = 1. Multiply the bottoms: 20 × 200 = 4,000.
Give the answer
Watch out: 1/20 is the chance of any cold, choice B. And 1/200 is the chance that a cold comes from V144, choice C. Each one answers only half the question. Dividing one by the other gives 1/10, choice A. So the answer is D, .
Check your answer
Picture 4,000 people. One in 20 has a cold, so people have colds. Of those 200 colds, 1 in 200 comes from V144. That is 1 person out of 4,000. It is also smaller than both 1/20 and 1/200, as it should be.
More questions like this
The original DOE question
Question 46 of 61
2018 Test A Math, question 8Question
In a certain school, course grades range from 0 to 100. Adrianna took 4 courses and her mean course grade was 90. Roberto took 5 courses. If both students have the same sum of course grades, what was Roberto’s mean?
- A72
- B80
- C90
- D92
Show the answer
Correct answer: A
The sum of Adrianna’s course grades equals 4 times the mean (average) of her grades:
90 × 4 = 360
Roberto has the same sum (360) as Adrianna. Find the mean of his course grades:
360 ÷ 5 = 72
Question analysis
This averages word problem compares two students' course grades. One student's number of courses and mean grade are given, and a second student has the same total over a different number of courses. Students work back from a mean to a sum, then find a new mean, while the stated grade range plays no part.
- Grade level
- Grade 6 content, by NYS standard
- Compared with grade 7
- Below grade 7 Finding a mean is grade 6 content, and this needs only the step back from a mean to a total and one division. Typical grade 7 statistics work compares two data sets, which asks more.
- Estimated difficulty
- Straightforward: two steps or one careful reading.
- Thinking it demands
- Depth of knowledge 2, skills and concepts · mainly apply
- What makes it hard
- Turning words into math moderate
- Something you must already know minor
- Solution
- 2 steps
- Reading level
- Question and choices: about grade 2, 35 words.
- Students, last 30 days
- Not enough answers yet to show (it takes 10).
Why it is hard, traps and wrong answers (shows the answer)
Why it is hard
The question turns on one idea, that a mean times the number of items gives the total, and the numbers are easy. Students who skim "the same sum" as "the same mean" carry Adrianna's 90 straight across, and the 0-to-100 range in the first sentence offers a second number to misuse. Converting to the shared total of 360 first makes the rest a single division.
Turning words into math moderate Understanding the question
"Both students have the same sum of course grades" is the bridge: Adrianna's mean of 90 must be turned into a total, 4 × 90, before it says anything about Roberto. (Hegarty, Mayer & Monk, 1995; Koedinger & Nathan, 2004)
Something you must already know minor Working it out
The link between a mean and a total, sum = mean × number of courses, is not given and has to be used in both directions. (Anderson & Krathwohl, 2001)
Strategy: Multiply the first student's mean by her number of courses to get the shared total, then divide that total by Roberto's number of courses.
Traps
- Misunderstands the concept: A wrong belief about a concept: that percents can be added, that area grows like length, that averages can be averaged, that a bigger denominator means a bigger fraction.
- Information you don't need: The question gives numbers or facts that play no part in the answer.
The wrong answers, classified
B Numbers taken from the question (Hegarty, Mayer & Monk, 1995)
Uses 100, the top of the grade range, in place of Adrianna's mean of 90: 4 × 100 = 400, and 400 ÷ 5 = 80.
C Misunderstands the concept (Smith, diSessa & Roschelle, 1993; De Bock et al., 1998; Ni & Zhou, 2005)
Assumes an equal sum means an equal mean and gives Adrianna's 90, ignoring that Roberto's 360 points are spread over 5 courses, not 4.
D Numbers taken from the question (Hegarty, Mayer & Monk, 1995)
Adds a fifth grade of 100, the top of the stated range, to Adrianna's total: (360 + 100) ÷ 5 = 92.
Worked solution, step by step
Formulas used
- Mean (average)
- M is the mean, also called the average. S is the sum, all the values added together. n is how many values there are. Dividing shares the total out equally, so the mean is what each value would be if they were all the same.
- Sum from the mean
- This is the mean formula turned around. S is the sum, M is the mean, and n is how many values there are. If n values were each equal to the mean, they would add up to M times n. That is the same as the real sum.
Sort out the question
Adrianna took 4 courses, and her mean grade was 90. The mean is the average. Roberto took 5 courses. The key fact is that both have “the same sum of course grades”. The sum is all the grades added together. You need Roberto’s mean. The 0 to 100 range is not needed.
Find Adrianna’s total
You know her mean and her number of courses. Use the sum formula.
Her grades add up to 360 points.
Find Roberto’s mean
Roberto’s grades also add up to 360 points. But he spreads them over 5 courses. Use the mean formula.
His mean is 72.
Avoid the traps and answer
Watch out: the same sum does not mean the same mean. Roberto has more courses sharing the points, so his mean is lower. Choosing 90 is choice C. Watch out: don’t use 100, the top grade, in place of 90. That leads to 80, choice B. So the answer is A, 72.
Check your answer
More courses share the same 360 points, so Roberto’s mean must be lower than 90. 72 is lower. Multiply back: , which matches Adrianna’s total.
More questions like this
The original DOE question
Question 47 of 61
2018 Test A Math, question 11Question
PEOPLE PER VEHICLE AT CHECKPOINT
| Number of People in Vehicle | Percent of Vehicles |
| 1 | 40% |
| 2 | 35% |
| 3 | 15% |
| 4 | 7% |
| 5 or more | 3% |
A researcher recorded the number of people in each vehicle that passed through a checkpoint. The table above shows the percent distribution for the 420 vehicles that passed through the checkpoint yesterday morning. How many of the 420 vehicles contained at least 3 people?
- A42
- B63
- C105
- D315
Show the answer
Correct answer: C
First, add the percentage of cars containing 3 people, 4 people, and 5 or more people:
15% + 7% + 3% = 25%
Thus, 25% of the cars contained at least 3 people, so use that to calculate the number of cars:
420 × 0.25 = 105 cars.
Question analysis
A data table question with percents: a table gives the percent of 420 vehicles carrying 1, 2, 3, 4, or 5 or more people. Students find how many vehicles held at least 3 people by adding the right rows and taking that percent of 420. Reading at least correctly decides which rows count.
- Grade level
- Grade 6 content, by NYS standard
- Compared with grade 7
- At grade 7 Taking a percent of a number is grade 6 work, and grade 7 adds multistep percent problems. This two-step table problem sits at that level, with the phrase at least as the careful-reading point.
- Estimated difficulty
- Moderate: several steps, or a close reading with one strong distractor.
- Thinking it demands
- Depth of knowledge 2, skills and concepts · mainly apply
- What makes it hard
- Turning words into math moderate
- Reading a figure, table or graph moderate
- Solution
- 2 steps
- Reading level
- Question and choices: about grade 7, 56 words.
- Students, last 30 days
- Not enough answers yet to show (it takes 10).
Why it is hard, traps and wrong answers (shows the answer)
Why it is hard
The arithmetic is easy, since 25% of 420 is a quarter of it; the points are lost on the phrase "at least 3". Each common misreading, more than 3, exactly 3 or fewer than 3, gives a listed choice, so a wrong reading never leads to a dead end. Adding the percents before converting saves time and avoids three separate multiplications.
Turning words into math moderate Understanding the question
The bold "at least 3" has to become the rows for 3, 4 and "5 or more", taking in both the 3-person row and the open-ended last row. (Hegarty, Mayer & Monk, 1995; Koedinger & Nathan, 2004)
Reading a figure, table or graph moderate Understanding the question
The table gives percents, not counts, so the rows have to be added as percents and then taken of the 420 vehicles named only in the text below the table. (Lesh, Post & Behr, 1987; Kirsch & Mosenthal, 1990)
Strategy: Add the percents for every row that meets the condition first, then take that single percent of 420 instead of working row by row.
Traps
- Counting the ends: Inclusive or exclusive ends, fence posts, consecutive numbers: an answer that is one too many or too few, or an endpoint drawn open where it belongs closed (or the reverse).
- Answers a different question: A choice is right for another quantity: the other unknown, the rest instead of the part, the part instead of the whole.
The wrong answers, classified
A Counting the ends (Brown & Burton, 1978)
Reads at least 3 as more than 3 and leaves out the 3-person row, adding only 7% + 3% = 10%, and 10% of 420 is 42.
B Misreads the question (Hegarty, Mayer & Monk, 1995)
Matches the 3 in the question to the row for exactly 3 people, 15% of 420 = 63, missing the 4-person and 5-or-more rows.
D Answers a different question (King et al., 2004; Hegarty, Mayer & Monk, 1995)
Adds the 40% and 35% rows to get 75% and takes 75% of 420 = 315, which counts the vehicles with fewer than 3 people.
Worked solution, step by step
Formulas used
- Percent of a number
- W is the whole amount. p is the percent, and x is the part you want. Percent means out of 100, so p percent is the fraction p over 100. Multiplying the whole by that fraction gives the part.
Sort out the question
420 vehicles passed the checkpoint. The table gives the percent of vehicles with each number of people. You need how many vehicles had “at least 3” people. At least 3 means 3 or more. So count vehicles with 3 people, 4 people, and 5 or more.
Pick the right rows
Three rows fit: 3 people (15%), 4 people (7%), and 5 or more (3%). Watch out: at least 3 includes 3 itself. Leaving out the 3 row gives 42, choice A. Using only the 3 row gives 63, choice B.
Add the percents first
Adding the percents first saves work. Then you only multiply once.
So 25% of the vehicles had at least 3 people.
Find 25% of 420
Use the percent formula with p = 25 and W = 420.
25% is one quarter, so this is the same as . Watch out: 315 is the number of vehicles with fewer than 3 people, choice D. So the answer is C, 105.
Check your answer
The other rows, 1 and 2 people, make . 75% of 420 is 315. Then , which is all the vehicles. The two groups fit together.
More questions like this
The original DOE question
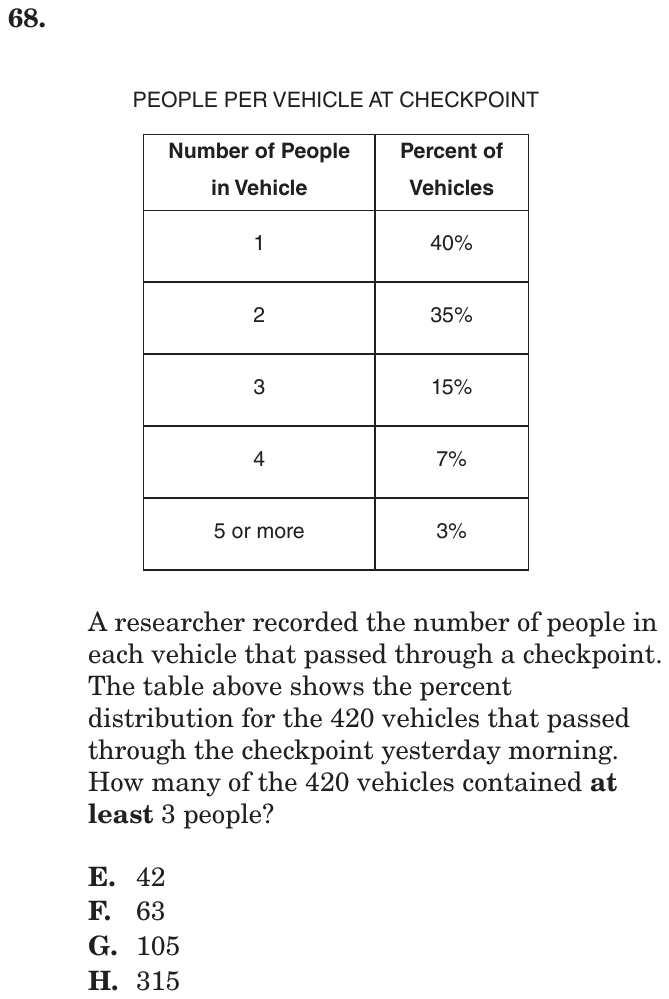
Question 48 of 61
2018 Test A Math, question 16Question
A box of colored pencils contains exactly 6 red pencils. The probability of choosing a red pencil from the box is . How many of the pencils in the box are not red?
- A5
- B15
- C21
- D30
Show the answer
Correct answer: B
Let be the total number of colored pencils in the box. Set up a proportion to find :
If there are 6 red pencils, then the number of pencils that are not red is
21 − 6 = 15.
Question analysis
A probability word problem: a box holds exactly 6 red pencils, and the chance of drawing a red one is 2/7. Students work backward from the probability to the number of pencils in the box, then answer the question actually asked, which is about the pencils that are not red.
- Grade level
- Grade 6 content, by NYS standard
- Compared with grade 7
- At grade 7 Simple probability is grade 6 content in New York. Reversing it to find a total is a step beyond plugging counts into a fraction, which puts this at about the level of typical grade 7 work.
- Estimated difficulty
- Straightforward: two steps or one careful reading.
- Thinking it demands
- Depth of knowledge 2, skills and concepts · mainly apply
- What makes it hard
- Turning words into math moderate
- Something you must already know minor
- Solution
- 2 steps
- Reading level
- Question and choices: about grade 6, 32 words.
- Corrected from the DOE handbook
- A spelling mistake in the explanation was corrected.
- Students, last 30 days
- Not enough answers yet to show (it takes 10).
Why it is hard, traps and wrong answers (shows the answer)
Why it is hard
Students have to treat a probability as a ratio and scale it up: 6 red pencils is three times the 2 in 2/7. The common loss is choosing the total number of pencils, which appears naturally halfway through the work and is a listed choice. Reading the 7 as a pencil count, or scaling by 6 instead of 3, leads to the other wrong answers.
Turning words into math moderate Understanding the question
"The probability of choosing a red pencil from the box is 2/7" has to become a part-to-whole ratio: 2 of every 7 pencils are red, so the 6 red pencils are 2 parts. (Hegarty, Mayer & Monk, 1995; Koedinger & Nathan, 2004)
Something you must already know minor Working it out
The question assumes students know that a probability is favorable outcomes over all outcomes, here used in reverse to find the total from the red count. (Anderson & Krathwohl, 2001)
Strategy: Since 2 parts out of 7 are red, find how many pencils one part stands for, then count the parts that are not red.
Traps
- Stops one step early: A choice is a number from partway through the solution.
The wrong answers, classified
A Numbers taken from the question (Hegarty, Mayer & Monk, 1995)
Reads 2/7 as 2 red pencils among exactly 7 and takes 7 − 2 = 5, ignoring the stated 6 red pencils.
C Stops one step early (King et al., 2004; Gierl et al., 2017)
Solves 2/7 = 6/x to get 21 pencils in all and stops before subtracting the 6 red ones that the bold not excludes.
D A faulty procedure (Brown & Burton, 1978; Tatsuoka, 1983)
Treats the 6 red pencils as one share of the 7 instead of two, so each share is 6 and the 5 non-red shares make 30.
What was corrected from the DOE handbook, and why
- Explanation: The handbook says “the number of pencils that are not read is 21 − 6 = 15”. “read” now reads “red”.
Worked solution, step by step
Formulas used
- Probability
- P is the probability, the chance that something happens. Favorable is the number of ways to get what you want, here a red pencil. Total is the number of all possible picks, here every pencil in the box. It works when every pick is equally likely.
Sort out the question
A probability is a number that tells how likely something is. The box has exactly 6 red pencils. The chance of picking a red one is . You need the number of pencils that are not red.
Read the probability as parts
means 2 out of every 7 pencils are red. Picture the box split into 7 equal parts. Red pencils fill 2 of the parts. The other 5 parts are not red. Watch out: the box does not hold just 7 pencils. It has 6 red ones alone. Taking is choice A.
Find the size of one part
The 6 red pencils fill 2 parts. Divide to find one part.
Each part is 3 pencils. So the whole box has pencils.
Check with the probability formula
Put the counts into the formula to make sure.
Divide the top and bottom of 6/21 by 3 to get 2/7. It matches.
Count the pencils that are not red
That is the same as 5 parts of 3 pencils each. Watch out: 21 is all the pencils, choice C. The question asks only for the ones that are not red. So the answer is B, 15.
Check your answer
Red and not red should make the whole box: . Red is less likely than not red, since 2/7 is less than half. 6 red against 15 not red fits that.
More questions like this
The original DOE question
Question 49 of 61
2018 Test A Math, question 23Question
SCORES ON MATH QUIZ
| Score | Number of Students |
| 85 | 4 |
| 75 | 4 |
| 65 | 2 |
What is the mean score of the 10 students in the table above?
- A22.5
- B75
- C77
- D85
Show the answer
Correct answer: C
For each row, multiply the number of students by the score. Then add those together and divide by the total number of students to find the mean (average) of the 10 students.
Question analysis
This statistics question gives a frequency table of quiz scores: three scores and how many of the 10 students earned each. Students find the mean score of all 10 students. Each score has to count as many times as students earned it, which is easy to overlook when only three scores are listed.
- Grade level
- Grade 6 content, by NYS standard
- Compared with grade 7
- Below grade 7 Computing a mean is grade 6 work, and this weighted version from a table takes two short steps. It is a little easier than typical grade 7 statistics, which compares whole data sets.
- Estimated difficulty
- Straightforward: two steps or one careful reading.
- Thinking it demands
- Depth of knowledge 2, skills and concepts · mainly apply
- What makes it hard
- A very close wrong answer moderate
- Reading a figure, table or graph minor
- Solution
- 2 steps
- Reading level
- Question and choices: about grade 2, 20 words.
- Students, last 30 days
- Not enough answers yet to show (it takes 10).
Why it is hard, traps and wrong answers (shows the answer)
Why it is hard
The procedure is routine once students see that the table lists counts, not separate students. The tempting shortcut is to average the three scores in the first column, which gives a listed choice close to the right one. Multiplying each score by its count, then dividing by 10, takes well under a minute.
A very close wrong answer moderate Choosing the answer
77 and 75 are only 2 points apart, so a rough sense of the middle score cannot choose between them; only weighting each score by its 4, 4 or 2 students does. (Embretson & Wetzel, 1987; Gorin & Embretson, 2006; Ascalon et al., 2007)
Reading a figure, table or graph minor Understanding the question
The table pairs each score with a number of students, so the 10 students are 4, 4 and 2, and each score must be weighted by its count. (Lesh, Post & Behr, 1987; Kirsch & Mosenthal, 1990)
Strategy: Multiply each score by its number of students, add the three products, and divide by the 10 students.
Traps
- Misunderstands the concept: A wrong belief about a concept: that percents can be added, that area grows like length, that averages can be averaged, that a bigger denominator means a bigger fraction.
The wrong answers, classified
A Numbers taken from the question (Hegarty, Mayer & Monk, 1995)
Adds the three scores, 85 + 75 + 65 = 225, and divides by the 10 students, an average lower than every score in the table.
B Misunderstands the concept (Smith, diSessa & Roschelle, 1993; De Bock et al., 1998; Ni & Zhou, 2005)
Averages the three listed scores, (85 + 75 + 65) ÷ 3 = 75, ignoring that 4, 4 and 2 students earned them.
D Numbers taken from the question (Hegarty, Mayer & Monk, 1995)
Picks the top score, which 4 students earned, instead of computing a mean of all 10 scores.
Worked solution, step by step
Formulas used
- Mean (average)
- M is the mean, also called the average. S is the sum, all the values added together. n is how many values there are. Dividing shares the total out equally, so the mean is what each value would be if they were all the same.
Sort out the table
The table lists 3 scores and how many students got each one. 4 students scored 85. 4 students scored 75. 2 students scored 65. That is students. You need the mean, or average, of all 10 scores.
Find the sum of all 10 scores
Each score counts once for every student who got it. So multiply each score by its number of students.
Add the three results.
All 10 scores add up to 770 points.
Divide by the number of students
Watch out: averaging just the three scores gives , choice B. That acts as if only one student got each score. So the answer is C, 77.
Check your answer
More students scored 85 than 65. So the mean should be a little above the middle score, 75. 77 fits. A mean must also be between the lowest and highest scores, 65 and 85. That rules out 22.5.
More questions like this
The original DOE question
Question 50 of 61
2018 Test A Math, question 24Question
How many more people in Center City walk to work than ride their bicycle to work?
- A2,500
- B2,700
- C2,800
- D3,000
Show the answer
Correct answer: B
According to the chart, 22% of people walk to work and 4% ride a bicycle. Subtract to find the percentage of how many more people walk than bicycle:
22% − 4% = 18%
To find the exact number of people, multiply 18% (0.18) by the number of people working in Center City (15,000):
Question analysis
This circle graph question shows how the 15,000 people working in Center City get to work, with 22% walking and 4% riding a bicycle. Students find how many more people walk than bike by combining a percent difference with a percent of a total. The choices are close together, so estimating is risky.
- Grade level
- Grade 6 content, by NYS standard
- Compared with grade 7
- Below grade 7 Reading a circle graph and taking a percent of a total are grade 6 skills. With only two short steps and friendly numbers, this is easier than typical grade 7 multistep percent work.
- Estimated difficulty
- Straightforward: two steps or one careful reading.
- Thinking it demands
- Depth of knowledge 2, skills and concepts · mainly apply
- What makes it hard
- A very close wrong answer moderate
- Reading a figure, table or graph minor
- Error-prone arithmetic minor
- Solution
- 2 steps
- Reading level
- Question and choices: about grade 7, 16 words.
- Students, last 30 days
- Not enough answers yet to show (it takes 10).
Why it is hard, traps and wrong answers (shows the answer)
Why it is hard
The method is short: subtract the percents first, or find both groups and subtract, and both reach the same number. What makes the question less safe than it looks is the tight spread of choices, all within 500 of each other, so rounding 18% or slipping on one product lands on a wrong answer. Subtracting the percents first leaves one multiplication to get right instead of two.
A very close wrong answer moderate Choosing the answer
2,700 sits only 100 from 2,800 and 300 from 3,000, so estimating 18% of 15,000 as about a fifth cannot pick it; only the exact product does. (Embretson & Wetzel, 1987; Gorin & Embretson, 2006; Ascalon et al., 2007)
Reading a figure, table or graph minor Understanding the question
The Walk 22% and Bicycle 4% labels must be picked out of five sectors, and the 15,000 total sits in a caption below the circle graph. (Lesh, Post & Behr, 1987; Kirsch & Mosenthal, 1990)
Error-prone arithmetic minor Working it out
The percent gap has to become a count, 0.18 × 15,000, a decimal times a five-digit number worked by hand without a calculator. (Brown & Burton, 1978; Junker & Sijtsma, 2001)
Strategy: Subtract the two percents first, then take that single percent of 15,000, instead of finding each group and subtracting.
The wrong answers, classified
A Little reason to choose it (Haladyna & Downing, 1993; Rodriguez, 2005)
No common working gives 2,500, which is 1/6 of 15,000 and matches no sector or difference of sectors; it mostly catches estimates.
C An arithmetic slip (Junker & Sijtsma, 2001)
Takes 4% of 15,000 as 500 instead of 600 and subtracts it from the 3,300 walkers, getting 2,800.
D Rounds too early (King et al., 2004)
Rounds the 18-point gap up to 20% to make the multiplication easy and takes 20% of 15,000, which is 3,000.
Worked solution, step by step
Formulas used
- Percent of a number
- W is the whole amount. p is the percent, and x is the part you want. Percent means out of 100, so p percent is the fraction p over 100. Multiplying the whole by that fraction gives the part.
Sort out the circle graph
A circle graph shows how a whole splits into parts. This one shows how 15,000 workers get to work. Walk is 22%. Bicycle is 4%. You need how many more people walk than ride a bicycle.
Subtract the percents first
Both percents are parts of the same 15,000 people. So you can subtract the percents first. Then you only need one multiplication.
The difference is 18% of all the workers.
Find 18% of 15,000
First find 1% by dividing by 100. Then multiply by 18.
That is 2,700 people.
Avoid rounding and answer
Watch out: don’t round 18% up to 20% to make it easy. 20% of 15,000 is 3,000, choice D. The choices are close together, so you need the exact number. So the answer is B, 2,700.
Check your answer
Find each group, then subtract. Walkers: 22% of 15,000 is 3,300. Bike riders: 4% of 15,000 is 600. . You get the same answer.
More questions like this
The original DOE question
Question 51 of 61
2018 Test A Math, question 41Question
The graph above shows the number of schools per city for five small cities. Cities M and N each have 500 students per school. City P has 400 students per school. Cities Q and R each have 700 students per school. Which of the five cities has the greatest number of students?
- ACity M
- BCity P
- CCity Q
- DCity R
Show the answer
Correct answer: C
Take each city’s number of schools and multiply by the number of students. It is not necessary to calculate all 5 of these.
Cities M and N have the same number of students per school, so just calculate the number of students in City M because it has more schools than City N.
The same goes for Q and R — only Q needs to be calculated because it has more schools than R.
M= 8 × 500 = 4,000
P = 9 × 400 = 3,600
Q = 6 × 700 = 4,200
City Q has the greatest number of students.
Question analysis
This graph question shows the number of schools in each of five small cities and gives the number of students per school for each city. Students multiply schools by students per school to compare the total number of students. Comparing only the bars, or only the rates, can mislead.
- Grade level
- Grade 6 content, by NYS standard
- Compared with grade 7
- Below grade 7 Reading a bar graph and multiplying is familiar from grade 6. Grade 7 data tasks often add percents or compare distributions; this one needs only a few whole-number products, so it is easier than typical grade 7 work.
- Estimated difficulty
- Straightforward: two steps or one careful reading.
- Thinking it demands
- Depth of knowledge 2, skills and concepts · mainly apply
- What makes it hard
- A very close wrong answer moderate
- Much to keep track of minor
- Reading a figure, table or graph minor
- Solution
- 3 steps
- Reading level
- Question and choices: about grade 2, 57 words.
- Corrected from the DOE handbook
- A misstatement in the explanation was corrected.
- Students, last 30 days
- Not enough answers yet to show (it takes 10).
Why it is hard, traps and wrong answers (shows the answer)
Why it is hard
Neither the tallest bar nor the highest rate wins, which is the point of the question: total students depend on both. The explanation's shortcut, comparing only M, P and Q because N and R each share a rate with a taller bar, cuts the work to three products. The top two totals are close, so the products must actually be computed rather than estimated.
A very close wrong answer moderate Choosing the answer
City M's 4,000 students and City Q's 4,200 differ by only 200, so judging from bar heights and rates cannot separate them; only computing 8 × 500 and 6 × 700 does. (Embretson & Wetzel, 1987; Gorin & Embretson, 2006; Ascalon et al., 2007)
Much to keep track of minor Working it out
The rates come in three groups in the stem, 500 for M and N, 400 for P, 700 for Q and R, and each must be matched to its bar. (Sweller, 1988; Carpenter, Just & Shell, 1990)
Reading a figure, table or graph minor Understanding the question
The number of schools comes only from the bar heights, read against gridlines from 0 to 10; all five bars end exactly on a gridline. (Lesh, Post & Behr, 1987; Kirsch & Mosenthal, 1990)
Strategy: For each city, multiply the number of schools read from the graph by its students per school and compare the products; cities that share a rate need only their school counts compared.
Traps
- Stops one step early: A choice is a number from partway through the solution.
- Answers a different question: A choice is right for another quantity: the other unknown, the rest instead of the part, the part instead of the whole.
The wrong answers, classified
A Stops one step early (King et al., 2004; Gierl et al., 2017)
Computes M's 8 × 500 = 4,000 and P's 9 × 400 = 3,600 and stops, never working out Q's 6 × 700 = 4,200.
B Answers a different question (King et al., 2004; Hegarty, Mayer & Monk, 1995)
Picks the tallest bar, P's nine schools, which answers which city has the most schools rather than the most students.
D Numbers taken from the question (Hegarty, Mayer & Monk, 1995)
Picks a city with the stem's highest rate, 700 students per school, without noticing that R has only 4 schools to Q's 6.
What was corrected from the DOE handbook, and why
- Explanation: The handbook says “Cities M and N have the same number of students”. They have the same number of students per school (500), not the same total: M has 8 × 500 = 4,000 and N has 5 × 500 = 2,500, which is why only City M, with more schools, needs to be calculated. The sentence now says “the same number of students per school”.
Worked solution, step by step
Formulas used
- Total students in a city
- S is the total number of students in a city. n is the number of schools, read from the bar. s is the number of students in each school. You multiply because every school in that city has the same number of students.
Read the graph
The bar graph shows how many schools each city has. Read the top of each bar against the numbers on the left. M has 8, N has 5, P has 9, Q has 6 and R has 4.
The question gives the students per school. You need the city with the most students in all.
Multiply for each city
Use the formula for each city:
City Schools Students per school Total students M 8 500 4,000 N 5 500 2,500 P 9 400 3,600 Q 6 700 4,200 R 4 700 2,800 Compare the totals
The biggest total is 4,200, for City Q.
Watch out: City P has the tallest bar, but that means the most schools, not the most students. That leads to choice B. City M’s 4,000 is close, so do not stop before you work out Q. That is choice A.
So the answer is C, City Q.
Check your answer
A shortcut: M and N both have 500 per school, and M has more schools, so M beats N. Q and R both have 700, and Q beats R. So only M, P and Q matter: 4,000, 3,600 and 4,200. Q still wins.
More questions like this
The original DOE question
Question 52 of 61
2018 Test A Math, question 46Question
SCORES ON BIOLOGY TEST
| Section | Lowest Score | Range |
| I | 65 | 28 |
| II | 62 | 25 |
| III | 67 | 22 |
Mr. Blake’s biology class is divided into three sections. The same test was given to each section. The table above shows both the lowest score and the range of scores on this test for each section. What is the overall range of all scores in all three sections?
- A25
- B27
- C28
- D31
Show the answer
Correct answer: D
First, calculate the highest score for each section by adding the lowest score to the range:
Section I: 65 + 28 = 93
Section II: 62 + 25 = 87
Section III: 67 + 22 = 89
The overall highest score is 93, and the overall lowest score is 62. Thus the overall range is 93 − 62 = 31.
Question analysis
This statistics question uses a table of the lowest score and the range for three sections of a biology class and asks for the range of all the scores combined. Students must rebuild each section's highest score from its lowest score and range, then compare across sections. Reversing the usual range calculation is the tricky part.
- Grade level
- Grade 6 content, by NYS standard
- Compared with grade 7
- At grade 7 Grade 7 students compute a range from a list of data. Here they must work backward from range to the highest score in each section and then combine three groups, one step beyond routine.
- Estimated difficulty
- Moderate: several steps, or a close reading with one strong distractor.
- Thinking it demands
- Depth of knowledge 2, skills and concepts · mainly apply
- What makes it hard
- No obvious method moderate
- A very close wrong answer moderate
- Much to keep track of minor
- Solution
- 3 steps
- Reading level
- Question and choices: about grade 2, 59 words.
- Students, last 30 days
- Not enough answers yet to show (it takes 10).
Why it is hard, traps and wrong answers (shows the answer)
Why it is hard
Range is usually computed from a list, so working backward from it is the unfamiliar part. The key fact, that the overall lowest and highest scores come from different sections, is invisible until all three highest scores are written down. Every wrong choice comes from skipping that step and reasoning with the ranges as given.
No obvious method moderate Working it out
The table gives each section's lowest score and range but no highest score, so students must reverse the range formula, high = low + range, before comparing sections. (Schoenfeld, 1985)
A very close wrong answer moderate Choosing the answer
The choices 28 and 27 sit within 4 of 31, so a sense of the spread cannot separate them; only rebuilding the highest scores, which puts the top at 93, does. (Embretson & Wetzel, 1987; Gorin & Embretson, 2006; Ascalon et al., 2007)
Much to keep track of minor Working it out
The overall lowest, 62, comes from Section II and the overall highest, 93, from Section I, so values from two rows must be combined. (Sweller, 1988; Carpenter, Just & Shell, 1990)
Strategy: Add each section's range to its lowest score to get its highest score, then subtract the lowest of all scores from the highest of all scores.
Traps
- Answers a different question: A choice is right for another quantity: the other unknown, the rest instead of the part, the part instead of the whole.
The wrong answers, classified
A Misunderstands the concept (Smith, diSessa & Roschelle, 1993; De Bock et al., 1998; Ni & Zhou, 2005)
Averages the three section ranges, (28 + 25 + 22) ÷ 3 = 25, as if the overall range were a typical section's range.
B Answers a different question (King et al., 2004; Hegarty, Mayer & Monk, 1995)
Leaves Section I out, taking the top score as Section III's 67 + 22 = 89, which gives the range of Sections II and III only.
C Answers a different question (King et al., 2004; Hegarty, Mayer & Monk, 1995)
Takes Section I's range, 28, the largest in the table, giving one section's spread instead of the spread across all three.
Worked solution, step by step
Formulas used
- Range
- R is the range, the spread of the scores. H is the highest score and L is the lowest score. The range tells how far apart the top and bottom scores are. If you know L and R, then H = L + R.
Sort out what you know
The table gives each section’s lowest score and its range. The range is the highest score minus the lowest score.
The bold overall means one range for all three sections together. For that you need the highest and lowest scores of all.
Find each section’s highest score
Turn the range formula around: highest = lowest + range.
Section Lowest Range Highest I 65 28 65 + 28 = 93 II 62 25 62 + 25 = 87 III 67 22 67 + 22 = 89 Pick the overall highest and lowest
The highest score of all is 93, from Section I. The lowest score of all is 62, from Section II. They come from different sections, and that is fine.
Subtract to find the range
Watch out: 28 is just Section I’s range, choice C. Averaging the three ranges gives 25, choice A. Neither covers all the scores at once.
So the answer is D, 31.
Check your answer
The overall range must be at least as big as each section’s range, because it covers all their scores. 31 is bigger than 28, 25 and 22, so it is reasonable. Also, 62 + 31 = 93, the top score.
More questions like this
The original DOE question
Question 53 of 61
2018 Test A Math, question 51Question
A sports store has a container of handballs: 4 blue, 5 red, 8 yellow, 9 white, and 11 green. If one ball is picked from the container at random, what is the probability that it will be yellow?
- A
- B
- C
- D
Show the answer
Correct answer: C
The total number of handballs in the container is
Since there are 8 yellow handballs, the probability of selecting a yellow handball is
Question analysis
This probability question describes a container of handballs in five colors and asks the chance that one ball picked at random is yellow. Students must add all the balls to get the total and compare the yellow count to it. Using the wrong total, such as only the balls that are not yellow, is the easy mistake.
- NYS standards
- 6.SP.8a uniform probability models
- Grade level
- Grade 6 content, by NYS standard
- Compared with grade 7
- Below grade 7 Finding the probability of a single event as favorable outcomes over total outcomes is grade 6 content. This item takes one addition and one fraction, so it is easier than typical grade 7 compound probability work.
- Estimated difficulty
- Routine: one familiar step, little to misread.
- Thinking it demands
- Depth of knowledge 2, skills and concepts · mainly apply
- What makes it hard
- Solution
- 2 steps
- Reading level
- Question and choices: about grade 5, 37 words.
- Students, last 30 days
- Not enough answers yet to show (it takes 10).
Why it is hard, traps and wrong answers (shows the answer)
Why it is hard
This is a one-event probability: add the five colors to get 37 balls and put the 8 yellow ones over that total. The only real decision is the denominator, and the wrong choices offer the non-yellow count, the yellow count, and a numerator of 1. Students who say "favorable over total" to themselves avoid all three.
A very close wrong answer minor Choosing the answer
The choices 8/37 and 8/29 share the numerator 8 and differ only in the denominator, all 37 balls against the 29 that are not yellow. (Embretson & Wetzel, 1987; Gorin & Embretson, 2006; Ascalon et al., 2007)
Strategy: Add up every ball in the container to get the total number of outcomes, then put the number of yellow balls over that total.
Traps
- Misunderstands the concept: A wrong belief about a concept: that percents can be added, that area grows like length, that averages can be averaged, that a bigger denominator means a bigger fraction.
- Answers a different question: A choice is right for another quantity: the other unknown, the rest instead of the part, the part instead of the whole.
The wrong answers, classified
A Answers a different question (King et al., 2004; Hegarty, Mayer & Monk, 1995)
Finds the 37 balls correctly but puts 1 on top, giving the chance of picking one particular ball rather than any yellow one.
B Numbers taken from the question (Hegarty, Mayer & Monk, 1995)
Puts 1 over the 8 yellow balls, a fraction built from the yellow count alone that ignores the other 29 balls.
D Misunderstands the concept (Smith, diSessa & Roschelle, 1993; De Bock et al., 1998; Ni & Zhou, 2005)
Compares the 8 yellow balls with the 29 that are not yellow, a part-to-part ratio, instead of with all 37 balls.
Worked solution, step by step
Formulas used
- Probability
- P is the probability, the chance that something happens. f is the number of favorable outcomes, the ones you want. t is the total number of outcomes. It works when every outcome is equally likely, like picking one item at random.
Sort out what you know
The container has 4 blue, 5 red, 8 yellow, 9 white and 11 green balls. One ball is picked at random, so every ball has the same chance. You need the chance it is yellow.
Count all the balls
Add up every color, because any ball could be picked:
There are 37 balls in all. That is the total number of outcomes.
Put yellow over the total
8 of the balls are yellow. Those are the favorable outcomes:
Watch out: compares yellow with the 29 balls that are not yellow. Probability compares the part with all the balls, so choice D is wrong. So the answer is C, .
Check your answer
8 out of 37 is about 0.22, a little more than 1 in 5. That makes sense, since yellow is a fair share of the balls. Choice A, 1/37, is the chance of picking one certain ball, not any yellow one.
More questions like this
The original DOE question
Question 54 of 61
2018 Test A Math, question 56Question
SERVINGS OF FRUITS AND VEGETABLES
| Number of Servings of Fruits and Vegetables | Number of Students |
| 0 | 5 |
| 1 | 7 |
| 2 | 3 |
| 3 | 4 |
| 4 | 0 |
| 5 | 1 |
There are 20 students in a class. The frequency table above shows the number of students in this class who ate 0, 1, 2, 3, 4, or 5 servings of fruits and vegetables yesterday. What is the mean number of servings of fruits and vegetables eaten yesterday per student in this class?
- A
- B
- C
- D
Show the answer
Correct answer: A
First, determine the total number of servings of fruits and vegetables that the students ate by multiplying the number of servings by the number of students in each row of the table.
Then add that column to get the total number of servings:
| Number of Servings of Fruits and Vegetables | Number of Students | Number of Servings × Number of Students |
| 0 | 5 | 0 |
| 1 | 7 | 7 |
| 2 | 3 | 6 |
| 3 | 4 | 12 |
| 4 | 0 | 0 |
| 5 | 1 | 5 |
Total: 30
Calculate the mean by dividing the total number of servings of fruits and vegetables by the total number of students:
Question analysis
This statistics question uses a frequency table showing how many of 20 students ate 0, 1, 2, 3, 4 or 5 servings of fruits and vegetables, and asks for the mean servings per student. Students must weight each serving amount by its number of students, add, and divide. Averaging the wrong column of the table is the common mistake.
- NYS standards
- 6.SP.5c range, center, and overall pattern
- Grade level
- Grade 6 content, by NYS standard
- Compared with grade 7
- At grade 7 Finding a mean is grade 6 content; doing it from a frequency table, where each value must be weighted by its count, is the multi-step version grade 7 students meet regularly.
- Estimated difficulty
- Moderate: several steps, or a close reading with one strong distractor.
- Thinking it demands
- Depth of knowledge 2, skills and concepts · mainly apply
- What makes it hard
- Reading a figure, table or graph moderate
- Many steps minor
- Solution
- 3 steps
- Reading level
- Question and choices: about grade 7, 64 words.
- Students, last 30 days
- Not enough answers yet to show (it takes 10).
Why it is hard, traps and wrong answers (shows the answer)
Why it is hard
The answer is smaller than every wrong choice, which surprises students who average the table's columns directly. The question rewards seeing that each row stands for several students, so the total servings come from weighting each value by its count. The stem's reminder that there are 20 students points to the right divisor.
Reading a figure, table or graph moderate Understanding the question
The frequency table has a value column and a count column; the mean needs each value multiplied by its count, so the two columns play different roles. (Lesh, Post & Behr, 1987; Kirsch & Mosenthal, 1990)
Many steps minor Working it out
Six products, 0, 7, 6, 12, 0 and 5, must be found and added to 30 before dividing by the 20 students. (Daniel & Embretson, 2010; Enright, Morley & Sheehan, 2002)
Strategy: Multiply each serving amount by its number of students, add those products to get the total servings, then divide by the 20 students.
Traps
- Answers a different question: A choice is right for another quantity: the other unknown, the rest instead of the part, the part instead of the whole.
The wrong answers, classified
B Misunderstands the concept (Smith, diSessa & Roschelle, 1993; De Bock et al., 1998; Ni & Zhou, 2005)
Averages the serving amounts 1 through 5 listed in the table, (1 + 2 + 3 + 4 + 5) ÷ 5 = 3, without weighting by the students.
C Answers a different question (King et al., 2004; Hegarty, Mayer & Monk, 1995)
Averages the Number of Students column, 20 students over 6 rows, finding the mean count per row instead of the servings per student.
D Numbers taken from the question (Hegarty, Mayer & Monk, 1995)
Divides the 20 students by 5, the largest serving amount, combining two numbers from the page without a model of the mean.
Worked solution, step by step
Formulas used
- Mean
- m is the mean, or average. S is the sum of all the values, here the total servings eaten. n is the number of values, here the number of students. The mean shares the total equally, as if every student ate the same amount.
Sort out the table
This is a frequency table. Each row says how many students ate a certain number of servings. For example, the second row says 7 students ate 1 serving each.
There are 20 students. You need the mean, or average, number of servings per student.
Find the servings in each row
In each row, multiply the servings by the number of students:
Servings Students Servings × Students 0 5 0 1 7 7 2 3 6 3 4 12 4 0 0 5 1 5 Add up all the servings
The class ate 30 servings in all. The students add up to 20, as the question says: 5 + 7 + 3 + 4 + 0 + 1 = 20.
Divide by the number of students
Watch out: do not just average the serving numbers 1 to 5. That gives 3, choice B, and ignores how many students ate each amount. Dividing 20 students by 6 rows gives choice C.
So the answer is A, .
Check your answer
12 of the 20 students ate 0 or 1 serving. Only 5 ate 3 or more. So the mean should be small, between 1 and 2. fits. Choices B, C and D are all 3 or more, which is too big.
More questions like this
The original DOE question
Question 55 of 61
2018 Test B Math, question 13Question
DESSERT CHOICES
| Dessert | Number of Times Ordered |
| Cookies | 42 |
| Pie | 23 |
| Cake | 47 |
| Ice Cream | 48 |
The table above shows the number of times that different desserts were ordered at a restaurant. Based on this information, what is the probability of a customer ordering ice cream as a dessert?
- A25%
- B30%
- C40%
- D48%
Show the answer
Correct answer: B
The total number of desserts ordered is
42 + 23 + 47 + 48 = 160
The probability that ice cream was chosen is
.
Question analysis
This probability question gives a table of how many times four desserts were ordered at a restaurant and asks how likely a customer is to order ice cream, as a percent. Students total the orders and divide. The trap is using a raw count, or the wrong total, in place of the full number of desserts ordered.
- Grade level
- Grade 6 content, by NYS standard
- Compared with grade 7
- Below grade 7 Finding a probability from observed frequencies is grade 6 content in New York. Here it takes one sum, one division and a conversion to a percent with friendly numbers, lighter than typical grade 7 work.
- Estimated difficulty
- Routine: one familiar step, little to misread.
- Thinking it demands
- Depth of knowledge 1, recall and reproduction · mainly apply
- What makes it hard
- Solution
- 3 steps
- Reading level
- Question and choices: about grade 5, 45 words.
- Students, last 30 days
- Not enough answers yet to show (it takes 10).
Why it is hard, traps and wrong answers (shows the answer)
Why it is hard
This is a direct relative-frequency question with friendly numbers, and most students finish it quickly. The risk is using a number from the table as if it were already a percent, or treating the four desserts as equally likely. Remembering that a probability compares one count with the total of all counts prevents both mistakes.
Reading a figure, table or graph minor Understanding the question
The four counts sit in a table, and the probability needs all of them: the ice cream row gives the numerator and the sum of the column gives the denominator. (Lesh, Post & Behr, 1987; Kirsch & Mosenthal, 1990)
Error-prone arithmetic minor Working it out
Adding 42 + 23 + 47 + 48 by hand and then simplifying 48/160 to 3/10 are small steps where a careless total spoils the percent. (Brown & Burton, 1978; Junker & Sijtsma, 2001)
Strategy: Add the four counts in the table to get all the orders, divide the ice cream count by that total, and convert the fraction to a percent.
Traps
- Answers a different question: A choice is right for another quantity: the other unknown, the rest instead of the part, the part instead of the whole.
The wrong answers, classified
A Misunderstands the concept (Smith, diSessa & Roschelle, 1993; De Bock et al., 1998; Ni & Zhou, 2005)
Treats the four desserts as equally likely, one chance in four, ignoring how often each was actually ordered.
C Answers a different question (King et al., 2004; Hegarty, Mayer & Monk, 1995)
Divides 48 by the 112 orders of the other desserts instead of all 160, getting about 43%, and takes the nearest choice.
D Numbers taken from the question (Hegarty, Mayer & Monk, 1995)
Reads the 48 ice cream orders as 48 percent without dividing by the total number of desserts ordered.
Worked solution, step by step
Formulas used
- Probability
- P is the probability, the chance that something happens. The top counts the outcomes you want, here ice cream orders. The bottom counts every outcome, here all dessert orders. It works because each order counts the same.
- Fraction to percent
- Percent means out of 100. Multiply a fraction or a decimal by 100 to write it as a percent. For example, 3/10 times 100 is 30, so 3/10 is 30%.
Sort out the table
The table shows how many times each dessert was ordered. Ice cream was ordered 48 times.
You need the chance that a customer orders ice cream. The orders in the table show how often each dessert is picked.
Find the total orders
Add all four rows of the table.
There were 160 dessert orders in all. This is the bottom of the fraction, because it counts every order.
Write the probability
Put the counts into the probability formula. The top is the 48 ice cream orders. The bottom is all 160 orders.
Simplify the fraction. Both numbers can be divided by 16.
Change to a percent
The probability is 30%.
Watch out: 48 orders is not 48%, choice D. You must divide by the total. Also, the four desserts are not equally popular. So the chance is not 1 out of 4, or 25%, choice A.
So the answer is B, 30%.
Check your answer
Work backward: . That matches the ice cream row. Also, 48 is a bit less than a third of 160, and 30% is a bit less than a third.
More questions like this
The original DOE question
Question 56 of 61
2018 Test B Math, question 16Question
A cooler contains three types of beverages: 5 bottles of apple juice, 3 bottles of grape juice, and 6 bottles of orange juice. What is the probability that a bottle chosen at random from this cooler is not apple juice?
- A
- B
- C
- D
Show the answer
Correct answer: C
The total number of bottles of juice in the cooler is
5 + 3 + 6 = 14
The number of bottles of juice that are not apple juice (grape juice and orange juice) is
3 + 6 = 9
So the probability is .
Question analysis
This probability question describes a cooler holding apple, grape and orange juice bottles in different numbers and asks for the chance that a randomly chosen bottle is not apple juice. Students count favorable bottles over all bottles. The word not is the trap, along with counting kinds of drink instead of bottles.
- NYS standards
- 6.SP.8a uniform probability models
- Grade level
- Grade 6 content, by NYS standard
- Compared with grade 7
- Below grade 7 Simple probability with equally likely outcomes is grade 6 content in New York. This needs one count and one fraction, and the only extra demand is reading the word not, so it sits below grade 7.
- Estimated difficulty
- Straightforward: two steps or one careful reading.
- Thinking it demands
- Depth of knowledge 1, recall and reproduction · mainly apply
- What makes it hard
- Turning words into math minor
- Solution
- 2 steps
- Reading level
- Question and choices: about grade 6, 41 words.
- Students, last 30 days
- Not enough answers yet to show (it takes 10).
Why it is hard, traps and wrong answers (shows the answer)
Why it is hard
The counting is easy, 14 bottles in all, so the question mainly tests careful reading. The word “not” turns the event around, and the probability of the opposite event is waiting among the choices. The other wrong choices catch students who count kinds of juice instead of bottles, or who build a fraction with the wrong total.
Turning words into math minor Understanding the question
The event “not apple juice” must be turned into grape plus orange, 3 + 6 bottles over all 14, so the word “not” decides which counts go in the numerator. (Hegarty, Mayer & Monk, 1995; Koedinger & Nathan, 2004)
Strategy: Add all the bottles for the denominator, then count only the grape and orange bottles for the numerator, or subtract the chance of apple juice from 1.
Traps
- Misreads the question: Misses or misreads a condition or a word in the question: "at least", "each", "remaining", "not".
The wrong answers, classified
A Numbers taken from the question (Hegarty, Mayer & Monk, 1995)
Puts 1 over the 9 bottles that are not apple juice, as if one particular bottle had to be picked.
B Misreads the question (Hegarty, Mayer & Monk, 1995)
Finds the probability of choosing apple juice, 5 out of 14, missing the word “not” in the question.
D Misunderstands the concept (Smith, diSessa & Roschelle, 1993; De Bock et al., 1998; Ni & Zhou, 2005)
Counts two of the three kinds of juice as not apple and treats the kinds as equally likely, ignoring how many bottles each has.
Worked solution, step by step
Formulas used
- Probability
- P is the probability, the chance that something happens. The top counts the outcomes you want, here bottles that are not apple. The bottom counts all outcomes, here every bottle. It works when every bottle has the same chance.
- Probability of “not”
- A is an event, such as picking apple juice. P(A) is its chance. Every bottle either is apple or is not, so the two chances add to 1. Subtract from 1 to get the chance that A does not happen.
Sort out the question
The cooler has 5 apple, 3 grape and 6 orange bottles. One bottle is picked at random. That means every bottle has the same chance.
You need the chance that it is not apple juice.
Count all the bottles
There are 14 bottles. This is the bottom of the probability fraction, since any of them could be picked.
Count the bottles that are not apple
The bottles that are not apple are the grape and orange ones.
There are 9 such bottles. This is the top of the fraction.
Write the probability
This fraction cannot be simplified. 9 and 14 share no factor except 1.
Watch out: is the chance of picking apple juice. That is choice B. Read the word “not” carefully.
So the answer is C, .
Check your answer
Use the “not” rule. The chance of apple is . So the chance of not apple is . Both ways give the same answer.
More questions like this
The original DOE question
Question 57 of 61
2018 Test B Math, question 25Question
Jack scored a mean of 15 points per game in his first 3 basketball games. In his 4th game, he scored 27 points. What is his mean score for the first 4 games?
- A15
- B17
- C18
- D21
Show the answer
Correct answer: C
Jack scored a mean of 15 points per game in each of the first 3 games, so he earned a total of 45 points for the first 3 games. Use that information to calculate the mean over the four games:
Question analysis
This statistics question gives Jack's mean score for his first three basketball games and his score in the fourth, and asks for his mean over all four games. Students recover a total from a mean, add the new score and divide again. The earlier mean stands for three games, not one, which is easy to forget.
- NYS standards
- 6.SP.5c range, center, and overall pattern
- Grade level
- Grade 6 content, by NYS standard
- Compared with grade 7
- At grade 7 Finding a mean is grade 6 content, but working back from a mean to a total and then updating it is a common grade 7 test item, with a tempting shortcut that gives the wrong value.
- Estimated difficulty
- Moderate: several steps, or a close reading with one strong distractor.
- Thinking it demands
- Depth of knowledge 2, skills and concepts · mainly apply
- What makes it hard
- Turning words into math moderate
- Something you must already know minor
- Solution
- 3 steps
- Reading level
- Question and choices: about grade 1, 29 words.
- Students, last 30 days
- Not enough answers yet to show (it takes 10).
Why it is hard, traps and wrong answers (shows the answer)
Why it is hard
The tempting shortcut, averaging 15 and 27, is quick, feels reasonable and gives a choice, so the question rewards students who slow down. Its error is weighting: the 15 stands for three games and the 27 for one. Rebuilding the total from the mean and dividing by four games takes only a moment longer.
Turning words into math moderate Understanding the question
The phrase “a mean of 15 points per game in his first 3 games” has to be turned into a total, 45 points, before the fourth game's 27 can be added. (Hegarty, Mayer & Monk, 1995; Koedinger & Nathan, 2004)
Something you must already know minor Working it out
Students must know that a mean is a total divided by a count, so a mean cannot be averaged with a single score as if both had equal weight. (Anderson & Krathwohl, 2001)
Strategy: Multiply the first mean by 3 to get the points so far, add the fourth game's points, and divide the new total by 4.
Traps
- Misunderstands the concept: A wrong belief about a concept: that percents can be added, that area grows like length, that averages can be averaged, that a bigger denominator means a bigger fraction.
The wrong answers, classified
A Numbers taken from the question (Hegarty, Mayer & Monk, 1995)
Gives back the first mean, 15, as if one high-scoring game could not change the average.
B Little reason to choose it (Haladyna & Downing, 1993; Rodriguez, 2005)
No standard computation gives 17; it lies between the old mean and the right one, so it mostly draws students who estimate.
D Misunderstands the concept (Smith, diSessa & Roschelle, 1993; De Bock et al., 1998; Ni & Zhou, 2005)
Averages the old mean and the new score, (15 + 27) ÷ 2, giving one game the same weight as the first three together.
Worked solution, step by step
Formulas used
- Mean (average)
- The mean is the average. Add all the values, here the points in each game. Then divide by how many values there are, here the number of games. Turned around, it also says: sum = mean × number of values.
Write down what you know
Jack’s mean for his first 3 games was 15 points. The mean is the average: the total shared out equally among the games.
In game 4 he scored 27 points. You need his mean for all 4 games.
Find the total for 3 games
A mean of 15 over 3 games means the total is 3 times 15. You need the total, because a new mean is built from the total.
He scored 45 points in the first 3 games.
Add the fourth game
Now add the 27 points from game 4 to get the total for all 4 games.
He scored 72 points in 4 games.
Divide by 4 games
Watch out: Do not average 15 and 27. That gives 21, choice D. It treats one game as if it counted as much as three.
So the answer is C, 18.
Check your answer
The mean should go up a little, since 27 is above 15. It went from 15 to 18, so that makes sense. Also, , which matches the total points.
More questions like this
The original DOE question
Question 58 of 61
2018 Test B Math, question 32Question
PET SURVEY
| Number of Pets | Number of Students |
| 0 | 12 |
| 1 | 16 |
| 2 | 7 |
| 3 or more | 5 |
Amy surveyed students at her school about the number of pets they have. What is the probability that a student who participated in the survey has at least 2 pets?
- A
- B
- C
- D
Show the answer
Correct answer: D
First, add the number of students for each category to find out how many total students were in the survey:
12 + 16 + 7 + 5 = 40
The number of students who had at least 2 pets are the ones who have 2 pets (7) plus the ones who have 3 or more (5). The total number of students with at least 2 pets is
7 + 5 = 12
The probability of a student in the survey having at least two pets is:
Question analysis
Amy's pet survey table shows how many pets each student has, and the question asks for the probability that a randomly chosen student has at least 2 pets. It tests finding a probability from survey data. The tricky part is reading "at least 2" correctly and using the right total as the denominator.
- Grade level
- Grade 6 content, by NYS standard
- Compared with grade 7
- Below grade 7 Simple probability from a frequency table is grade 6 work in New York. The only extra demand is interpreting "at least" and adding a column, two short steps a grade 7 student should handle easily.
- Estimated difficulty
- Straightforward: two steps or one careful reading.
- Thinking it demands
- Depth of knowledge 2, skills and concepts · mainly apply
- What makes it hard
- Solution
- 3 steps
- Reading level
- Question and choices: about grade 5, 43 words.
- Students, last 30 days
- Not enough answers yet to show (it takes 10).
Why it is hard, traps and wrong answers (shows the answer)
Why it is hard
The arithmetic is light, so the question is decided by the phrase "at least 2" and by remembering that the denominator is everyone surveyed. Students who include only one of the two qualifying rows reach an answer with the right denominator, which makes the mistake hard to notice. Rereading the condition before choosing is the main safeguard.
Turning words into math minor Understanding the question
"At least 2 pets" has to be turned into two rows of the table, the 2-pet row and the 3-or-more row, not one. (Hegarty, Mayer & Monk, 1995; Koedinger & Nathan, 2004)
Reading a figure, table or graph minor Understanding the question
The denominator is not printed anywhere; it has to be built by adding all four rows of the table, 12 + 16 + 7 + 5 = 40. (Lesh, Post & Behr, 1987; Kirsch & Mosenthal, 1990)
Strategy: Total the students in every row to get the denominator, then add the counts for each row that satisfies "at least 2" and simplify the fraction.
Traps
- Misreads the question: Misses or misreads a condition or a word in the question: "at least", "each", "remaining", "not".
The wrong answers, classified
A Misreads the question (Hegarty, Mayer & Monk, 1995)
Reads "at least 2 pets" as exactly 2, counting only the 7 students in that row and leaving out the 5 with 3 or more.
B Numbers taken from the question (Hegarty, Mayer & Monk, 1995)
Writes 1 over 12, apparently from the 12 qualifying students or the 12 in the 0-pet row, with no total in the denominator.
C Misreads the question (Hegarty, Mayer & Monk, 1995)
Reads "at least 2" as more than 2, counting only the 5 students with 3 or more pets: 5/40 = 1/8.
Worked solution, step by step
Formulas used
- Probability
- P is the probability, the chance that something happens. The top counts the results you want. The bottom counts every possible result. Use it when each result is equally likely, like picking one at random.
Sort out the question
The table shows how many students have each number of pets. You pick one student who took the survey. You need the chance that the student has “at least 2 pets”.
At least 2 means 2 or more. So two rows count: the 2 pets row and the 3 or more row.
Find the total number of students
The bottom of the fraction is everyone in the survey. Add all four rows.
There are 40 students in all.
Count the students you want
Add the 2 pets row and the 3 or more row.
So 12 students have at least 2 pets.
Watch out: using only the 7 students with exactly 2 pets gives , choice A. Using only the 5 with 3 or more gives , choice C.
Write and simplify the probability
Use the probability formula.
Divide the top and bottom by 4, since 4 goes into both.
So the answer is D, .
Check your answer
The students with fewer than 2 pets are . Then , so every student is counted once. Also, 12 out of 40 is a bit less than a third. So is .
More questions like this
The original DOE question
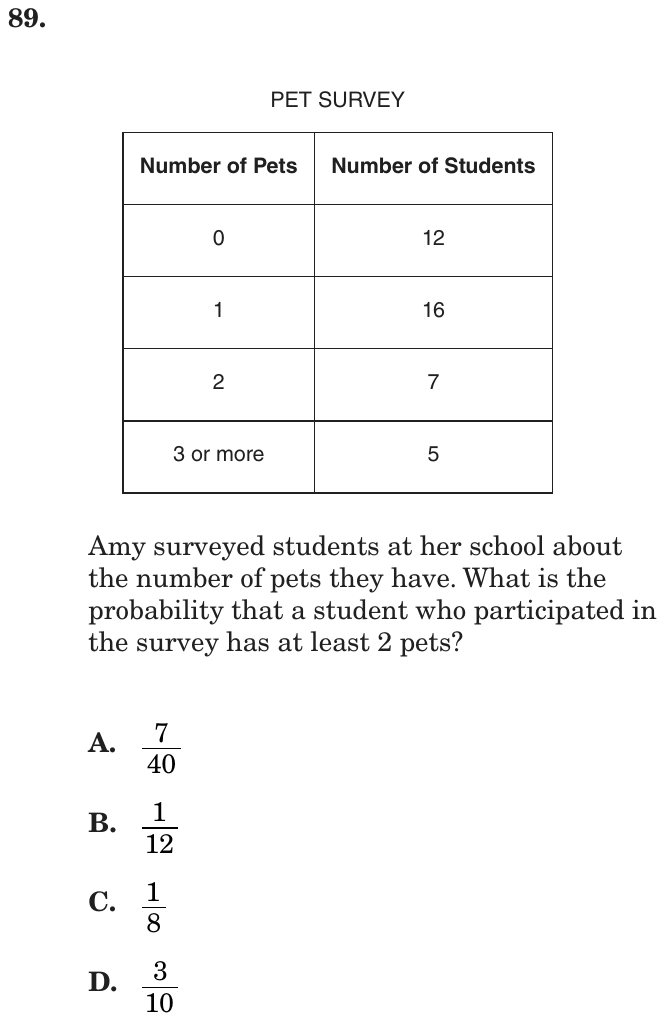
Question 59 of 61
2018 Test B Math, question 49Question
ANIMAL CARDS
| Number of Cards | Picture on Card |
| 8 | cat |
| 6 | dog |
| 5 | bird |
| 4 | fish |
| 1 | horse |
The cards in the table above are mixed in a box. Which animal pictured on a card has exactly a 1 in 4 chance of being picked at random from the box?
- Acat
- Bdog
- Cfish
- Dhorse
Show the answer
Correct answer: B
The total number of cards in the box is
8 + 6 + 5 + 4 + 1 = 24
Set up a proportion to figure out which card has exactly a 1 in 4 chance of being picked at random.
The dog card has a 1 in 4 chance of being randomly selected.
Question analysis
A table lists picture cards for five animals, from 8 cat cards down to 1 horse card, all mixed in one box. Students decide which animal has exactly a 1 in 4 chance of being drawn at random. It tests simple probability as a fraction of the total, and the numbers in the table invite matching the wrong count.
- NYS standards
- 6.SP.8a uniform probability models
- Grade level
- Grade 6 content, by NYS standard
- Compared with grade 7
- Below grade 7 Simple probability from a list of counts is grade 6 work. This takes one sum and one division with small whole numbers, a shorter and more routine task than typical grade 7 probability problems.
- Estimated difficulty
- Routine: one familiar step, little to misread.
- Thinking it demands
- Depth of knowledge 1, recall and reproduction · mainly apply
- What makes it hard
- Solution
- 2 steps
- Reading level
- Question and choices: about grade 1, 47 words.
- Students, last 30 days
- Not enough answers yet to show (it takes 10).
Why it is hard, traps and wrong answers (shows the answer)
Why it is hard
Once the 24 cards are totaled, one fourth of them is 6 and the answer is a lookup. The wrong choices mostly attract students who match the numbers 1 and 4 in the phrase to the horse and fish rows, or who assume the most common card is the one asked about. Little time is needed, so the main risk is skipping the total.
Turning words into math minor Understanding the question
"Exactly a 1 in 4 chance" has to be turned into a count, one fourth of the 24 cards, rather than matched to a 1 or a 4 in the table. (Hegarty, Mayer & Monk, 1995; Koedinger & Nathan, 2004)
Reading a figure, table or graph minor Understanding the question
The counts sit in the table's first column with the animals in the second, and the total of 24 has to be added up from all five rows. (Lesh, Post & Behr, 1987; Kirsch & Mosenthal, 1990)
Strategy: Add the cards to find the total in the box, find one-fourth of that total, and look for the animal with exactly that many cards.
Traps
- Numbers taken from the question: Combines the numbers in the question without a model of the situation, or is simply a number that appears in the question.
The wrong answers, classified
A Little reason to choose it (Haladyna & Downing, 1993; Rodriguez, 2005)
Picks the most common card, but cats are 8 of 24 cards, a 1 in 3 chance, and no reading of the table gives them 1 in 4.
C Numbers taken from the question (Hegarty, Mayer & Monk, 1995)
Matches the 4 in "1 in 4" to the 4 fish cards, confusing a number of cards with a probability.
D Numbers taken from the question (Hegarty, Mayer & Monk, 1995)
Matches the 1 in "1 in 4" to the single horse card instead of comparing each count with the total of 24.
Worked solution, step by step
Formulas used
- Probability
- P is the probability, the chance that something happens. The top counts the results you want. The bottom counts every possible result. Use it when each result is equally likely, like picking one at random.
Sort out the question
The table shows 8 cat cards, 6 dog, 5 bird, 4 fish and 1 horse. All the cards are mixed in a box. You need the animal with “exactly a 1 in 4 chance” of being picked. A 1 in 4 chance means a probability of .
Find the total number of cards
Add every row of the table. This total is the bottom of the probability fraction.
There are 24 cards in the box.
Find one fourth of the cards
The animal you want must have one fourth of all the cards.
So you need the animal with exactly 6 cards. The dog has 6 cards.
Rule out the other choices
Watch out: do not match the numbers 1 and 4 to the table. Fish has 4 cards, but its chance is . So C is wrong. Horse has 1 card, a chance of , so D is wrong. Cat has , so A is wrong.
Give the answer
Only the dog has exactly one fourth of the cards. So the answer is B, dog.
Check your answer
Four groups of 6 cards make 24, the whole box. So 6 cards is one of four equal shares. That is a 1 in 4 chance. The dog cards are exactly one of those shares.
More questions like this
The original DOE question
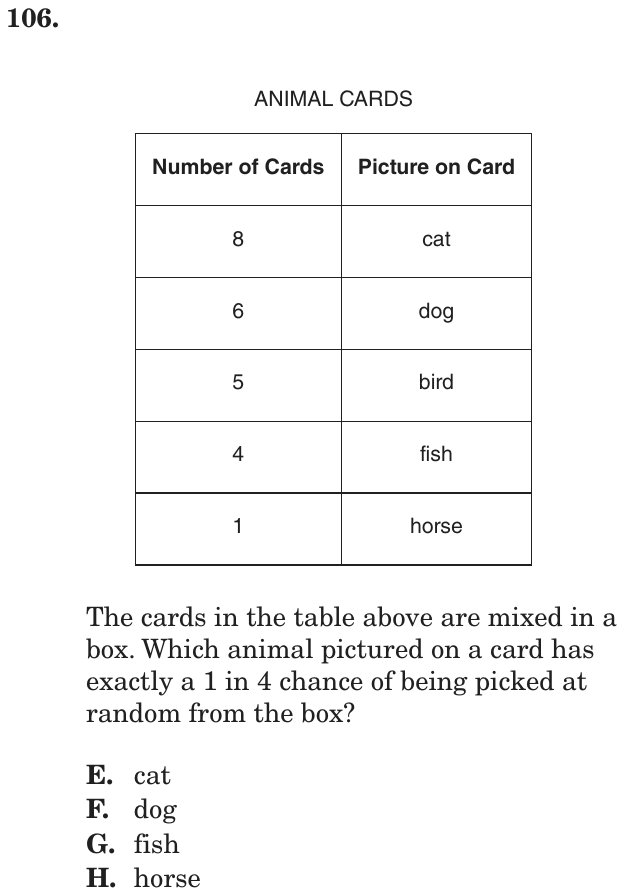
Question 60 of 61
2018 Test B Math, question 52Question
A ball is selected at random from a box that contains 7 black balls, 14 green balls, and 21 red balls. What is the probability that the ball selected is black?
- A
- B
- C
- D
Show the answer
Correct answer: A
The total number of balls in the box is
The probability that the ball is black is
Question analysis
Students find the probability of drawing a black ball at random from a box with 7 black, 14 green and 21 red balls. It tests simple probability as a part of a whole. It is a short question, but the denominator must be chosen with care.
- NYS standards
- 6.SP.8a uniform probability models
- Grade level
- Grade 6 content, by NYS standard
- Compared with grade 7
- Below grade 7 Finding a simple probability from given counts is grade 6 work in New York. This one is a single fraction to simplify, a routine task well below the compound-event problems of grade 7.
- Estimated difficulty
- Routine: one familiar step, little to misread.
- Thinking it demands
- Depth of knowledge 1, recall and reproduction · mainly apply
- What makes it hard
- Solution
- 2 steps
- Reading level
- Question and choices: about grade 4, 32 words.
- Students, last 30 days
- Not enough answers yet to show (it takes 10).
Why it is hard, traps and wrong answers (shows the answer)
Why it is hard
This is a one-formula probability question with friendly numbers, since 7 divides 42 evenly. The wrong answers come from comparing black balls with the other balls only, from treating the three colors as equally likely, or from finding the chance of not drawing black. Students who write the total first rarely miss it.
Something you must already know minor Working it out
The probability of an outcome, favorable balls over all balls, is assumed; nothing in the stem says to add 7 + 14 + 21 for the denominator. (Anderson & Krathwohl, 2001)
A very close wrong answer minor Choosing the answer
1/5 and the right 1/6 are neighboring unit fractions; only counting the 7 black balls in the denominator, 7/42 rather than 7/35, separates them. (Embretson & Wetzel, 1987; Gorin & Embretson, 2006; Ascalon et al., 2007)
Strategy: Add all the balls to get the total, put the number of black balls over that total, and simplify the fraction.
Traps
- Answers a different question: A choice is right for another quantity: the other unknown, the rest instead of the part, the part instead of the whole.
The wrong answers, classified
B Misunderstands the concept (Smith, diSessa & Roschelle, 1993; De Bock et al., 1998; Ni & Zhou, 2005)
Compares the 7 black balls with the 35 others, 7/35 = 1/5, a part-to-part ratio instead of part to whole.
C Misunderstands the concept (Smith, diSessa & Roschelle, 1993; De Bock et al., 1998; Ni & Zhou, 2005)
Treats the three colors as equally likely outcomes, so black gets a 1 in 3 chance however many balls each color has.
D Answers a different question (King et al., 2004; Hegarty, Mayer & Monk, 1995)
Finds the probability that the ball is not black, 35/42 = 5/6, the complement of the event asked about.
Worked solution, step by step
Formulas used
- Probability
- P is the probability, the chance that something happens. The top counts the results you want. The bottom counts every possible result. Use it when each result is equally likely, like picking one at random.
Sort out what you know
The box has 7 black balls, 14 green balls and 21 red balls. One ball is picked at random. That means every ball has the same chance. You need the probability, or chance, that it is black.
Find the total number of balls
The bottom of the fraction is every ball in the box.
There are 42 balls in all.
Write and simplify the probability
Use the probability formula. There are 7 black balls out of 42.
Watch out: comparing black with the other 35 balls gives , choice B. Saying 1 of 3 colors gives , choice C. But the colors have different numbers of balls.
Give the answer
The chance of picking a black ball is 1 out of 6. So the answer is A, .
Check your answer
Notice that 14 is 2 sevens and 21 is 3 sevens. So for every 1 black ball there are 2 green and 3 red. That is 1 black out of every 6 balls. Choice D, , is the chance of not black.
More questions like this
The original DOE question
Question 61 of 61
2018 Test B Math, question 57Question
Carlos tossed a paper cup in the air 50 times and found that the probability of it landing on its side was 72%. If he tosses the cup in the air 150 more times, what is the total number of times he can expect the cup to land on its side?
- A72
- B108
- C144
- D158
Show the answer
Correct answer: C
The probability of the cup landing on its side is 72%. Carlos tossed the cup a total of 200 times (50 + 150). The number of times the cup lands on its side is 72% of 200:
0.72 × 200 = 144.
Question analysis
Carlos tossed a paper cup 50 times and found it landed on its side 72% of the time. If he tosses it 150 more times, students predict the total number of side landings he can expect. It tests using a probability to predict outcomes, and the word total decides which tosses to count.
- Grade level
- Grade 6 content, by NYS standard
- Compared with grade 7
- At grade 7 Predicting outcomes from a probability is grade 6 content, and the arithmetic is a single percent. What lifts it to grade 7 level is deciding exactly which tosses the word "total" refers to.
- Estimated difficulty
- Moderate: several steps, or a close reading with one strong distractor.
- Thinking it demands
- Depth of knowledge 2, skills and concepts · mainly apply
- What makes it hard
- Turning words into math moderate
- Something you must already know minor
- Solution
- 2 steps
- Reading level
- Question and choices: about grade 8, 48 words.
- Students, last 30 days
- Not enough answers yet to show (it takes 10).
Why it is hard, traps and wrong answers (shows the answer)
Why it is hard
The computation is one multiplication, so the question is decided by what "total" covers. Students who focus on the 150 new tosses answer for part of the experiment, and students who add the original 50 tosses as if every one landed on its side overshoot. Reading the last sentence twice, and noticing the word total, is the safeguard.
Turning words into math moderate Understanding the question
"150 more times" and "the total number of times" together mean all 200 tosses, so the expected count is 72% of 200, not of 150. (Hegarty, Mayer & Monk, 1995; Koedinger & Nathan, 2004)
Something you must already know minor Working it out
Students must know that an expected count is the probability times the number of trials; the stem never says to multiply. (Anderson & Krathwohl, 2001)
Strategy: Decide which tosses the word "total" covers, then multiply that number of tosses by 0.72 to get the expected count.
Traps
- Answers a different question: A choice is right for another quantity: the other unknown, the rest instead of the part, the part instead of the whole.
- Numbers taken from the question: Combines the numbers in the question without a model of the situation, or is simply a number that appears in the question.
The wrong answers, classified
A Numbers taken from the question (Hegarty, Mayer & Monk, 1995)
Reads the 72% as 72 side landings, as if there had been 100 tosses, without applying the percent to the actual tosses.
B Answers a different question (King et al., 2004; Hegarty, Mayer & Monk, 1995)
Takes 72% of only the 150 new tosses, 0.72 × 150 = 108, and leaves out the side landings expected in the first 50.
D Numbers taken from the question (Hegarty, Mayer & Monk, 1995)
Adds all 50 first tosses to the 108 expected from the next 150, as if every early toss had landed on its side.
Worked solution, step by step
Formulas used
- Expected count
- P is the probability, the chance of the result on one try, written as a decimal. n is the number of tries. Multiplying tells how many times you can expect the result. It is a good guess, not a promise.
Sort out what you know
Carlos tossed the cup 50 times. It landed on its side 72% of the time. He will toss it 150 more times. You need “the total number of times” it should land on its side. Total means all the tosses, the first 50 and the next 150.
Count all the tosses
Add the first tosses and the new ones.
There are 200 tosses in all.
Watch out: using only the 150 new tosses gives , choice B.
Change the percent to a decimal
Percent means out of 100. So 72% is 72 out of 100. Move the decimal point two places left.
Multiply to find the expected count
Use the expected count formula with 0.72 and 200 tosses.
He can expect the cup to land on its side 144 times.
Watch out: 72 is the count for 100 tosses, not 200. That is choice A.
Give the answer
All 200 tosses count, so the expected total is 144. So the answer is C, 144.
Check your answer
Split it up. In the first 50 tosses, . In the next 150, . Then . Also, 144 is a bit less than three quarters of 200, which is 150. That fits 72%.
More questions like this
The original DOE question