Also in 2026 Practice Test A Math, question 49; 2025 Practice Test A Math, question 56.
Question
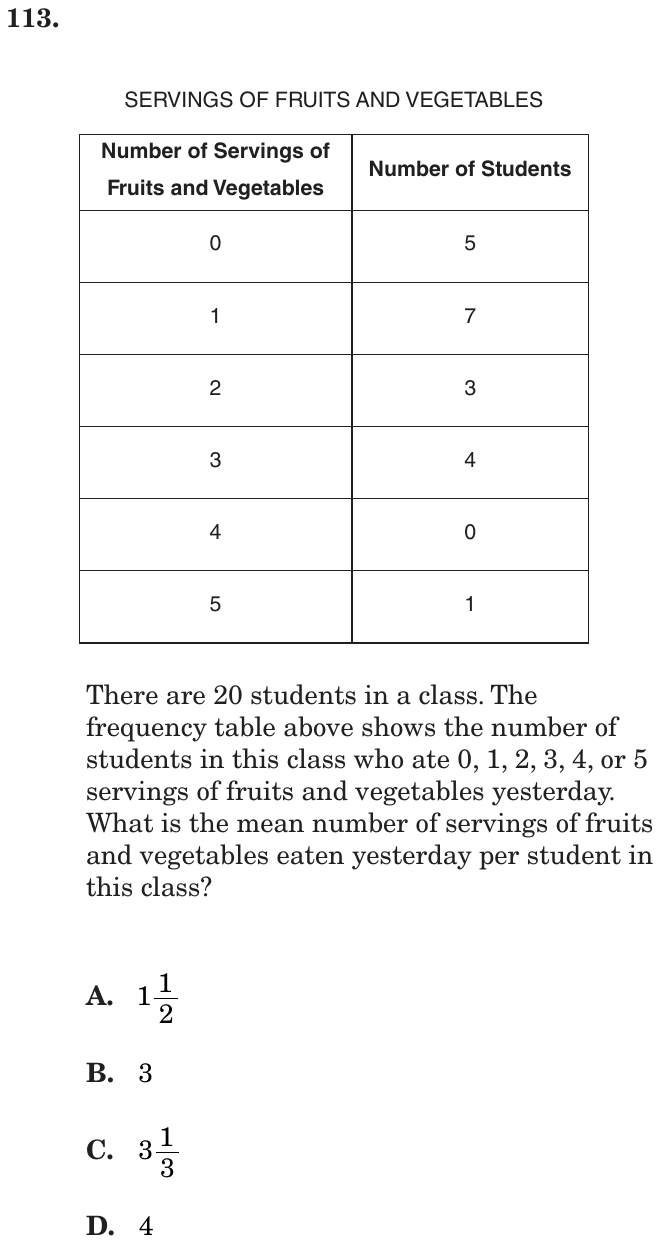
SERVINGS OF FRUITS AND VEGETABLES
| Number of Servings of Fruits and Vegetables | Number of Students |
| 0 | 5 |
| 1 | 7 |
| 2 | 3 |
| 3 | 4 |
| 4 | 0 |
| 5 | 1 |
There are 20 students in a class. The frequency table above shows the number of students in this class who ate 0, 1, 2, 3, 4, or 5 servings of fruits and vegetables yesterday. What is the mean number of servings of fruits and vegetables eaten yesterday per student in this class?
- A
- B
- C
- D
Show the answer
Correct answer: A
First, determine the total number of servings of fruits and vegetables that the students ate by multiplying the number of servings by the number of students in each row of the table.
Then add that column to get the total number of servings:
| Number of Servings of Fruits and Vegetables | Number of Students | Number of Servings × Number of Students |
| 0 | 5 | 0 |
| 1 | 7 | 7 |
| 2 | 3 | 6 |
| 3 | 4 | 12 |
| 4 | 0 | 0 |
| 5 | 1 | 5 |
Total: 30
Calculate the mean by dividing the total number of servings of fruits and vegetables by the total number of students:
Question analysis
This statistics question uses a frequency table showing how many of 20 students ate 0, 1, 2, 3, 4 or 5 servings of fruits and vegetables, and asks for the mean servings per student. Students must weight each serving amount by its number of students, add, and divide. Averaging the wrong column of the table is the common mistake.
- NYS standards
- 6.SP.5c range, center, and overall pattern
- Grade level
- Grade 6 content, by NYS standard
- Compared with grade 7
- At grade 7 Finding a mean is grade 6 content; doing it from a frequency table, where each value must be weighted by its count, is the multi-step version grade 7 students meet regularly.
- Estimated difficulty
- Moderate: several steps, or a close reading with one strong distractor.
- Thinking it demands
- Depth of knowledge 2, skills and concepts · mainly apply
- What makes it hard
- Reading a figure, table or graph moderate
- Many steps minor
- Solution
- 3 steps
- Reading level
- Question and choices: about grade 7, 64 words.
- Students, last 30 days
- Not enough answers yet to show (it takes 10).
Why it is hard, traps and wrong answers (shows the answer)
Why it is hard
The answer is smaller than every wrong choice, which surprises students who average the table's columns directly. The question rewards seeing that each row stands for several students, so the total servings come from weighting each value by its count. The stem's reminder that there are 20 students points to the right divisor.
Reading a figure, table or graph moderate Understanding the question
The frequency table has a value column and a count column; the mean needs each value multiplied by its count, so the two columns play different roles. (Lesh, Post & Behr, 1987; Kirsch & Mosenthal, 1990)
Many steps minor Working it out
Six products, 0, 7, 6, 12, 0 and 5, must be found and added to 30 before dividing by the 20 students. (Daniel & Embretson, 2010; Enright, Morley & Sheehan, 2002)
Strategy: Multiply each serving amount by its number of students, add those products to get the total servings, then divide by the 20 students.
Traps
- Answers a different question: A choice is right for another quantity: the other unknown, the rest instead of the part, the part instead of the whole.
The wrong answers, classified
B Misunderstands the concept (Smith, diSessa & Roschelle, 1993; De Bock et al., 1998; Ni & Zhou, 2005)
Averages the serving amounts 1 through 5 listed in the table, (1 + 2 + 3 + 4 + 5) ÷ 5 = 3, without weighting by the students.
C Answers a different question (King et al., 2004; Hegarty, Mayer & Monk, 1995)
Averages the Number of Students column, 20 students over 6 rows, finding the mean count per row instead of the servings per student.
D Numbers taken from the question (Hegarty, Mayer & Monk, 1995)
Divides the 20 students by 5, the largest serving amount, combining two numbers from the page without a model of the mean.
Worked solution, step by step
Formulas used
- Mean
- m is the mean, or average. S is the sum of all the values, here the total servings eaten. n is the number of values, here the number of students. The mean shares the total equally, as if every student ate the same amount.
Sort out the table
This is a frequency table. Each row says how many students ate a certain number of servings. For example, the second row says 7 students ate 1 serving each.
There are 20 students. You need the mean, or average, number of servings per student.
Find the servings in each row
In each row, multiply the servings by the number of students:
Servings Students Servings × Students 0 5 0 1 7 7 2 3 6 3 4 12 4 0 0 5 1 5 Add up all the servings
The class ate 30 servings in all. The students add up to 20, as the question says: 5 + 7 + 3 + 4 + 0 + 1 = 20.
Divide by the number of students
Watch out: do not just average the serving numbers 1 to 5. That gives 3, choice B, and ignores how many students ate each amount. Dividing 20 students by 6 rows gives choice C.
So the answer is A, .
Check your answer
12 of the 20 students ate 0 or 1 serving. Only 5 ate 3 or more. So the mean should be small, between 1 and 2. fits. Choices B, C and D are all 3 or more, which is too big.
More questions like this
The original DOE question