Question
A vendor is selling 10 packages of homemade fudge at a bake sale. The vendor weighed and labeled each package. The package weights are given in ounces:
| 4.6 | 6.0 | 3.8 | 3.5 | 4.5 |
| 5.4 | 3.9 | 6.5 | 4.8 | 6.2 |
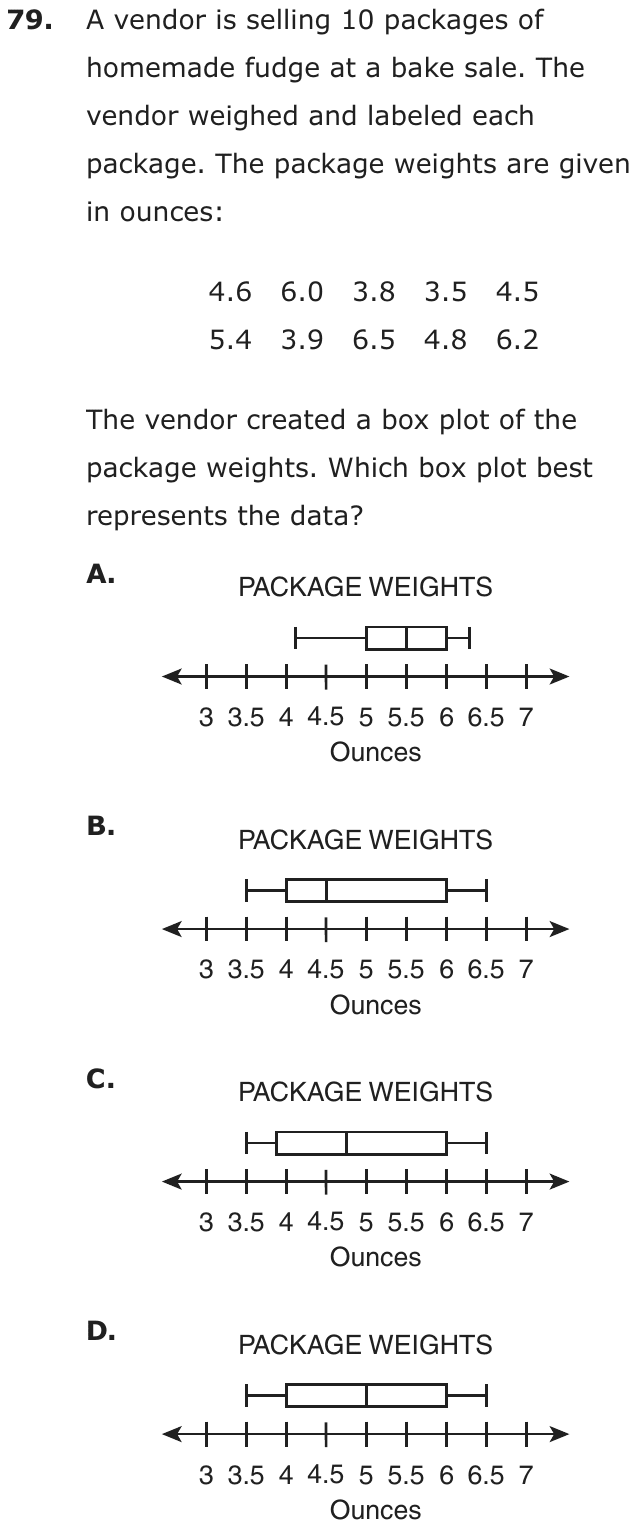
The vendor created a box plot of the package weights. Which box plot best represents the data?
- A
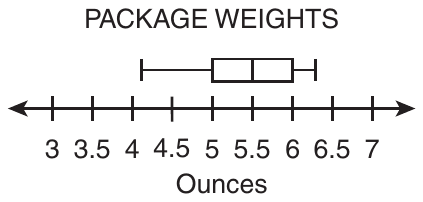
- B
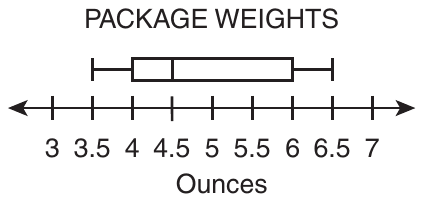
- C
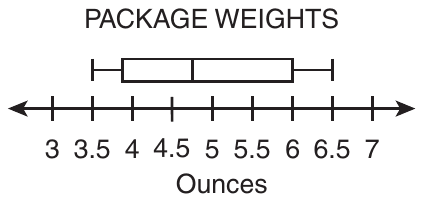
- D
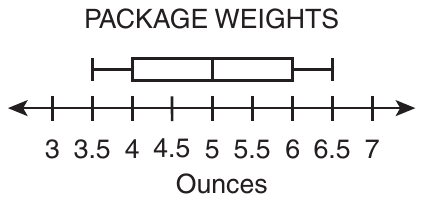
Show the answer
Correct answer: C
A set of 10 data points is given. The first step for determining the quartiles and minimum and maximum values of the box plot is to order the data from smallest to greatest value. For this data set the order is:
| 3.5 | 3.8 | 3.9 | 4.5 | 4.6 |
| 4.8 | 5.4 | 6.0 | 6.2 | 6.5 |
The minimum value is the smallest decimal, 3.5, and the maximum value is the greatest decimal, 6.5.
To determine the median in a set with an even number of values, locate the two middle values (5th and 6th in this case): 4.6 and 4.8. Determine the mean, or average, of the two middle numbers by adding them together and dividing the sum by 2:
To determine the value of the first quartile (Q1), locate the middle value of the 5 terms to the left of the median:
| 3.5 | 3.8 | 3.9 | 4.5 | 4.6 |
To determine the value of the third quartile (Q3), locate the middle value of the 5 terms to the right of the median:
| 4.8 | 5.4 | 6.0 | 6.2 | 6.5 |
Box plot C identifies the correct minimum, maximum, median, and quartiles of the data set.
Question analysis
A vendor weighs 10 packages of homemade fudge, from 3.5 to 6.5 ounces, and makes a box plot of the weights. Students choose the box plot that matches the data. They must sort the decimals, find the median of an even number of values and both quartiles, then compare plots that differ only slightly.
- Grade level
- Grade 7 content, by NYS standard
- Compared with grade 7
- Above grade 7 Building a box plot from data is grade 7 content. This version needs all five summary values from ten unsorted decimals, including a median between two values, then a close comparison of plots, longer and finer than typical.
- Estimated difficulty
- Hard: combines ideas, needs a plan, and has more than one tempting wrong answer.
- Thinking it demands
- Depth of knowledge 2, skills and concepts · mainly apply
- What makes it hard
- Many steps moderate
- A very close wrong answer moderate
- Reading a figure, table or graph moderate
- Slow to do carefully minor
- Solution
- 4 steps
- Reading level
- Question and choices: about grade 4, 43 words.
- Students, last 30 days
- Not enough answers yet to show (it takes 10).
Why it is hard, traps and wrong answers (shows the answer)
Why it is hard
Most of the work happens before the plots are even read: the weights must be sorted, and the median of ten values is the average of two of them. After that, three plots look almost identical, so a careless median, taken from the unsorted list or placed halfway between the extremes, settles on a wrong one. The careful student checks the median line and the box’s left edge against values that fall between the tick marks.
Many steps moderate Working it out
Ten unsorted decimals must be ordered, then five values found: the median as the mean of the fifth and sixth, 4.6 and 4.8, and each quartile as the middle of its half. (Daniel & Embretson, 2010; Enright, Morley & Sheehan, 2002)
A very close wrong answer moderate Choosing the answer
Three plots share whiskers at 3.5 and 6.5 and a box ending at 6; they differ only in the median line, at 4.5, near 4.75 or at 5, and in where the box starts. (Embretson & Wetzel, 1987; Gorin & Embretson, 2006; Ascalon et al., 2007)
Reading a figure, table or graph moderate Understanding the question
The axis is ticked every half ounce, and the correct plot’s median, 4.7, and lower quartile, 3.9, both fall between ticks, so each line’s position must be judged by eye. (Lesh, Post & Behr, 1987; Kirsch & Mosenthal, 1990)
Slow to do carefully minor Choosing the answer
Sorting ten decimals, computing a five-number summary and comparing four plots takes well over a minute and a half when done carefully. (Lu & Sireci, 2007)
Strategy: Sort the ten weights, then find the least and greatest, the median as the mean of the fifth and sixth values, and each quartile as the middle of its half.
Traps
- Wrong formula: Uses a related but wrong formula: perimeter for area, diameter for radius, area for volume, or a misremembered one.
- A faulty procedure: A systematic but wrong procedure: adding fractions straight across, applying an exponent to each term of a sum, dropping a sign when moving a term.
The wrong answers, classified
A Little reason to choose it (Haladyna & Downing, 1993; Rodriguez, 2005)
No working from these weights gives whiskers near 4.1 and 6.3 or a median of 5.5, since the data run from 3.5 to 6.5, so it mostly draws guesses.
B A faulty procedure (Brown & Burton, 1978; Tatsuoka, 1983)
Skips sorting and takes 4.5, the fifth weight as printed, for the median, so the plot with its median line on 4.5 seems to fit.
D Wrong formula (King et al., 2004)
Finds the median with the midrange formula, (3.5 + 6.5) ÷ 2 = 5, halfway between the lightest and heaviest packages instead of the middle of the sorted weights.
Worked solution, step by step
Formulas used
- Median of an even number of values
- First put the values in order. With an even number of values, two sit in the middle. The median is their mean, or average: add them and divide by 2. The median splits the data in half.
- Quartiles
- Q1 is the first quartile and Q3 is the third quartile. Split the ordered data in half at the median. Q1 is the middle of the lower half, and Q3 is the middle of the upper half. A box plot’s box runs from Q1 to Q3.
Sort out the question
The vendor weighed 10 packages of fudge, in ounces. You need the box plot that matches the weights. A box plot is built from five numbers. They are the minimum (least), the first quartile Q1, the median, the third quartile Q3 and the maximum (greatest). So find those five numbers first.
Put the weights in order
List the 10 weights from least to greatest.
3.5 3.8 3.9 4.5 4.6 4.8 5.4 6.0 6.2 6.5 Watch out: you must sort first. The fifth weight as printed is 4.5. Using it as the median points to choice B.
Find the least and greatest
The minimum is 3.5 ounces and the maximum is 6.5 ounces. So the whiskers must run from 3.5 to 6.5. Plot A’s whiskers run from about 4.1 to about 6.3, so A is out.
Find the median
With 10 weights, the two middle ones are the 5th and 6th: 4.6 and 4.8.
The median is 4.7 ounces. Watch out: the median is not halfway between the least and greatest. That gives and points to choice D.
Find the two quartiles
The lower half is the 5 weights below the median: 3.5, 3.8, 3.9, 4.5 and 4.6. Its middle value is .
The upper half is the 5 weights above the median: 4.8, 5.4, 6.0, 6.2 and 6.5. Its middle value is .
Match the summary to a plot
The five numbers are 3.5, 3.9, 4.7, 6.0 and 6.5. Plots B, C and D all run from 3.5 to 6.5, and their boxes end at 6. They differ in the median line and where the box starts.
- B: the box starts at 4, and the median line is at 4.5.
- D: the box starts at 4, and the median line is at 5.
- C: the box starts just left of 4, and the median line is between 4.5 and 5.
C is the closest match to a Q1 of 3.9 and a median of 4.7. So the answer is C.
Check your answer
A median splits the data in half. Five weights, 3.5 to 4.6, are below 4.7. Five, 4.8 to 6.5, are above it. A median line at 5, as in D, would have six weights below it. A line at 4.5, as in B, would have only three below it.
More questions like this
The original DOE question