Question
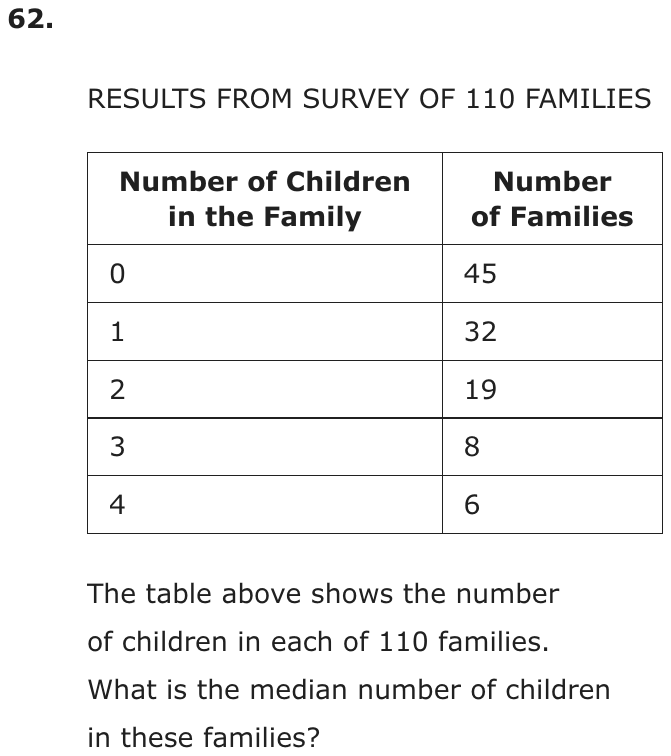
RESULTS FROM SURVEY OF 110 FAMILIES
| Number of Children in the Family | Number of Families |
|---|---|
| 0 | 45 |
| 1 | 32 |
| 2 | 19 |
| 3 | 8 |
| 4 | 6 |
The table above shows the number of children in each of 110 families. What is the median number of children in these families?
Grid-in question: work out the answer and enter it as a number.
Show the answer
Correct answer: 1
Since 110 families were surveyed, the median will have 55 values less than or equal to it, and 55 values greater than or equal to it.
If the values in the table were listed in order, they would look like this:
The first row of the table indicates that 45 families had 0 children.
The second row of the table indicates that 32 families had 1 child.
So 77 families had either 0 children or 1 child, and 45 families had 0 children.
Since 55 is between 45 and 77, the median must be a value in the second row of the table.
So the median is 1.
Question analysis
This statistics grid-in gives a frequency table from a survey of 110 families, showing how many families have each number of children from none to four. Students find the median number of children per family. The table lists counts rather than the 110 data values themselves, so locating the middle value takes a running total of the families.
- Grade level
- Grade 6 content, by NYS standard
- Compared with grade 7
- Above grade 7 Grade 7 median problems usually list a dozen or so values. Here 110 values are hidden in a frequency table, so students must reason about positions with a running count, a less familiar and more error-prone task.
- Estimated difficulty
- Hard: combines ideas, needs a plan, and has more than one tempting wrong answer.
- Thinking it demands
- Depth of knowledge 2, skills and concepts · mainly apply
- What makes it hard
- Reading a figure, table or graph major
- No obvious method moderate
- An answer in an unexpected form minor
- Solution
- 3 steps
- Reading level
- Question and choices: about grade 7, 35 words.
- Students, last 30 days
- Not enough answers yet to show (it takes 10).
Why it is hard, traps and wrong answers (shows the answer)
Why it is hard
Students know a median as the middle of a list, but here the list is never written out. Treating the table's columns as the data gives quick, confident answers, 2 from the middle of the children column or 19 from the middle of the family counts, and neither can be checked against choices. The question rewards counting positions: 45 families have no children, so the 55th and 56th families both fall among the 32 with one child.
Reading a figure, table or graph major Understanding the question
The table hides 110 data values in five rows: the 0 to 4 column lists the possible values, and 45, 32, 19, 8 and 6 say how many families have each. (Lesh, Post & Behr, 1987; Kirsch & Mosenthal, 1990)
No obvious method moderate Working it out
The median of 110 values lies between the 55th and 56th; finding them takes a running count of families, 45 and then 77, a method seldom practiced with tables. (Schoenfeld, 1985)
An answer in an unexpected form minor Choosing the answer
As a grid-in there are no choices to compare, so a student who takes the middle row's 2 has nothing on the page to suggest it is wrong. (Enright, Morley & Sheehan, 2002)
Strategy: With 110 values the median sits between the 55th and 56th; add the family counts row by row until the running total passes 55, and read that row's number of children.
Traps
- Misunderstands the concept: A wrong belief about a concept: that percents can be added, that area grows like length, that averages can be averaged, that a bigger denominator means a bigger fraction.
- Answers a different question: A choice is right for another quantity: the other unknown, the rest instead of the part, the part instead of the whole.
The wrong answers, classified
2 Misunderstands the concept (Smith, diSessa & Roschelle, 1993; De Bock et al., 1998; Ni & Zhou, 2005)
Takes the middle entry of the children column, 0 to 4, ignoring that each number of children belongs to a different number of families.
19 Answers a different question (King et al., 2004; Hegarty, Mayer & Monk, 1995)
Finds the median of the Number of Families column, 6, 8, 19, 32 and 45, a middle family count rather than a number of children.
1.07 Answers a different question (King et al., 2004; Hegarty, Mayer & Monk, 1995)
Computes the mean instead, 118 children among 110 families, about 1.07, a different measure of center from the median asked for.
Worked solution, step by step
Formulas used
- Spot of the median
- The median is the middle value when all the values are put in order. n is how many values there are. This gives the spot of the middle value, with the same number of values before and after it. If it ends in a half, the median is halfway between the two values on either side.
Sort out the table
The table covers 110 families. The left column is a number of children. The right column says how many families have that many children. For example, 45 families have 0 children. You need the median number of children. The median is the middle value when all the values are in order.
Picture the values in order
Think of a list with one number for each family: how many children it has. The list has 45 zeros, then 32 ones, then 19 twos, then 8 threes, then 6 fours. It is already in order, from least to most.
There are 110 values. Watch out: the median is not the middle row, 2. Each row stands for a different number of families.
Find the middle spot
Use the median rule with n = 110.
The middle is halfway between the 55th and 56th values. So you need those two values in the list.
Count down the list
Keep a running total of families, row by row. The zeros fill spots 1 to 45. Now add the 32 families with 1 child.
So the ones fill spots 46 to 77. Spot 55 and spot 56 are both in that range. So both values are 1.
Give the median
The 55th and 56th values are both 1. Halfway between 1 and 1 is 1. So the median is 1 child. Watch out: the median is a number of children, not of families. Gridding 19, from the families column, is wrong. So is the mean, or average, which is about 1.07. So you would grid 1.
Check your answer
Half of 110 is 55. Families with 0 children: 45, which is less than half. So the median is not 0. Families with 0 or 1 child: 77, which is more than half. So the median is not more than 1. It must be 1.
More questions like this
The original DOE question