Also in 2026 Practice Test A Math, question 41; 2025 Practice Test A Math, question 47.
Question
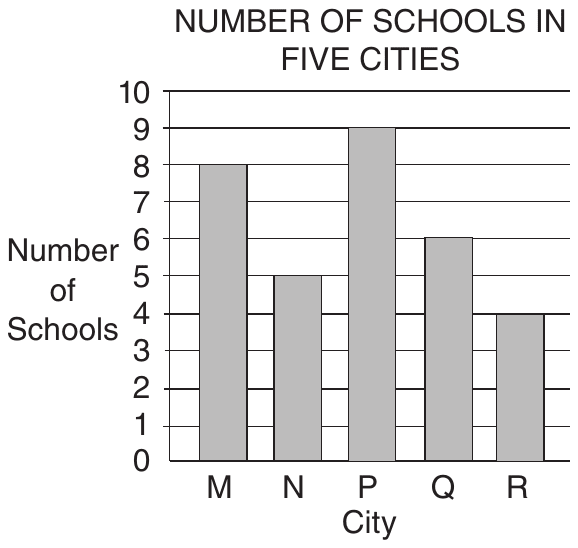
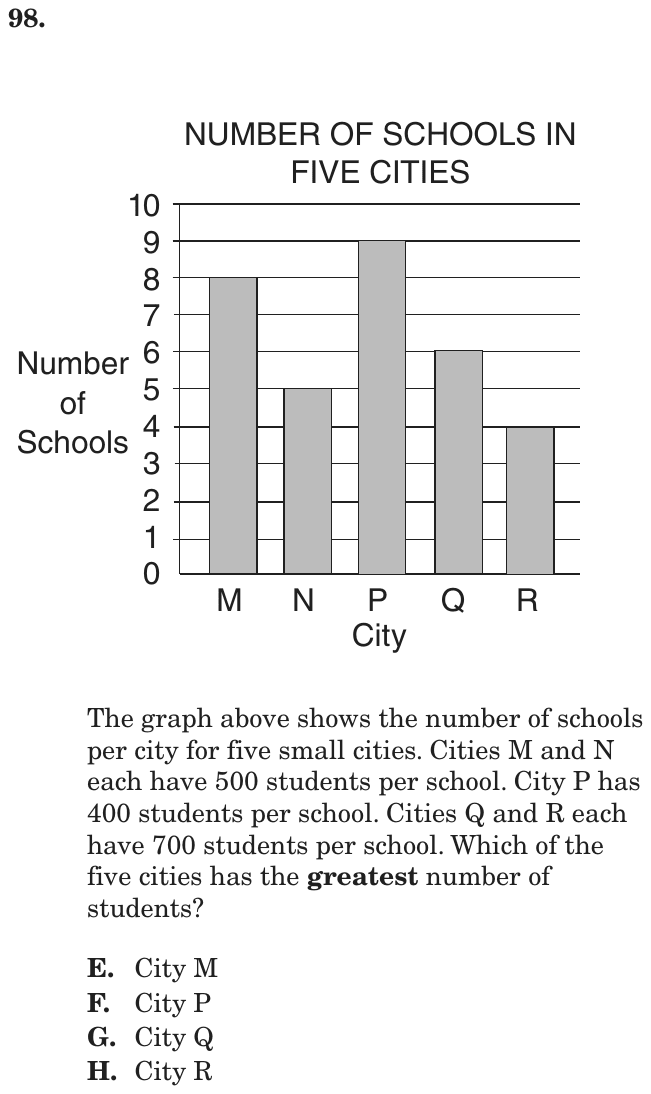
The graph above shows the number of schools per city for five small cities. Cities M and N each have 500 students per school. City P has 400 students per school. Cities Q and R each have 700 students per school. Which of the five cities has the greatest number of students?
- ACity M
- BCity P
- CCity Q
- DCity R
Show the answer
Correct answer: C
Take each city’s number of schools and multiply by the number of students. It is not necessary to calculate all 5 of these.
Cities M and N have the same number of students per school, so just calculate the number of students in City M because it has more schools than City N.
The same goes for Q and R — only Q needs to be calculated because it has more schools than R.
M= 8 × 500 = 4,000
P = 9 × 400 = 3,600
Q = 6 × 700 = 4,200
City Q has the greatest number of students.
Question analysis
This graph question shows the number of schools in each of five small cities and gives the number of students per school for each city. Students multiply schools by students per school to compare the total number of students. Comparing only the bars, or only the rates, can mislead.
- Grade level
- Grade 6 content, by NYS standard
- Compared with grade 7
- Below grade 7 Reading a bar graph and multiplying is familiar from grade 6. Grade 7 data tasks often add percents or compare distributions; this one needs only a few whole-number products, so it is easier than typical grade 7 work.
- Estimated difficulty
- Straightforward: two steps or one careful reading.
- Thinking it demands
- Depth of knowledge 2, skills and concepts · mainly apply
- What makes it hard
- A very close wrong answer moderate
- Much to keep track of minor
- Reading a figure, table or graph minor
- Solution
- 3 steps
- Reading level
- Question and choices: about grade 2, 57 words.
- Corrected from the DOE handbook
- A misstatement in the explanation was corrected.
- Students, last 30 days
- Not enough answers yet to show (it takes 10).
Why it is hard, traps and wrong answers (shows the answer)
Why it is hard
Neither the tallest bar nor the highest rate wins, which is the point of the question: total students depend on both. The explanation's shortcut, comparing only M, P and Q because N and R each share a rate with a taller bar, cuts the work to three products. The top two totals are close, so the products must actually be computed rather than estimated.
A very close wrong answer moderate Choosing the answer
City M's 4,000 students and City Q's 4,200 differ by only 200, so judging from bar heights and rates cannot separate them; only computing 8 × 500 and 6 × 700 does. (Embretson & Wetzel, 1987; Gorin & Embretson, 2006; Ascalon et al., 2007)
Much to keep track of minor Working it out
The rates come in three groups in the stem, 500 for M and N, 400 for P, 700 for Q and R, and each must be matched to its bar. (Sweller, 1988; Carpenter, Just & Shell, 1990)
Reading a figure, table or graph minor Understanding the question
The number of schools comes only from the bar heights, read against gridlines from 0 to 10; all five bars end exactly on a gridline. (Lesh, Post & Behr, 1987; Kirsch & Mosenthal, 1990)
Strategy: For each city, multiply the number of schools read from the graph by its students per school and compare the products; cities that share a rate need only their school counts compared.
Traps
- Stops one step early: A choice is a number from partway through the solution.
- Answers a different question: A choice is right for another quantity: the other unknown, the rest instead of the part, the part instead of the whole.
The wrong answers, classified
A Stops one step early (King et al., 2004; Gierl et al., 2017)
Computes M's 8 × 500 = 4,000 and P's 9 × 400 = 3,600 and stops, never working out Q's 6 × 700 = 4,200.
B Answers a different question (King et al., 2004; Hegarty, Mayer & Monk, 1995)
Picks the tallest bar, P's nine schools, which answers which city has the most schools rather than the most students.
D Numbers taken from the question (Hegarty, Mayer & Monk, 1995)
Picks a city with the stem's highest rate, 700 students per school, without noticing that R has only 4 schools to Q's 6.
What was corrected from the DOE handbook, and why
- Explanation: The handbook says “Cities M and N have the same number of students”. They have the same number of students per school (500), not the same total: M has 8 × 500 = 4,000 and N has 5 × 500 = 2,500, which is why only City M, with more schools, needs to be calculated. The sentence now says “the same number of students per school”.
Worked solution, step by step
Formulas used
- Total students in a city
- S is the total number of students in a city. n is the number of schools, read from the bar. s is the number of students in each school. You multiply because every school in that city has the same number of students.
Read the graph
The bar graph shows how many schools each city has. Read the top of each bar against the numbers on the left. M has 8, N has 5, P has 9, Q has 6 and R has 4.
The question gives the students per school. You need the city with the most students in all.
Multiply for each city
Use the formula for each city:
City Schools Students per school Total students M 8 500 4,000 N 5 500 2,500 P 9 400 3,600 Q 6 700 4,200 R 4 700 2,800 Compare the totals
The biggest total is 4,200, for City Q.
Watch out: City P has the tallest bar, but that means the most schools, not the most students. That leads to choice B. City M’s 4,000 is close, so do not stop before you work out Q. That is choice A.
So the answer is C, City Q.
Check your answer
A shortcut: M and N both have 500 per school, and M has more schools, so M beats N. Q and R both have 700, and Q beats R. So only M, P and Q matter: 4,000, 3,600 and 4,200. Q still wins.
More questions like this
The original DOE question