Question
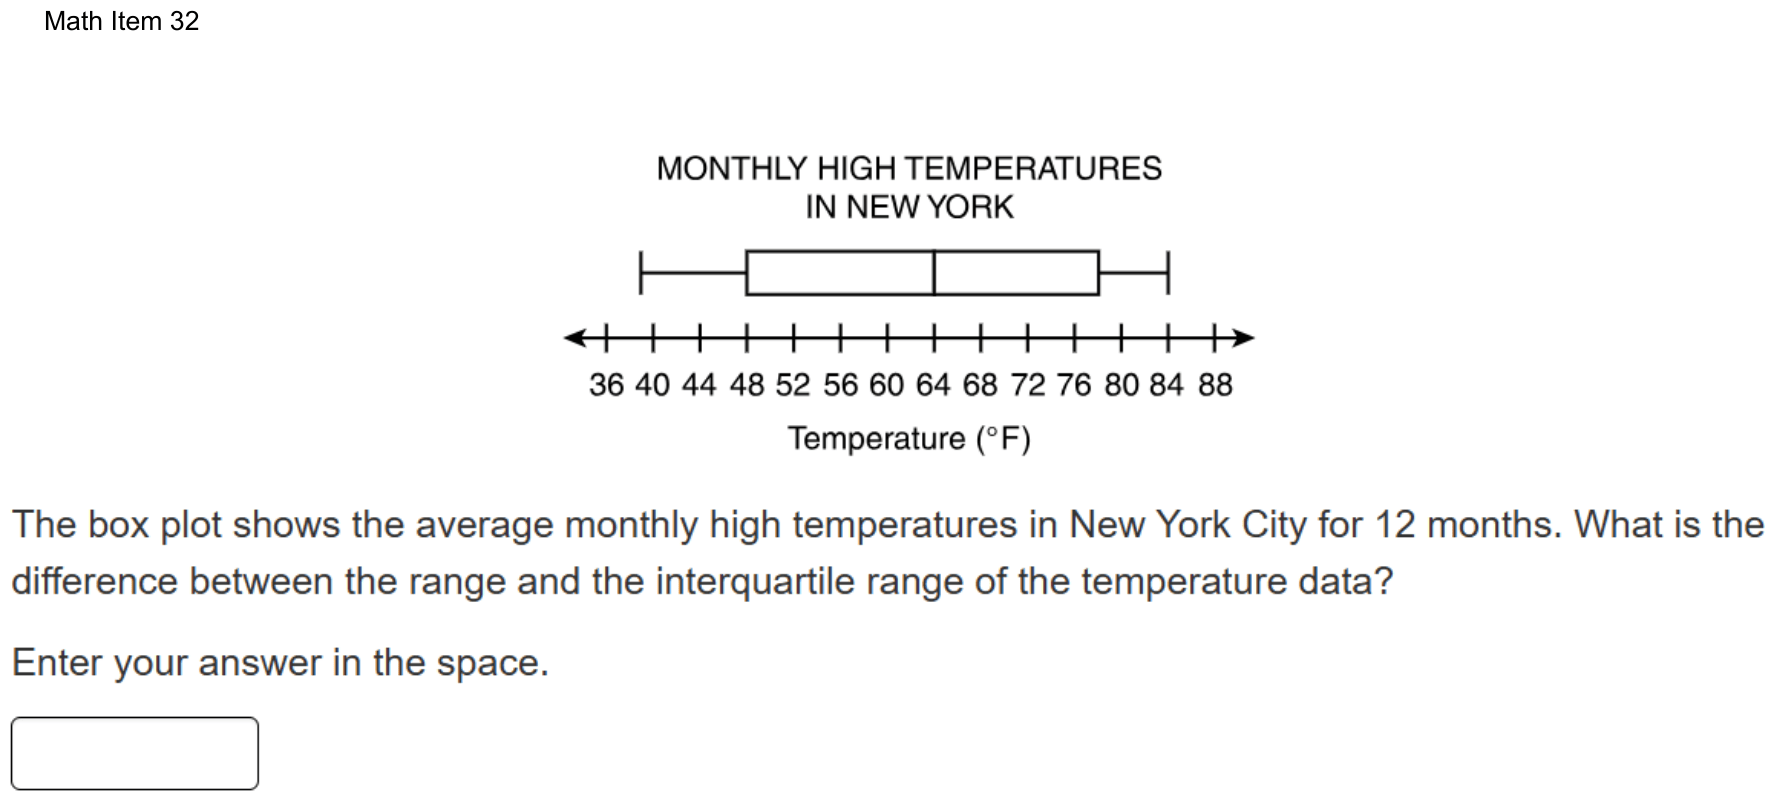
The box plot shows the average monthly high temperatures in New York City for 12 months. What is the difference between the range and the interquartile range of the temperature data?
Enter your answer in the space.
Fill-in question: work out the answer and type it as a number.
Show the answer
Correct answer: 15
Determine the range by subtracting the minimum value on the box plot from the maximum value on the box plot:
Maximum value , Minimum value
Determine the interquartile range by subtracting the lower quartile value on the box plot from the upper quartile value on the box plot:
Upper Quartile Value , Lower Quartile Value
Determine the difference between the range (45° F) and the interquartile range (30° F):
Question analysis
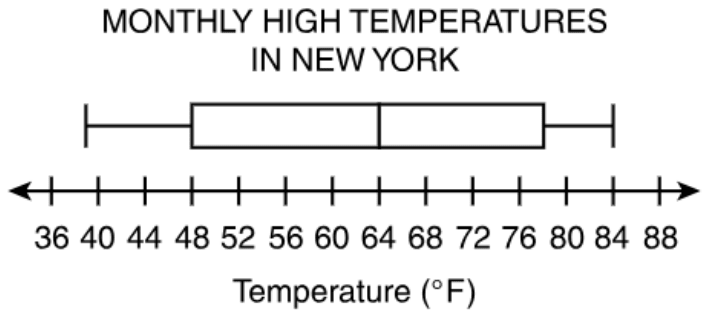
A box plot of New York City's average monthly high temperatures for 12 months sits above a number line labeled every 4 degrees. Students type the difference between the range and the interquartile range of the data. Two of the plot's values fall between labeled ticks, so careful reading of the scale decides the answer.
- Grade level
- Grade 7 content, by NYS standard
- Compared with grade 7
- Above grade 7 Reading a box plot and finding its interquartile range are grade 7 skills. Here two of the five values fall between ticks spaced 4 apart, and the range, the IQR and their difference must all be found and typed with no choices.
- Estimated difficulty
- Hard: combines ideas, needs a plan, and has more than one tempting wrong answer.
- Thinking it demands
- Depth of knowledge 2, skills and concepts · mainly apply
- What makes it hard
- Solution
- 3 steps
- Reading level
- Question and choices: about grade 7, 36 words.
- Students, last 30 days
- Not enough answers yet to show (it takes 10).
Why it is hard, traps and wrong answers (shows the answer)
Why it is hard
The method is standard, but the key rests on reading the scale between its labels. The axis is ticked only every 4 degrees, and the minimum and the upper quartile land off the ticks, so rounding either one to the nearest label moves the result by a degree or two with nothing to flag it. Students who find the range correctly can also stop there, entering 45, the larger of the two spreads, instead of the difference the question asks for.
Reading a figure, table or graph major Understanding the question
Two of the five values fall between ticks spaced 4 degrees apart: the left whisker ends just short of the 40 tick, at 39, and the box’s right edge sits midway between 76 and 80, at 78. (Lesh, Post & Behr, 1987; Kirsch & Mosenthal, 1990)
Many steps minor Working it out
Four values are read and combined in three subtractions, the range, the interquartile range and then their difference, so one misread value changes the final entry. (Daniel & Embretson, 2010; Enright, Morley & Sheehan, 2002)
Something you must already know minor Working it out
Neither measure is defined on the page: the range spans the whiskers, and the interquartile range is the width of the box, the upper quartile minus the lower. (Anderson & Krathwohl, 2001)
An answer in an unexpected form minor Choosing the answer
The result is typed with no choices to compare, so an entry one or two degrees off, from rounding a value to the nearest tick, looks just as finished as the right one. (Enright, Morley & Sheehan, 2002)
Strategy: Read the minimum, both quartiles and the maximum, judging where each mark falls between the ticks, then subtract for the range and for the IQR, and subtract those two results.
Traps
- Misreads the figure: Reads a value, label or tick spacing in a figure, table or graph wrongly.
- Stops one step early: A choice is a number from partway through the solution.
The wrong answers, classified
14 Misreads the figure (Lesh, Post & Behr, 1987; Kirsch & Mosenthal, 1990)
Reads the left whisker’s end as 40, the nearest labeled tick, instead of 39, so the range becomes 84 − 40 = 44 and 44 − 30 = 14.
45 Stops one step early (King et al., 2004; Gierl et al., 2017)
Finds the range, 84 − 39 = 45 degrees, and enters it, stopping before the interquartile range of 30 is subtracted from it.
17 Misreads the figure (Lesh, Post & Behr, 1987; Kirsch & Mosenthal, 1990)
Reads the box’s right edge as 76, the tick just left of it, instead of 78, so the IQR becomes 76 − 48 = 28 and 45 − 28 = 17.
Worked solution, step by step
Formulas used
- Range
- The maximum is the greatest value, at the right end of the right whisker. The minimum is the least value, at the left end of the left whisker. The range tells how far the whole set of data spreads.
- Interquartile range (IQR)
- Q3 is the upper quartile, the right edge of the box. Q1 is the lower quartile, the left edge of the box. The IQR is the width of the box. It tells how far the middle half of the data spreads.
Sort out the question
A box plot shows data with five numbers. The two whiskers are the lines on each side of the box. Their ends are the minimum, the least value, and the maximum, the greatest. The box runs from the lower quartile to the upper quartile. These are the middles of the lower half and the upper half of the data. The line inside the box is the median, the middle value.
You need the range minus the interquartile range (IQR), in degrees.
Read the values between the ticks
The ticks on the number line are 4 degrees apart. So each degree is one quarter of the space between two ticks. Three values sit right on ticks: the box’s left edge at 48, the median at 64, and the right whisker’s end at 84.
- The left whisker starts just left of the 40 tick. It sits about one quarter of the way back toward 36. So the minimum is degrees.
- The box’s right edge is halfway between 76 and 80. Halfway is 78 degrees.
Find the range
Use the range formula:
The data spread over 45 degrees.
Watch out: rounding the minimum to the 40 tick gives a range of 44. Then the final answer comes out 14, which is wrong.
Find the IQR
Use the IQR formula with the two edges of the box:
The middle half of the data spreads over 30 degrees.
Watch out: reading the box’s right edge as 76 gives an IQR of 28. Then the final answer comes out 17.
Subtract the IQR from the range
The question asks for the difference between the two:
Watch out: 45 is only the range. Do not stop there. Type only the number, with no degree sign.
So you would enter 15.
Check your answer
The range covers the whole plot, and the IQR covers only the box. So their difference is the two whiskers added together. The left whisker is degrees long. The right whisker is degrees long. , which matches.
More questions like this
The original DOE question