Also in 2026 Practice Test B Math, question 12; 2025 Practice Test B Math, question 13.
Question
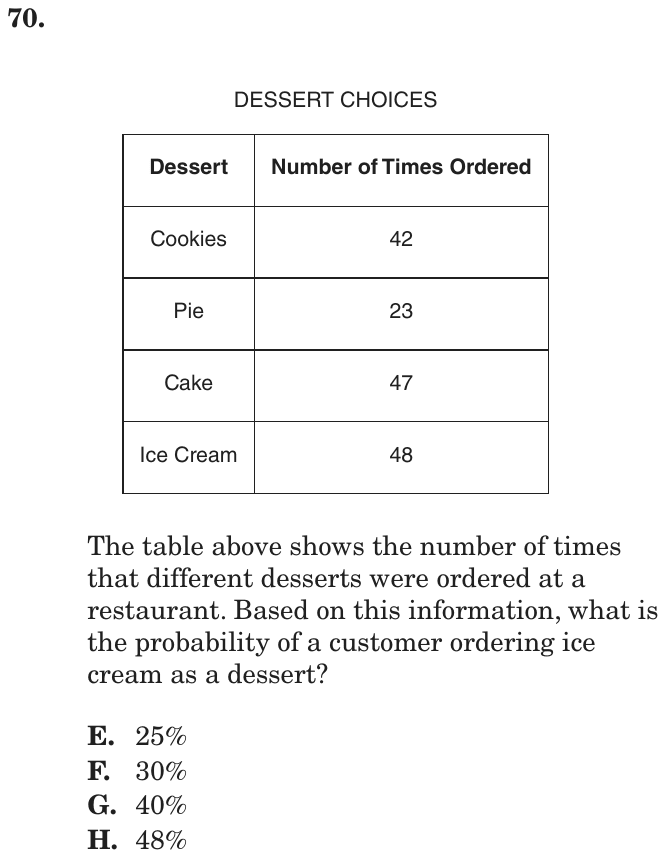
DESSERT CHOICES
| Dessert | Number of Times Ordered |
| Cookies | 42 |
| Pie | 23 |
| Cake | 47 |
| Ice Cream | 48 |
The table above shows the number of times that different desserts were ordered at a restaurant. Based on this information, what is the probability of a customer ordering ice cream as a dessert?
- A25%
- B30%
- C40%
- D48%
Show the answer
Correct answer: B
The total number of desserts ordered is
42 + 23 + 47 + 48 = 160
The probability that ice cream was chosen is
.
Question analysis
This probability question gives a table of how many times four desserts were ordered at a restaurant and asks how likely a customer is to order ice cream, as a percent. Students total the orders and divide. The trap is using a raw count, or the wrong total, in place of the full number of desserts ordered.
- Grade level
- Grade 6 content, by NYS standard
- Compared with grade 7
- Below grade 7 Finding a probability from observed frequencies is grade 6 content in New York. Here it takes one sum, one division and a conversion to a percent with friendly numbers, lighter than typical grade 7 work.
- Estimated difficulty
- Routine: one familiar step, little to misread.
- Thinking it demands
- Depth of knowledge 1, recall and reproduction · mainly apply
- What makes it hard
- Solution
- 3 steps
- Reading level
- Question and choices: about grade 5, 45 words.
- Students, last 30 days
- Not enough answers yet to show (it takes 10).
Why it is hard, traps and wrong answers (shows the answer)
Why it is hard
This is a direct relative-frequency question with friendly numbers, and most students finish it quickly. The risk is using a number from the table as if it were already a percent, or treating the four desserts as equally likely. Remembering that a probability compares one count with the total of all counts prevents both mistakes.
Reading a figure, table or graph minor Understanding the question
The four counts sit in a table, and the probability needs all of them: the ice cream row gives the numerator and the sum of the column gives the denominator. (Lesh, Post & Behr, 1987; Kirsch & Mosenthal, 1990)
Error-prone arithmetic minor Working it out
Adding 42 + 23 + 47 + 48 by hand and then simplifying 48/160 to 3/10 are small steps where a careless total spoils the percent. (Brown & Burton, 1978; Junker & Sijtsma, 2001)
Strategy: Add the four counts in the table to get all the orders, divide the ice cream count by that total, and convert the fraction to a percent.
Traps
- Answers a different question: A choice is right for another quantity: the other unknown, the rest instead of the part, the part instead of the whole.
The wrong answers, classified
A Misunderstands the concept (Smith, diSessa & Roschelle, 1993; De Bock et al., 1998; Ni & Zhou, 2005)
Treats the four desserts as equally likely, one chance in four, ignoring how often each was actually ordered.
C Answers a different question (King et al., 2004; Hegarty, Mayer & Monk, 1995)
Divides 48 by the 112 orders of the other desserts instead of all 160, getting about 43%, and takes the nearest choice.
D Numbers taken from the question (Hegarty, Mayer & Monk, 1995)
Reads the 48 ice cream orders as 48 percent without dividing by the total number of desserts ordered.
Worked solution, step by step
Formulas used
- Probability
- P is the probability, the chance that something happens. The top counts the outcomes you want, here ice cream orders. The bottom counts every outcome, here all dessert orders. It works because each order counts the same.
- Fraction to percent
- Percent means out of 100. Multiply a fraction or a decimal by 100 to write it as a percent. For example, 3/10 times 100 is 30, so 3/10 is 30%.
Sort out the table
The table shows how many times each dessert was ordered. Ice cream was ordered 48 times.
You need the chance that a customer orders ice cream. The orders in the table show how often each dessert is picked.
Find the total orders
Add all four rows of the table.
There were 160 dessert orders in all. This is the bottom of the fraction, because it counts every order.
Write the probability
Put the counts into the probability formula. The top is the 48 ice cream orders. The bottom is all 160 orders.
Simplify the fraction. Both numbers can be divided by 16.
Change to a percent
The probability is 30%.
Watch out: 48 orders is not 48%, choice D. You must divide by the total. Also, the four desserts are not equally popular. So the chance is not 1 out of 4, or 25%, choice A.
So the answer is B, 30%.
Check your answer
Work backward: . That matches the ice cream row. Also, 48 is a bit less than a third of 160, and 30% is a bit less than a third.
More questions like this
The original DOE question