Question
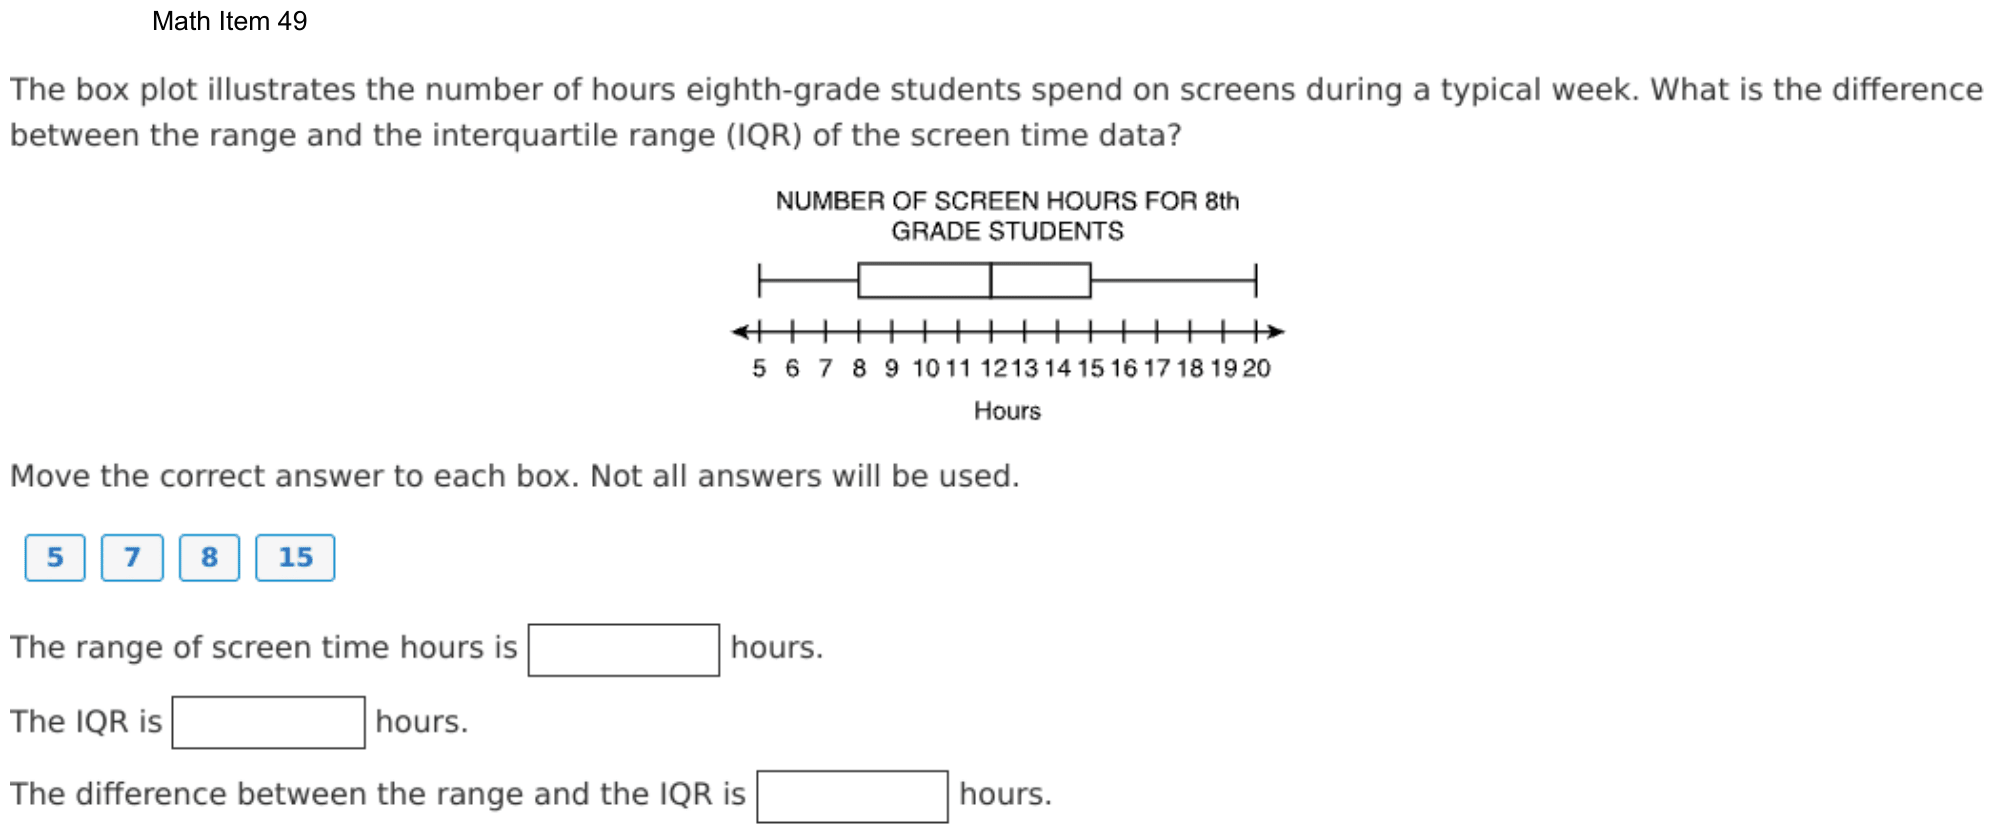
The box plot illustrates the number of hours eighth-grade students spend on screens during a typical week. What is the difference between the range and the interquartile range (IQR) of the screen time data?
Move the correct answer to each box. Not all answers will be used.
The range of screen time hours is hours.
The IQR is hours.
The difference between the range and the IQR is hours.
On the test you drag tiles into the boxes; here, choose each box’s tile from its menu. Each tile can be used once. The DOE has not published how answers with several parts are scored; this site counts one right only when every part is right.
Show the answer
Correct answer: blank 1: 15; blank 2: 7; blank 3: 8
Determine the range by subtracting the minimum value on the box plot from the maximum value on the box plot:
Maximum value , Minimum value
Determine the interquartile range by subtracting the lower quartile value on the box plot from the upper quartile value on the box plot:
Upper Quartile Value , Lower Quartile Value
Determine the difference between the range (15 hr) and the interquartile range (7 hr):
Question analysis
A box plot shows how many hours a week eighth-grade students spend on screens, on a number line marked every hour. Students move number tiles to complete three sentences: the range, the interquartile range, and the difference between them. Each tile can be used only once, and keeping the range and the interquartile range apart is the tricky part.
- Grade level
- Grade 7 content, by NYS standard
- Compared with grade 7
- At grade 7 Reading a box plot and finding its range and interquartile range are grade 7 statistics skills. The values sit on labeled whole-number ticks and the three sentences lead through the steps, a typical grade 7 task.
- Estimated difficulty
- Straightforward: two steps or one careful reading.
- Thinking it demands
- Depth of knowledge 2, skills and concepts · mainly apply
- What makes it hard
- Something you must already know minor
- Many steps minor
- Solution
- 3 steps
- Reading level
- Question and choices: about grade 4, 69 words.
- Corrected from the DOE handbook
- A missing comma in the explanation was restored.
- Students, last 30 days
- Not enough answers yet to show (it takes 10).
Why it is hard, traps and wrong answers (shows the answer)
Why it is hard
The plot is drawn on whole-hour ticks, and the three sentences lay out the steps, so this is a direct check of two definitions. The main risk is taking a value off the plot, such as the lower quartile of 8, for a spread between two values. Because the four tiles allow only one use each, a student who confuses the measures can still fill every box, which hides the error.
Something you must already know minor Working it out
The sentences name the range and the IQR but never define them; students must know the range spans the whiskers and the IQR spans only the box. (Anderson & Krathwohl, 2001)
Many steps minor Working it out
Three boxes must all be right, the third depends on the first two, and each tile can be used once, so one mix-up spreads to a second box. (Daniel & Embretson, 2010; Enright, Morley & Sheehan, 2002)
Strategy: Read the five key values off the plot, subtract the least from the greatest for the range, subtract the lower quartile from the upper for the IQR, then subtract those results.
Traps
- Misunderstands the concept: A wrong belief about a concept: that percents can be added, that area grows like length, that averages can be averaged, that a bigger denominator means a bigger fraction.
- Wrong formula: Uses a related but wrong formula: perimeter for area, diameter for radius, area for volume, or a misremembered one.
The wrong answers, classified
DCB Misunderstands the concept (Smith, diSessa & Roschelle, 1993; De Bock et al., 1998; Ni & Zhou, 2005)
Takes the lower quartile, 8, as the interquartile range, reading a value off the box instead of its width, so the difference becomes 15 − 8 = 7.
BDC Wrong formula (King et al., 2004)
Swaps the two measures, giving the box’s width, 7, as the range and the whiskers’ spread, 15, as the IQR, while the difference stays 8.
What was corrected from the DOE handbook, and why
- Explanation: The DOE’s explanation runs two values together: “Maximum value = 20 hr Minimum value = 5 hr”. Its next line is “Upper Quartile Value = 15 hr, Lower Quartile Value = 8 hr”, and Question 32’s explanation has “Maximum value = 84° F, Minimum value = 39° F”. The site adds the comma.
Worked solution, step by step
Formulas used
- Range
- The maximum is the greatest value, at the right end of the right whisker. The minimum is the least value, at the left end of the left whisker. The range tells how far the whole set of data spreads.
- Interquartile range (IQR)
- Q3 is the upper quartile, the right edge of the box. Q1 is the lower quartile, the left edge of the box. The IQR is the width of the box. It tells how far the middle half of the data spreads.
Sort out the question
The box plot shows the hours of screen time for eighth graders in a week. You need three numbers: the range, the IQR, and the difference between them.
There are four tiles: 5, 7, 8 and 15. Each tile is used at most once, and one tile is left over.
Read the five values
The number line has a tick at every hour, and every value sits on a tick:
- The left whisker starts at 5. This is the minimum.
- The box starts at 8. This is the lower quartile, the middle of the lower half of the data.
- The line inside the box is at 12. This is the median, the middle value.
- The box ends at 15. This is the upper quartile, the middle of the upper half.
- The right whisker ends at 20. This is the maximum.
Find the range
Use the range formula with the two ends of the whiskers:
The screen times spread over 15 hours, from the least to the most.
Find the IQR
Use the IQR formula with the two edges of the box:
The middle half of the students spend between 8 and 15 hours, a spread of 7 hours.
Watch out: the IQR is a width, not a point on the plot. The tile 8 is the lower quartile. Putting it in the IQR box also makes the last box 7, which is wrong.
Find the difference
Subtract the IQR from the range:
Watch out: do not swap the two measures. The range uses the whiskers’ ends, and the IQR uses only the box.
Fill in the three boxes
On the test, you drag a tile into each box. On this site, you choose each tile from its box’s menu. The range box gets 15, the IQR box gets 7, and the difference box gets 8. The tile 5 is not used.
So the boxes get 15, 7 and 8.
Check your answer
The difference is just the two whiskers added together. The left whisker is hours long. The right whisker is hours long. , which matches the third box.
More questions like this
The original DOE question