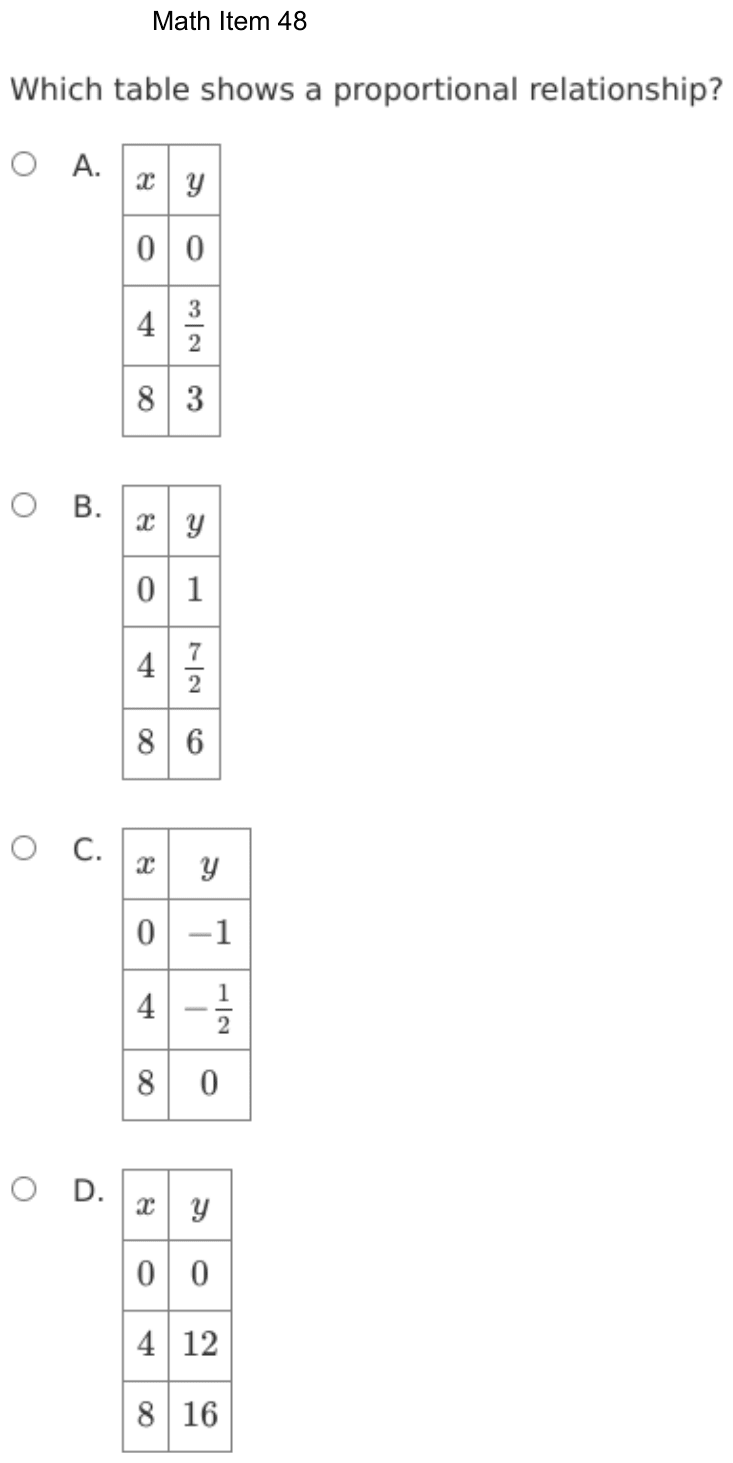
Question
Which table shows a proportional relationship?
- A
x y 0 0 4 8 3 - B
x y 0 1 4 8 6 - C
x y 0 −1 4 8 0 - D
x y 0 0 4 12 8 16
Show the answer
Correct answer: A
The first table is the only one with a constant of proportionality, .
In each ordered pair, .
Question analysis
Four tables each give y for x = 0, 4 and 8, with some values written as fractions or negatives. Students choose the table that shows a proportional relationship. It tests recognizing proportional relationships from a table, which means checking every row against one rule rather than judging by the pattern.
- Grade level
- Grade 7 content, by NYS standard
- Compared with grade 7
- At grade 7 Deciding from a table whether a relationship is proportional is a core grade 7 skill. The fractions and negative values in the tables make each ratio a careful check rather than a glance.
- Estimated difficulty
- Straightforward: two steps or one careful reading.
- Thinking it demands
- Depth of knowledge 2, skills and concepts · mainly apply
- What makes it hard
- Every choice must be checked moderate
- Error-prone arithmetic minor
- Solution
- 2 steps
- Reading level
- Question and choices: about grade 9, 13 words.
- Students, last 30 days
- Not enough answers yet to show (it takes 10).
Why it is hard, traps and wrong answers (shows the answer)
Why it is hard
Two quick tests decide proportionality, and the tables are built so that each test alone lets a wrong table through. The last table starts at (0, 0) like the right one, while the middle two grow by equal steps like the right one. Only checking that y ÷ x is the same in every row with x not 0 separates the one table whose ratio stays at 3/8.
Every choice must be checked moderate Choosing the answer
Each table has to be tested row by row, and two of them start at (0, 0), so the opening row settles nothing; only y ÷ x in the other rows separates them. (Embretson & Wetzel, 1987)
Error-prone arithmetic minor Working it out
The y-values include 3/2, 7/2 and −1/2, so the ratios mean dividing fractions by 4, such as (3/2) ÷ 4 = 3/8, and comparing them with 3 ÷ 8. (Brown & Burton, 1978; Junker & Sijtsma, 2001)
Strategy: For each table, divide y by x in every row where x is not zero, and check that the quotient never changes and that y is 0 when x is 0.
Traps
- Misunderstands the concept: A wrong belief about a concept: that percents can be added, that area grows like length, that averages can be averaged, that a bigger denominator means a bigger fraction.
- Checks only one number: Tries one value in each choice and takes the first that works, when that value happens to work for a wrong choice too; a second value would rule it out.
The wrong answers, classified
B Misunderstands the concept (Smith, diSessa & Roschelle, 1993; De Bock et al., 1998; Ni & Zhou, 2005)
Sees y rise by the same 5/2 each time x rises by 4 and takes the steady change as proportional, missing that y is 1 when x is 0.
C Misreads the figure (Lesh, Post & Behr, 1987; Kirsch & Mosenthal, 1990)
Spots a 0 in the y column and a steady rise of 1/2, but that 0 belongs to x = 8, while at x = 0 the table gives −1.
D Checks only one number (Schoenfeld, 1985)
Checks only the row (0, 0), which every proportional table has, or only 12 ÷ 4 = 3, without testing 16 ÷ 8 = 2 in the last row.
Worked solution, step by step
Formulas used
- Proportional relationship
- y and x are the two amounts in each row. k is the constant of proportionality, the same number in every row. Two tests follow from it. When x is 0, y must be 0. And y ÷ x must equal k in every row where x is not 0.
Sort out the question
Each table gives y for x = 0, 4 and 8. You need the one that shows a proportional relationship. That means y is always the same number times x.
Use two tests. First, y must be 0 when x is 0. Second, y ÷ x must be the same in the other rows.
Test the row where x is 0
Look at the top row of each table:
- Table A: y = 0. It passes.
- Table B: y = 1. It fails.
- Table C: y = −1. It fails.
- Table D: y = 0. It passes.
Watch out: tables B and C go up by equal steps. Steady steps are not enough, because they do not start at 0. Table C does have a 0, but it is next to x = 8.
Test the ratio in table A
Divide y by x. Dividing by 4 is the same as multiplying by :
Both rows give . Table A passes both tests.
Test the ratio in table D
Divide y by x in the same way:
The ratios are different, so table D is not proportional.
Watch out: table D starts at (0, 0) like a proportional table. If you check only that row, or only the row with 4, you will pick choice D.
Give the answer
Only table A starts at (0, 0) and keeps y ÷ x the same.
So the answer is A, the table with y = 0, and 3.
Check your answer
Use the rule for table A, . When x = 4, . When x = 8, . Both match. Doubling x from 4 to 8 also doubles y.
More questions like this
The original DOE question