Also in 2025 Practice Test A Math, question 27.
Question
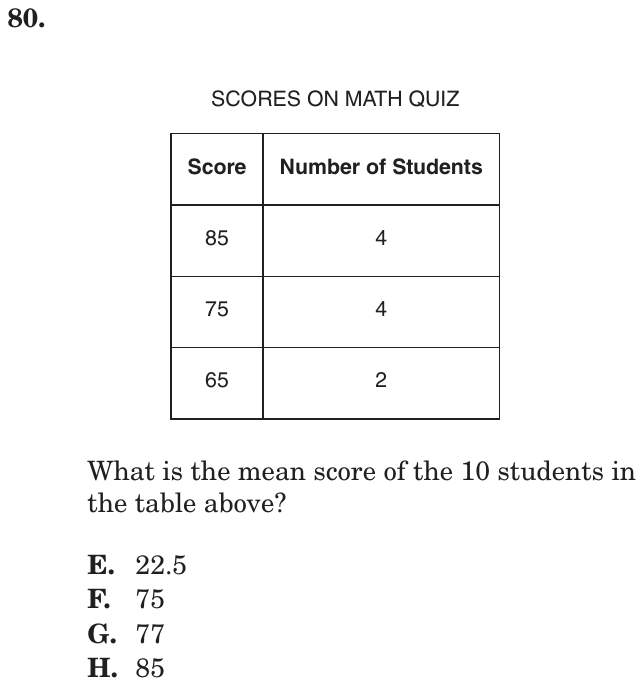
SCORES ON MATH QUIZ
| Score | Number of Students |
| 85 | 4 |
| 75 | 4 |
| 65 | 2 |
What is the mean score of the 10 students in the table above?
- A22.5
- B75
- C77
- D85
Show the answer
Correct answer: C
For each row, multiply the number of students by the score. Then add those together and divide by the total number of students to find the mean (average) of the 10 students.
Question analysis
This statistics question gives a frequency table of quiz scores: three scores and how many of the 10 students earned each. Students find the mean score of all 10 students. Each score has to count as many times as students earned it, which is easy to overlook when only three scores are listed.
- Grade level
- Grade 6 content, by NYS standard
- Compared with grade 7
- Below grade 7 Computing a mean is grade 6 work, and this weighted version from a table takes two short steps. It is a little easier than typical grade 7 statistics, which compares whole data sets.
- Estimated difficulty
- Straightforward: two steps or one careful reading.
- Thinking it demands
- Depth of knowledge 2, skills and concepts · mainly apply
- What makes it hard
- A very close wrong answer moderate
- Reading a figure, table or graph minor
- Solution
- 2 steps
- Reading level
- Question and choices: about grade 2, 20 words.
- Students, last 30 days
- Not enough answers yet to show (it takes 10).
Why it is hard, traps and wrong answers (shows the answer)
Why it is hard
The procedure is routine once students see that the table lists counts, not separate students. The tempting shortcut is to average the three scores in the first column, which gives a listed choice close to the right one. Multiplying each score by its count, then dividing by 10, takes well under a minute.
A very close wrong answer moderate Choosing the answer
77 and 75 are only 2 points apart, so a rough sense of the middle score cannot choose between them; only weighting each score by its 4, 4 or 2 students does. (Embretson & Wetzel, 1987; Gorin & Embretson, 2006; Ascalon et al., 2007)
Reading a figure, table or graph minor Understanding the question
The table pairs each score with a number of students, so the 10 students are 4, 4 and 2, and each score must be weighted by its count. (Lesh, Post & Behr, 1987; Kirsch & Mosenthal, 1990)
Strategy: Multiply each score by its number of students, add the three products, and divide by the 10 students.
Traps
- Misunderstands the concept: A wrong belief about a concept: that percents can be added, that area grows like length, that averages can be averaged, that a bigger denominator means a bigger fraction.
The wrong answers, classified
A Numbers taken from the question (Hegarty, Mayer & Monk, 1995)
Adds the three scores, 85 + 75 + 65 = 225, and divides by the 10 students, an average lower than every score in the table.
B Misunderstands the concept (Smith, diSessa & Roschelle, 1993; De Bock et al., 1998; Ni & Zhou, 2005)
Averages the three listed scores, (85 + 75 + 65) ÷ 3 = 75, ignoring that 4, 4 and 2 students earned them.
D Numbers taken from the question (Hegarty, Mayer & Monk, 1995)
Picks the top score, which 4 students earned, instead of computing a mean of all 10 scores.
Worked solution, step by step
Formulas used
- Mean (average)
- M is the mean, also called the average. S is the sum, all the values added together. n is how many values there are. Dividing shares the total out equally, so the mean is what each value would be if they were all the same.
Sort out the table
The table lists 3 scores and how many students got each one. 4 students scored 85. 4 students scored 75. 2 students scored 65. That is students. You need the mean, or average, of all 10 scores.
Find the sum of all 10 scores
Each score counts once for every student who got it. So multiply each score by its number of students.
Add the three results.
All 10 scores add up to 770 points.
Divide by the number of students
Watch out: averaging just the three scores gives , choice B. That acts as if only one student got each score. So the answer is C, 77.
Check your answer
More students scored 85 than 65. So the mean should be a little above the middle score, 75. 77 fits. A mean must also be between the lowest and highest scores, 65 and 85. That rules out 22.5.
More questions like this
The original DOE question