Question
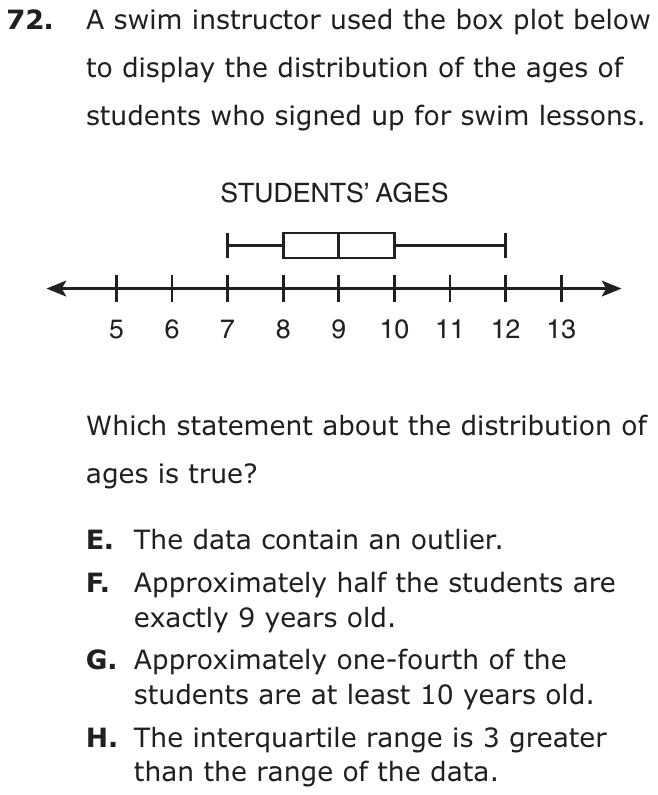
A swim instructor used the box plot below to display the distribution of the ages of students who signed up for swim lessons.
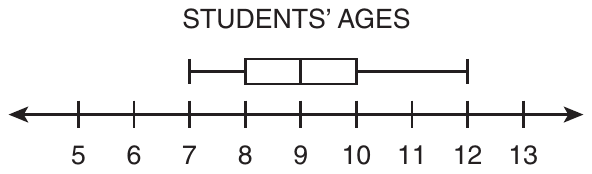
Which statement about the distribution of ages is true?
- AThe data contain an outlier.
- BApproximately half the students are exactly 9 years old.
- CApproximately one-fourth of the students are at least 10 years old.
- DThe interquartile range is 3 greater than the range of the data.
Show the answer
Correct answer: C
The data points in the box plot are as follows:
- minimum: 7
- first quartile: 8
- median: 9
- third quartile: 10
- maximum: 12
Since the value of the third quartile is 10, approximately one-fourth of the students are 10–12 years old.
Question analysis
A swim instructor's box plot shows the ages of students who signed up for lessons. Students decide which of four statements about the distribution is true, using the minimum, quartiles, median and maximum. The statements test different box plot ideas, including outliers, the median, the quartiles and the range, so each needs its own check.
- Grade level
- Grade 7 content, by NYS standard
- Compared with grade 7
- At grade 7 New York places box plots, the interquartile range and outliers in grade 7. Here four statements test those ideas one at a time; each check is short, so the item matches typical grade 7 work.
- Estimated difficulty
- Moderate: several steps, or a close reading with one strong distractor.
- Thinking it demands
- Depth of knowledge 2, skills and concepts · mainly understand
- What makes it hard
- Something you must already know moderate
- Every choice must be checked moderate
- Reading a figure, table or graph minor
- Solution
- 3 steps
- Reading level
- Question and choices: about grade 8, 66 words.
- Students, last 30 days
- Not enough answers yet to show (it takes 10).
Why it is hard, traps and wrong answers (shows the answer)
Why it is hard
Reading the five values off the plot is quick; the work is knowing what a box plot can and cannot say. It shows where quarters of the data begin and end, not how many students share any one age, and a long whisker is not an outlier unless it passes the 1.5 × IQR cutoff, here 13. The true statement uses the third quartile: about a quarter of the students are 10 or older.
Something you must already know moderate Working it out
The statements rely on box plot facts the question does not give: each section holds about a quarter of the data, the middle line is the median, and outliers lie beyond 1.5 IQRs. (Anderson & Krathwohl, 2001)
Every choice must be checked moderate Choosing the answer
Four statements test four separate ideas, an outlier, the share at one age, a quarter of the data and two spreads, so ruling one out says nothing about the rest. (Embretson & Wetzel, 1987)
Reading a figure, table or graph minor Understanding the question
The five values, 7, 8, 9, 10 and 12, are read off a 5-to-13 scale, where the longer right whisker draws the eye more than the box does. (Lesh, Post & Behr, 1987; Kirsch & Mosenthal, 1990)
Strategy: Read the five key values off the plot, then test each statement: compute the range, the interquartile range and the outlier cutoffs, and recall what share of the data each part holds.
Traps
- Misunderstands the concept: A wrong belief about a concept: that percents can be added, that area grows like length, that averages can be averaged, that a bigger denominator means a bigger fraction.
- Wrong formula: Uses a related but wrong formula: perimeter for area, diameter for radius, area for volume, or a misremembered one.
The wrong answers, classified
A Misunderstands the concept (Smith, diSessa & Roschelle, 1993; De Bock et al., 1998; Ni & Zhou, 2005)
Takes the long right whisker, reaching 12, as a sign of an outlier, but 12 is below the cutoff 10 + 1.5 × 2 = 13.
B Misunderstands the concept (Smith, diSessa & Roschelle, 1993; De Bock et al., 1998; Ni & Zhou, 2005)
Reads the median line at 9 as the age of half the students, though a median only splits the ages into a lower and an upper half.
D Wrong formula (King et al., 2004)
Swaps the two measures, taking the box's 2 years as the range and the whiskers' 5 years as the interquartile range, so the IQR seems 3 greater.
Worked solution, step by step
Formulas used
- Range
- The maximum is the largest value, the right end of a box plot. The minimum is the smallest, the left end. The range is how far apart they are. It shows how spread out all the data are.
- Interquartile range
- IQR is short for interquartile range. Q1, the first quartile, is the left edge of the box. Q3, the third quartile, is the right edge. The IQR is the width of the box. It is the spread of the middle half of the data. The four parts of a box plot each hold about one-fourth of the data.
- Outlier test
- An outlier is a value far from the rest of the data. A common rule says a value is an outlier if it lies more than 1.5 IQRs below Q1 or above Q3.
Read the five values off the plot
A box plot shows five numbers. The median is the middle value when the ages are in order.
Part Age Minimum, the left whisker’s end 7 First quartile, Q1, the box’s left edge 8 Median, the line in the box 9 Third quartile, Q3, the box’s right edge 10 Maximum, the right whisker’s end 12 Check choice A, an outlier
An outlier would be above 13 or below 5. The ages only run from 7 to 12. So there is no outlier. Watch out: a long whisker is not an outlier. It just means the top ages are spread out. Choice A is false.
Check choice B, the median
The median, 9, is the middle age. About half the students are 9 or younger. About half are 9 or older. It does not tell how many are exactly 9. Watch out: the median line does not mean half the students are 9. Choice B is false.
Check choice C, the top fourth
The box plot splits the students into four groups of about the same size. Each group holds about one-fourth of them. The last group runs from Q3, 10, to the maximum, 12. At least 10 means 10 or more. So about one-fourth of the students are at least 10 years old. Choice C is true.
Check choice D, the two spreads
The IQR is 3 less than the range, not 3 greater. The box always fits inside the whiskers, so the IQR can never be bigger. Watch out: swapping the two measures gives choice D. So the answer is C: about one-fourth of the students are at least 10 years old.
Check your answer
Picture 20 students. About 5 would be in each fourth of the plot. The top 5 would be ages 10 to 12. That is about one-fourth, just as choice C says. Each other choice fails a fact you can read straight off the plot.
More questions like this
The original DOE question