7.SP statistics and probability
Question 1 of 45
2026 Practice Test B Math, question 2Question
The list shows the results of a survey. A survey was taken to see whether students like basketball, soccer, both, or neither. These were the results:
- 25 students like basketball.
- 19 students like soccer.
- 7 students like both basketball and soccer.
- 10 students don’t like either basketball or soccer.
Use the information provided to determine how many students were surveyed and how many like only soccer.
Move the correct answer to each box.
There were students surveyed, and students like only soccer.
On the test you drag tiles into the boxes; here, choose each box’s tile from its menu. Each tile can be used once. The DOE has not published how answers with several parts are scored; this site counts one right only when every part is right.
Show the answer
Correct answer: blank 1: 47; blank 2: 12
There were 47 students surveyed, and 12 students like only soccer.
To determine how many students were surveyed, start with the total number of students who like basketball and soccer separately and subtract the number of students who were counted twice.
There were 25 students who like basketball, 19 students who like soccer, and 7 students who like both basketball and soccer.
So, the total number of students who like basketball or soccer is .
Then, add the students who don’t like either basketball or soccer: 10 students don’t like either sport.
Total students surveyed:
To determine how many students like only soccer, subtract the number of students who like both basketball and soccer from the total number of students who like soccer.
Students who like only soccer:
Question analysis
This survey problem lists how many students like basketball, soccer, both sports or neither, and students drag number tiles into two boxes: how many were surveyed and how many like only soccer. It is a Venn diagram counting question. Keeping track of the students who like both sports, who appear in two of the listed counts, is the tricky part.
- NYS standards
- 7.SP.8b sample spaces for compound events
- Grade level
- Grade 7 content, by NYS standard
- Compared with grade 7
- At grade 7 Overlapping groups like these are seldom taught on their own in grade 7, though the arithmetic is simple whole-number addition and subtraction. Two results come from the same four facts, and both boxes must be right to score.
- Estimated difficulty
- Moderate: several steps, or a close reading with one strong distractor.
- Thinking it demands
- Depth of knowledge 2, skills and concepts · mainly apply
- What makes it hard
- Much to keep track of moderate
- Turning words into math minor
- Solution
- 4 steps
- Reading level
- Question and choices: about grade 6, 78 words.
- Students, last 30 days
- Not enough answers yet to show (it takes 10).
Why it is hard, traps and wrong answers (shows the answer)
Why it is hard
The arithmetic is light; the work is keeping track of one overlap that touches both answers. Students often remove the 7 for one box and not the other, and the pool holds 54 and 19, the tiles those half-finished methods produce. A sketch of two overlapping circles, with 7 in the middle, 18 and 12 beside it and 10 outside, turns both boxes into reading off the picture.
Much to keep track of moderate Working it out
The 7 students who like both sports sit inside the 25 and inside the 19, so they come out once for the total and again for only soccer, and both boxes must be right to score. (Sweller, 1988; Carpenter, Just & Shell, 1990)
Turning words into math minor Understanding the question
The list never says that the 25 basketball fans already include the 7 who like both sports, and only the word “only” in the question separates the 12 from all 19 soccer fans. (Hegarty, Mayer & Monk, 1995; Koedinger & Nathan, 2004)
Strategy: Sketch two overlapping circles, write the students who like both sports in the middle, fill each outer part by subtraction, then add every region and the students who like neither.
Traps
- Overlapping groups: Things in two groups at once are counted twice, or not subtracted.
- Misreads the question: Misses or misreads a condition or a word in the question: "at least", "each", "remaining", "not".
The wrong answers, classified
FA Overlapping groups (King et al., 2004)
Adds 25 + 19 + 10 = 54 for the total, counting the 7 fans of both sports twice, yet takes them out of the soccer fans correctly to get 12.
EB Misreads the question (Hegarty, Mayer & Monk, 1995)
Removes the overlap correctly to find the 47 surveyed, then fills the second box with all 19 soccer fans, overlooking “only” and the 7 of them who also like basketball.
FB Overlapping groups (King et al., 2004)
Ignores the line about the 7 who like both sports, adding 25 + 19 + 10 = 54 and copying the 19 soccer fans straight from the list.
Worked solution, step by step
Formulas used
- Counting two groups that overlap
- B is the number who like basketball, and S is the number who like soccer. The students who like both are inside B and inside S, so B + S counts them twice. Subtract them once to fix that. Then add the students who like neither sport, since they are in neither group.
- Only one group
- S is everyone who likes soccer, and both is the number who like both sports. Only soccer means the soccer fans who do not also like basketball. Take the both group out of the soccer group to find them.
Sort out the question
The survey gives you four facts:
- 25 students like basketball.
- 19 students like soccer.
- 7 students like both sports.
- 10 students like neither sport.
You need two numbers. The first box is how many students were surveyed in all. The second box is how many like only soccer, which means soccer but not basketball. Each tile can be used once.
See who is counted twice
The 7 students who like both sports are part of the 25 basketball fans. They are also part of the 19 soccer fans. So if you add 25 and 19, those 7 students get counted two times.
A Venn diagram shows this. It is a picture of two circles that overlap. The 7 go in the middle, where the circles share space.
Count who likes at least one sport
Use the overlap rule. Add the two groups, then take away the 7 who were counted twice:
So 37 students like basketball, soccer or both.
Add the students who like neither
The 10 students who like neither sport are not in either group. They were still surveyed, so add them:
So 47 students were surveyed.
Watch out: adding 25 + 19 + 10 = 54 counts the 7 students twice. The tile 54 is waiting for that mistake.
Find who likes only soccer
The 19 soccer fans include the 7 who like basketball too. Take those 7 away:
So 12 students like only soccer.
Watch out: the word only matters. The tile 19 counts every soccer fan, not just the ones who like only soccer.
Fill in both boxes
On the test, you drag the tile 47 into the first box and the tile 12 into the second box. On this site, you choose each tile from its box’s menu.
So the boxes get 47 and 12: there were 47 students surveyed, and 12 students like only soccer.
Check your answer
Split the students into four groups that do not overlap. Only basketball is . Both sports is 7. Only soccer is 12. Neither is 10. Add the four groups: . That matches the first box.
More questions like this
The original DOE question
Question 2 of 45
2026 Practice Test B Math, question 31Question
A pizza shop offers a choice of 3 sizes (small, medium, and large) and 7 different toppings. Different pizzas can be created by changing the size and the choice of toppings. If Cody wants to order a pizza with exactly 2 different toppings, how many different pizzas can he create?
- A6
- B21
- C63
- D126
Show the answer
Correct answer: C
Figure out how many different topping pairs are possible. Use 1, 2, 3, 4, 5, 6, 7 to represent the toppings, and create a list of possible pairs:
1,2; 1,3; 1,4; 1,5; 1,6; 1,7
2,3; 2,4; 2,5; 2,6; 2,7
3,4; 3,5; 3,6; 3,7
4,5; 4,6; 4,7
5,6; 5,7
6,7
So there are 21 different topping combinations for one pizza.
Since there are 3 pizza sizes, multiply the total number of combinations by 3 to get the total number of different pizzas Cody can create: .
Question analysis
Cody orders a pizza with exactly 2 of 7 toppings in one of 3 sizes, and students count how many different pizzas he could create. It tests counting combinations, where the order of the toppings does not matter, combined with a second choice. The challenge is to count every possible pizza exactly once.
- NYS standards
- 7.SP.8b sample spaces for compound events
- Grade level
- Grade 7 content, by NYS standard
- Compared with grade 7
- Above grade 7 In grade 7, compound events are usually ordered pairs, such as a coin with a number cube. Here an unordered pair of toppings is chosen from seven and then matched with three sizes, a combination count beyond typical grade 7 work.
- Estimated difficulty
- Hard: combines ideas, needs a plan, and has more than one tempting wrong answer.
- Thinking it demands
- Depth of knowledge 2, skills and concepts · mainly apply
- What makes it hard
- Combines ideas moderate
- Something you must already know minor
- Solution
- 3 steps
- Reading level
- Question and choices: about grade 8, 47 words.
- Students, last 30 days
- Not enough answers yet to show (it takes 10).
Why it is hard, traps and wrong answers (shows the answer)
Why it is hard
The question packs two counts into one sentence, each with its own trap. Order does not matter among the toppings, while the size multiplies every pair, and students tend to remember one of these and forget the other. Listing pairs systematically, each topping matched only with later ones, keeps the first count honest, and the stem’s “changing the size and the choice of toppings” is the reminder that size counts too.
Combines ideas moderate Working it out
Two counts are joined: the unordered pairs of toppings from 7, then the 3 sizes each pair can come in, and a mistake in either count changes the total. (Embretson, 1998; Daniel & Embretson, 2010)
Something you must already know minor Working it out
Students must know that a pizza with mushroom and onion is the same as one with onion and mushroom, so the ordered count 7 × 6 has to be halved. (Anderson & Krathwohl, 2001)
Strategy: Number the toppings 1 to 7, list each pair once by matching every topping only with higher-numbered ones, count the list, then bring in the choice of size.
Traps
- Stops one step early: A choice is a number from partway through the solution.
- Overlapping groups: Things in two groups at once are counted twice, or not subtracted.
The wrong answers, classified
A Numbers taken from the question (Hegarty, Mayer & Monk, 1995)
Multiplies the 3 sizes by the 2 toppings Cody wants, using the number of toppings on the pizza instead of the number of possible pairs.
B Stops one step early (King et al., 2004; Gierl et al., 2017)
Lists or counts the 21 pairs of toppings correctly, then stops without giving each pair its 3 possible sizes.
D Overlapping groups (King et al., 2004)
Counts ordered pairs, 7 × 6 = 42, so each pair of toppings appears twice, and then multiplies by the 3 sizes to reach 126.
Worked solution, step by step
Formulas used
- The counting principle
- m is the number of ways to make one choice, and n is the number of ways to make a second choice. Every first choice can go with every second choice, so you multiply. Here, every pair of toppings can come in every size.
- Pairs when order does not matter
- n is the number of items to choose from. There are n ways to pick a first item and n − 1 ways to pick a different second one. That counts each pair twice, once in each order. Dividing by 2 counts each pair once.
Sort out the question
Each of Cody’s pizzas has one size and exactly 2 different toppings. There are 3 sizes and 7 toppings. Pizzas differ by “changing the size and the choice of toppings.” So a small and a large with the same toppings are two different pizzas. You need to count every pizza once.
List the topping pairs
Order does not matter: onion with peppers is the same pizza as peppers with onion. So number the toppings 1 to 7, and pair each one only with bigger numbers. Then no pair shows up twice.
Topping Pairs with Pairs 1 2, 3, 4, 5, 6, 7 6 2 3, 4, 5, 6, 7 5 3 4, 5, 6, 7 4 4 5, 6, 7 3 5 6, 7 2 6 7 1 There are 21 different pairs of toppings.
Check the pairs with the formula
Use the pairs formula with 7 toppings:
Watch out: 7 × 6 = 42 counts every pair twice, once as 1 then 2 and once as 2 then 1. Keeping 42 leads to , choice D.
Bring in the sizes
Each of the 21 topping pairs can come in any of the 3 sizes. Use the counting principle:
Watch out: stopping at 21 leaves out the sizes, which gives choice B. Choice A, 6, multiplies the 3 sizes by the 2 toppings on one pizza. That does not count pizzas.
Give the answer
There are 21 topping pairs, and each one comes in 3 sizes. Cody can create 63 different pizzas. So the answer is C, 63.
Check your answer
Count one size at a time. A small pizza can have any of the 21 pairs, so there are 21 small pizzas. There are also 21 medium and 21 large ones: . That is more than the 21 pairs but fewer than 126, so it is reasonable.
More questions like this
The original DOE question
Question 3 of 45
2026 Practice Test C Math, question 12Question
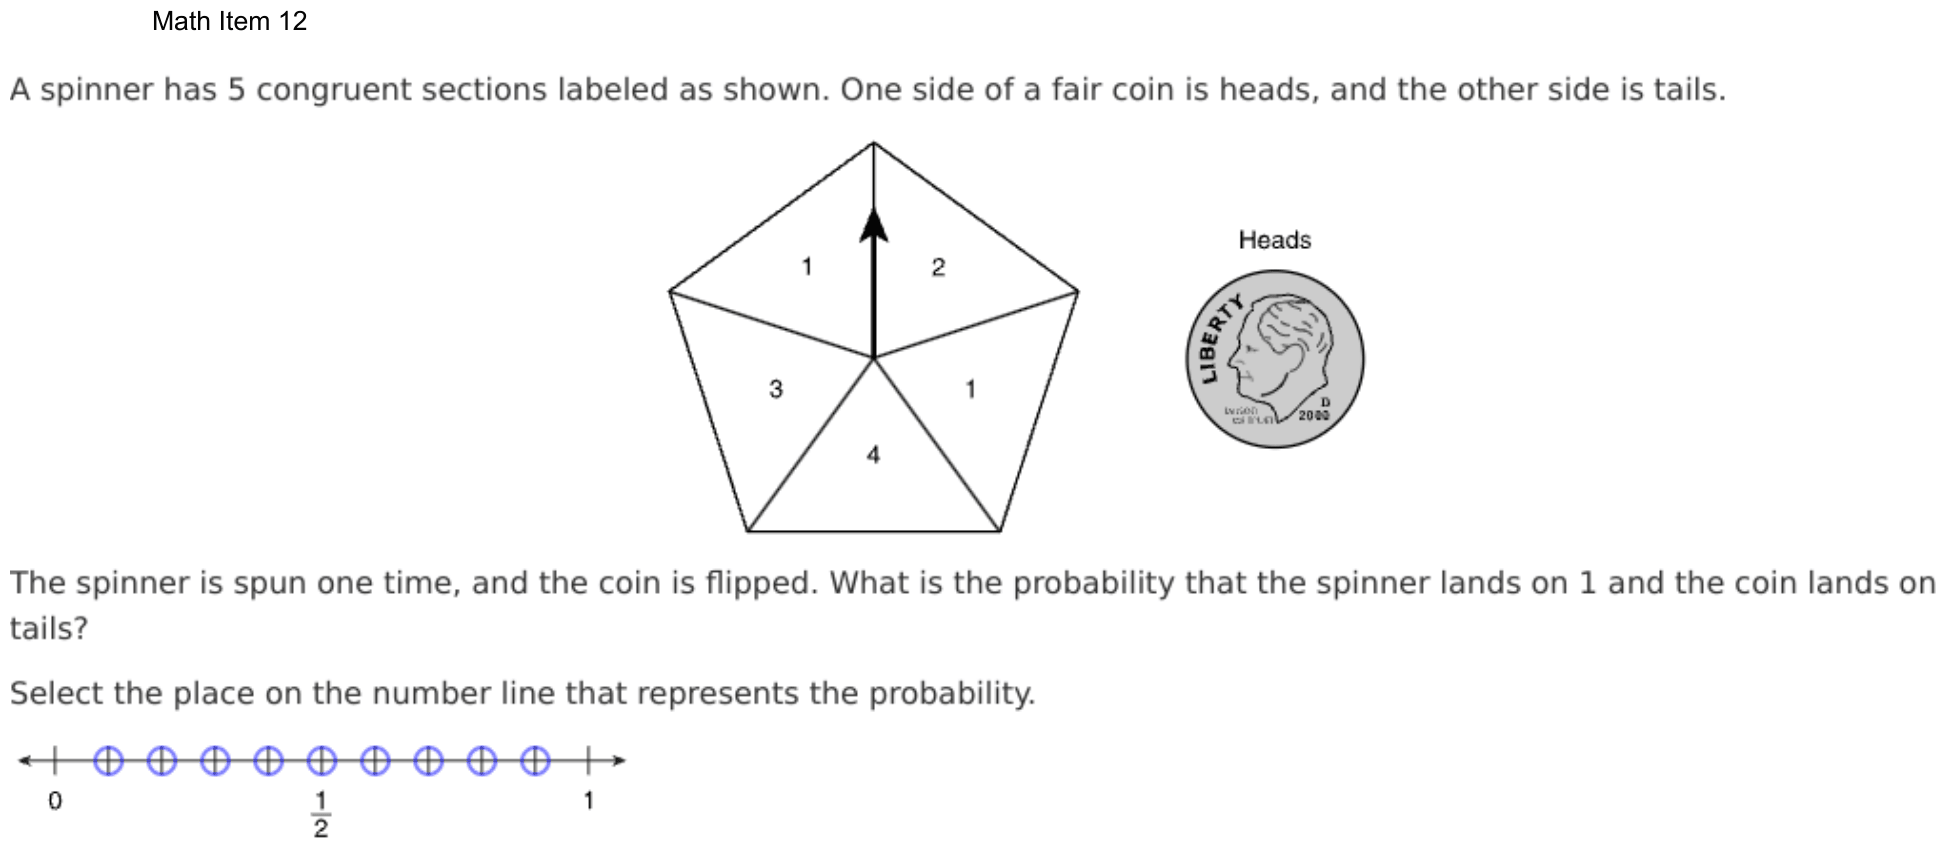
A spinner has 5 congruent sections labeled as shown. One side of a fair coin is heads, and the other side is tails.
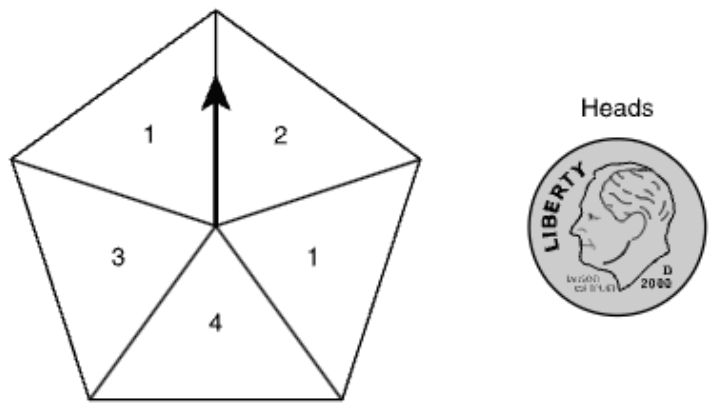
The spinner is spun one time, and the coin is flipped. What is the probability that the spinner lands on 1 and the coin lands on tails?
Select the place on the number line that represents the probability.
On the test you click a point on the number line; here, choose it from the menu.
Show the answer
Correct answer: the point 0.2
The spinner has five equal-sized sections. Two of the sections are labeled with a 1. So, the probability of landing on a 1 is two out of five, or 2/5.
A coin has two sides, one heads and one tails. So, the probability of landing on tails is one out of two, or 1/2.
The compound probability of the spinner landing on a 1 and the coin landing on tails can be calculated by multiplying 2/5 and 1/2 as shown:
Question analysis
A spinner with five equal sections is spun once and a fair coin is flipped. Students find the probability that the spinner lands on 1 and the coin shows tails, then select that point on a number line from 0 to 1. Counting the right sections and combining the two events correctly are the tricky parts.
- Grade level
- Grade 7 content, by NYS standard
- Compared with grade 7
- At grade 7 Finding the chance of two independent events together is grade 7 compound probability, here with one spinner and one coin. Counting sections from the picture and placing the result on a number line add two small steps.
- Estimated difficulty
- Moderate: several steps, or a close reading with one strong distractor.
- Thinking it demands
- Depth of knowledge 2, skills and concepts · mainly apply
- What makes it hard
- Solution
- 3 steps
- Reading level
- Question and choices: about grade 5, 59 words.
- Students, last 30 days
- Not enough answers yet to show (it takes 10).
Why it is hard, traps and wrong answers (shows the answer)
Why it is hard
The probability itself takes one multiplication of two simple fractions; the losses come before and after it. Before, the spinner has to be searched for every section labeled 1, and the coin's chance brought in as well. After, 1/5 has to be rewritten as 2/10 to find its point, since only 0, 1/2 and 1 are labeled. Checking that the result is smaller than both separate chances catches an addition.
Reading a figure, table or graph moderate Understanding the question
The two sections labeled 1, upper left and right, are not side by side, and the number line labels only 0, 1/2 and 1, so its nine points must be read as tenths. (Lesh, Post & Behr, 1987; Kirsch & Mosenthal, 1990)
Something you must already know minor Working it out
Nothing says that the chance of two independent events both happening is the product of their chances, 2/5 × 1/2, rather than their sum. (Anderson & Krathwohl, 2001)
Strategy: Count the sections labeled 1 to get the spinner's chance, take the coin's chance of tails, multiply the two because both must happen, and write the result in tenths.
Traps
- Stops one step early: A choice is a number from partway through the solution.
- Wrong operation: Adds instead of multiplying, divides the wrong way round, turns a ratio or rate upside down, or undoes a step in the wrong direction (subtracts what should be added back).
- Misreads the figure: Reads a value, label or tick spacing in a figure, table or graph wrongly.
The wrong answers, classified
0.4 Stops one step early (King et al., 2004; Gierl et al., 2017)
Finds the spinner's chance of landing on 1, two sections out of five, and plots 2/5 without multiplying by the coin's chance of tails.
0.9 Wrong operation (Hegarty, Mayer & Monk, 1995; King et al., 2004)
Adds the two chances, 2/5 + 1/2 = 9/10, instead of multiplying them, though both events must happen together.
0.1 Misreads the figure (Lesh, Post & Behr, 1987; Kirsch & Mosenthal, 1990)
Counts only one section labeled 1, so multiplies 1/5 by 1/2 and plots 1/10, missing the second 1 on the spinner.
Worked solution, step by step
Formulas used
- Probability of an event
- P is the probability, the chance that something happens. It goes from 0 (never) to 1 (always). The top counts the results you want. The bottom counts all possible results. It works when every result is equally likely, like equal sections of a spinner.
- Probability that two things both happen
- A and B are two events that do not affect each other, like a spin and a coin flip. P(A) and P(B) are their chances. Multiply them to get the chance that both happen. Needing both makes the chance smaller, never bigger.
Sort out the question
The spinner has 5 congruent sections. Congruent means the same size and shape, so each is equally likely. The coin has a heads side and a tails side. You need the chance that the spinner lands on 1 and the coin lands on tails.
Find the spinner’s chance
Two sections show 1: the upper left one and the one on the right. So 2 of the 5 equal sections give a 1:
Watch out: the two 1s are not next to each other. Counting only one gives 1/5 here, and 0.1 at the end.
Find the coin’s chance
A fair coin is equally likely to land on either side. Tails is 1 of its 2 sides:
Multiply the two chances
The spin and the flip do not affect each other, and both must happen. So multiply:
Watch out: stopping at 2/5 gives 0.4. Adding gives , or 0.9. Both are wrong.
Select the point
On the test, the number line labels only 0, 1/2 and 1. Between 0 and 1 are 9 targets, one at each tenth. 0.2 is the second target to the right of 0. On this site, choose 0.2 from the Point menu.
So the answer is the point at 0.2.
Check your answer
List every result. The spinner has 5 sections and the coin has 2 sides, so there are results, all equally likely. Just 2 of them are a 1 with tails, one for each section labeled 1. That is 2 out of 10, or 0.2.
More questions like this
The original DOE question
Question 4 of 45
2026 Practice Test C Math, question 32Question
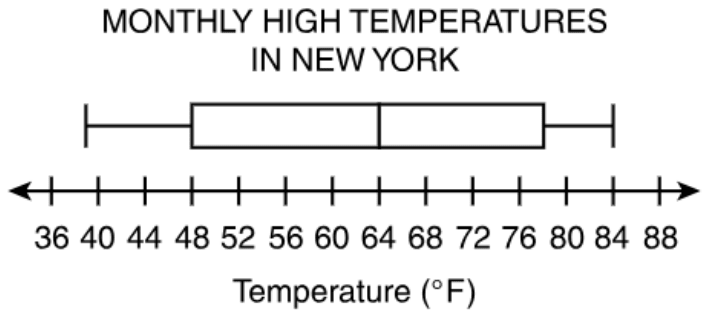
The box plot shows the average monthly high temperatures in New York City for 12 months. What is the difference between the range and the interquartile range of the temperature data?
Enter your answer in the space.
Fill-in question: work out the answer and type it as a number.
Show the answer
Correct answer: 15
Determine the range by subtracting the minimum value on the box plot from the maximum value on the box plot:
Maximum value , Minimum value
Determine the interquartile range by subtracting the lower quartile value on the box plot from the upper quartile value on the box plot:
Upper Quartile Value , Lower Quartile Value
Determine the difference between the range (45° F) and the interquartile range (30° F):
Question analysis
A box plot of New York City's average monthly high temperatures for 12 months sits above a number line labeled every 4 degrees. Students type the difference between the range and the interquartile range of the data. Two of the plot's values fall between labeled ticks, so careful reading of the scale decides the answer.
- Grade level
- Grade 7 content, by NYS standard
- Compared with grade 7
- Above grade 7 Reading a box plot and finding its interquartile range are grade 7 skills. Here two of the five values fall between ticks spaced 4 apart, and the range, the IQR and their difference must all be found and typed with no choices.
- Estimated difficulty
- Hard: combines ideas, needs a plan, and has more than one tempting wrong answer.
- Thinking it demands
- Depth of knowledge 2, skills and concepts · mainly apply
- What makes it hard
- Solution
- 3 steps
- Reading level
- Question and choices: about grade 7, 36 words.
- Students, last 30 days
- Not enough answers yet to show (it takes 10).
Why it is hard, traps and wrong answers (shows the answer)
Why it is hard
The method is standard, but the key rests on reading the scale between its labels. The axis is ticked only every 4 degrees, and the minimum and the upper quartile land off the ticks, so rounding either one to the nearest label moves the result by a degree or two with nothing to flag it. Students who find the range correctly can also stop there, entering 45, the larger of the two spreads, instead of the difference the question asks for.
Reading a figure, table or graph major Understanding the question
Two of the five values fall between ticks spaced 4 degrees apart: the left whisker ends just short of the 40 tick, at 39, and the box’s right edge sits midway between 76 and 80, at 78. (Lesh, Post & Behr, 1987; Kirsch & Mosenthal, 1990)
Many steps minor Working it out
Four values are read and combined in three subtractions, the range, the interquartile range and then their difference, so one misread value changes the final entry. (Daniel & Embretson, 2010; Enright, Morley & Sheehan, 2002)
Something you must already know minor Working it out
Neither measure is defined on the page: the range spans the whiskers, and the interquartile range is the width of the box, the upper quartile minus the lower. (Anderson & Krathwohl, 2001)
An answer in an unexpected form minor Choosing the answer
The result is typed with no choices to compare, so an entry one or two degrees off, from rounding a value to the nearest tick, looks just as finished as the right one. (Enright, Morley & Sheehan, 2002)
Strategy: Read the minimum, both quartiles and the maximum, judging where each mark falls between the ticks, then subtract for the range and for the IQR, and subtract those two results.
Traps
- Misreads the figure: Reads a value, label or tick spacing in a figure, table or graph wrongly.
- Stops one step early: A choice is a number from partway through the solution.
The wrong answers, classified
14 Misreads the figure (Lesh, Post & Behr, 1987; Kirsch & Mosenthal, 1990)
Reads the left whisker’s end as 40, the nearest labeled tick, instead of 39, so the range becomes 84 − 40 = 44 and 44 − 30 = 14.
45 Stops one step early (King et al., 2004; Gierl et al., 2017)
Finds the range, 84 − 39 = 45 degrees, and enters it, stopping before the interquartile range of 30 is subtracted from it.
17 Misreads the figure (Lesh, Post & Behr, 1987; Kirsch & Mosenthal, 1990)
Reads the box’s right edge as 76, the tick just left of it, instead of 78, so the IQR becomes 76 − 48 = 28 and 45 − 28 = 17.
Worked solution, step by step
Formulas used
- Range
- The maximum is the greatest value, at the right end of the right whisker. The minimum is the least value, at the left end of the left whisker. The range tells how far the whole set of data spreads.
- Interquartile range (IQR)
- Q3 is the upper quartile, the right edge of the box. Q1 is the lower quartile, the left edge of the box. The IQR is the width of the box. It tells how far the middle half of the data spreads.
Sort out the question
A box plot shows data with five numbers. The two whiskers are the lines on each side of the box. Their ends are the minimum, the least value, and the maximum, the greatest. The box runs from the lower quartile to the upper quartile. These are the middles of the lower half and the upper half of the data. The line inside the box is the median, the middle value.
You need the range minus the interquartile range (IQR), in degrees.
Read the values between the ticks
The ticks on the number line are 4 degrees apart. So each degree is one quarter of the space between two ticks. Three values sit right on ticks: the box’s left edge at 48, the median at 64, and the right whisker’s end at 84.
- The left whisker starts just left of the 40 tick. It sits about one quarter of the way back toward 36. So the minimum is degrees.
- The box’s right edge is halfway between 76 and 80. Halfway is 78 degrees.
Find the range
Use the range formula:
The data spread over 45 degrees.
Watch out: rounding the minimum to the 40 tick gives a range of 44. Then the final answer comes out 14, which is wrong.
Find the IQR
Use the IQR formula with the two edges of the box:
The middle half of the data spreads over 30 degrees.
Watch out: reading the box’s right edge as 76 gives an IQR of 28. Then the final answer comes out 17.
Subtract the IQR from the range
The question asks for the difference between the two:
Watch out: 45 is only the range. Do not stop there. Type only the number, with no degree sign.
So you would enter 15.
Check your answer
The range covers the whole plot, and the IQR covers only the box. So their difference is the two whiskers added together. The left whisker is degrees long. The right whisker is degrees long. , which matches.
More questions like this
The original DOE question
Question 5 of 45
2026 Practice Test C Math, question 34Question
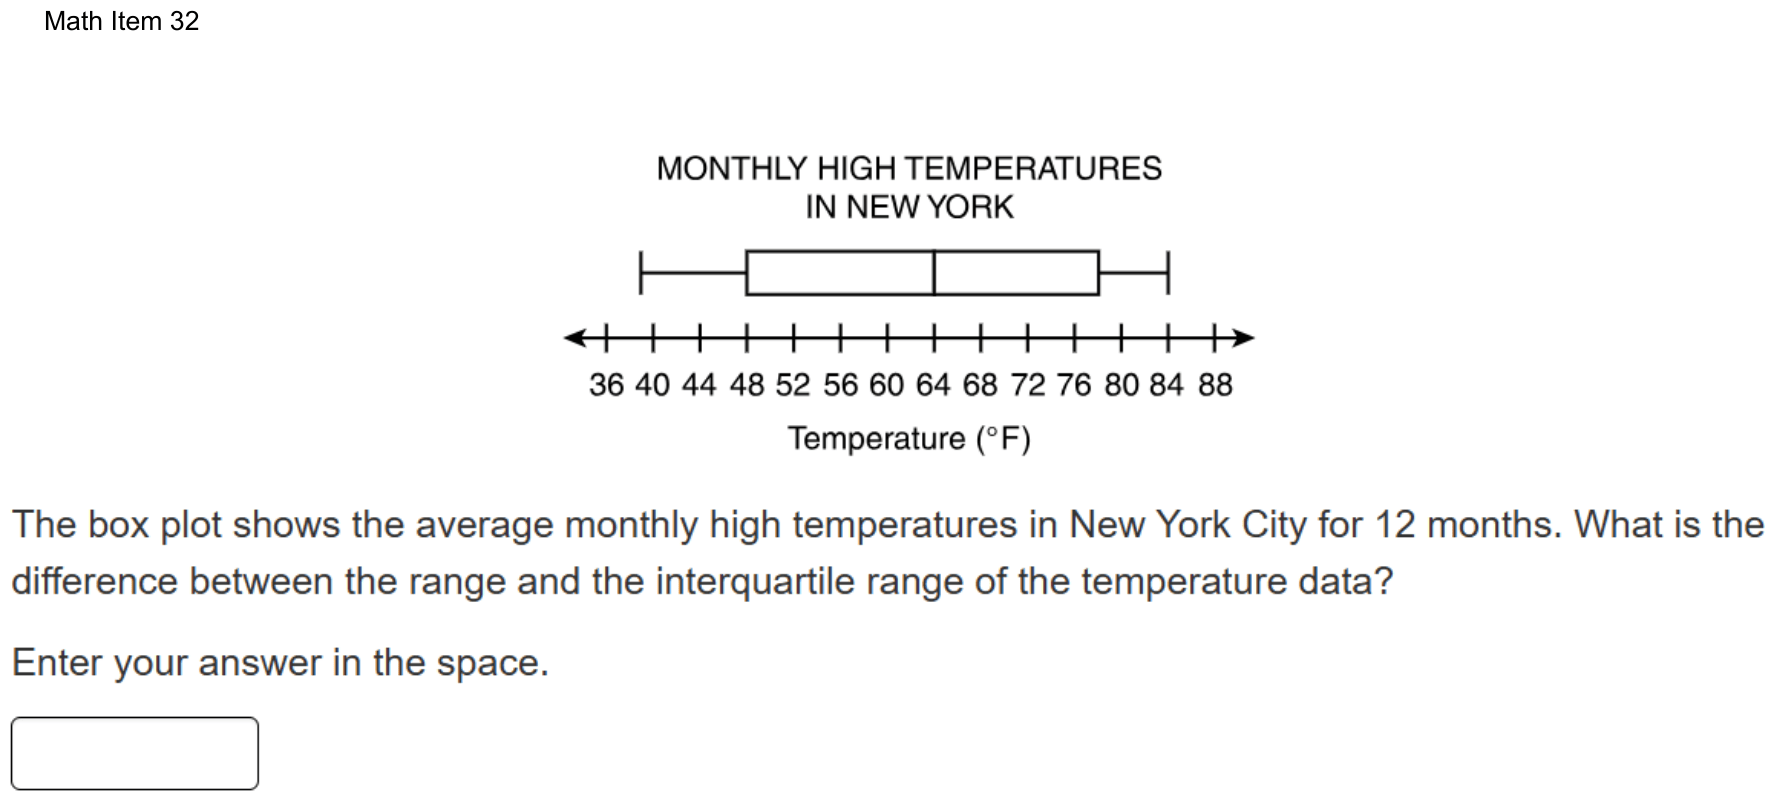
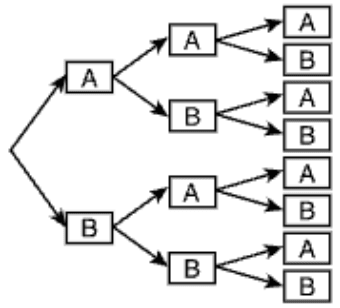
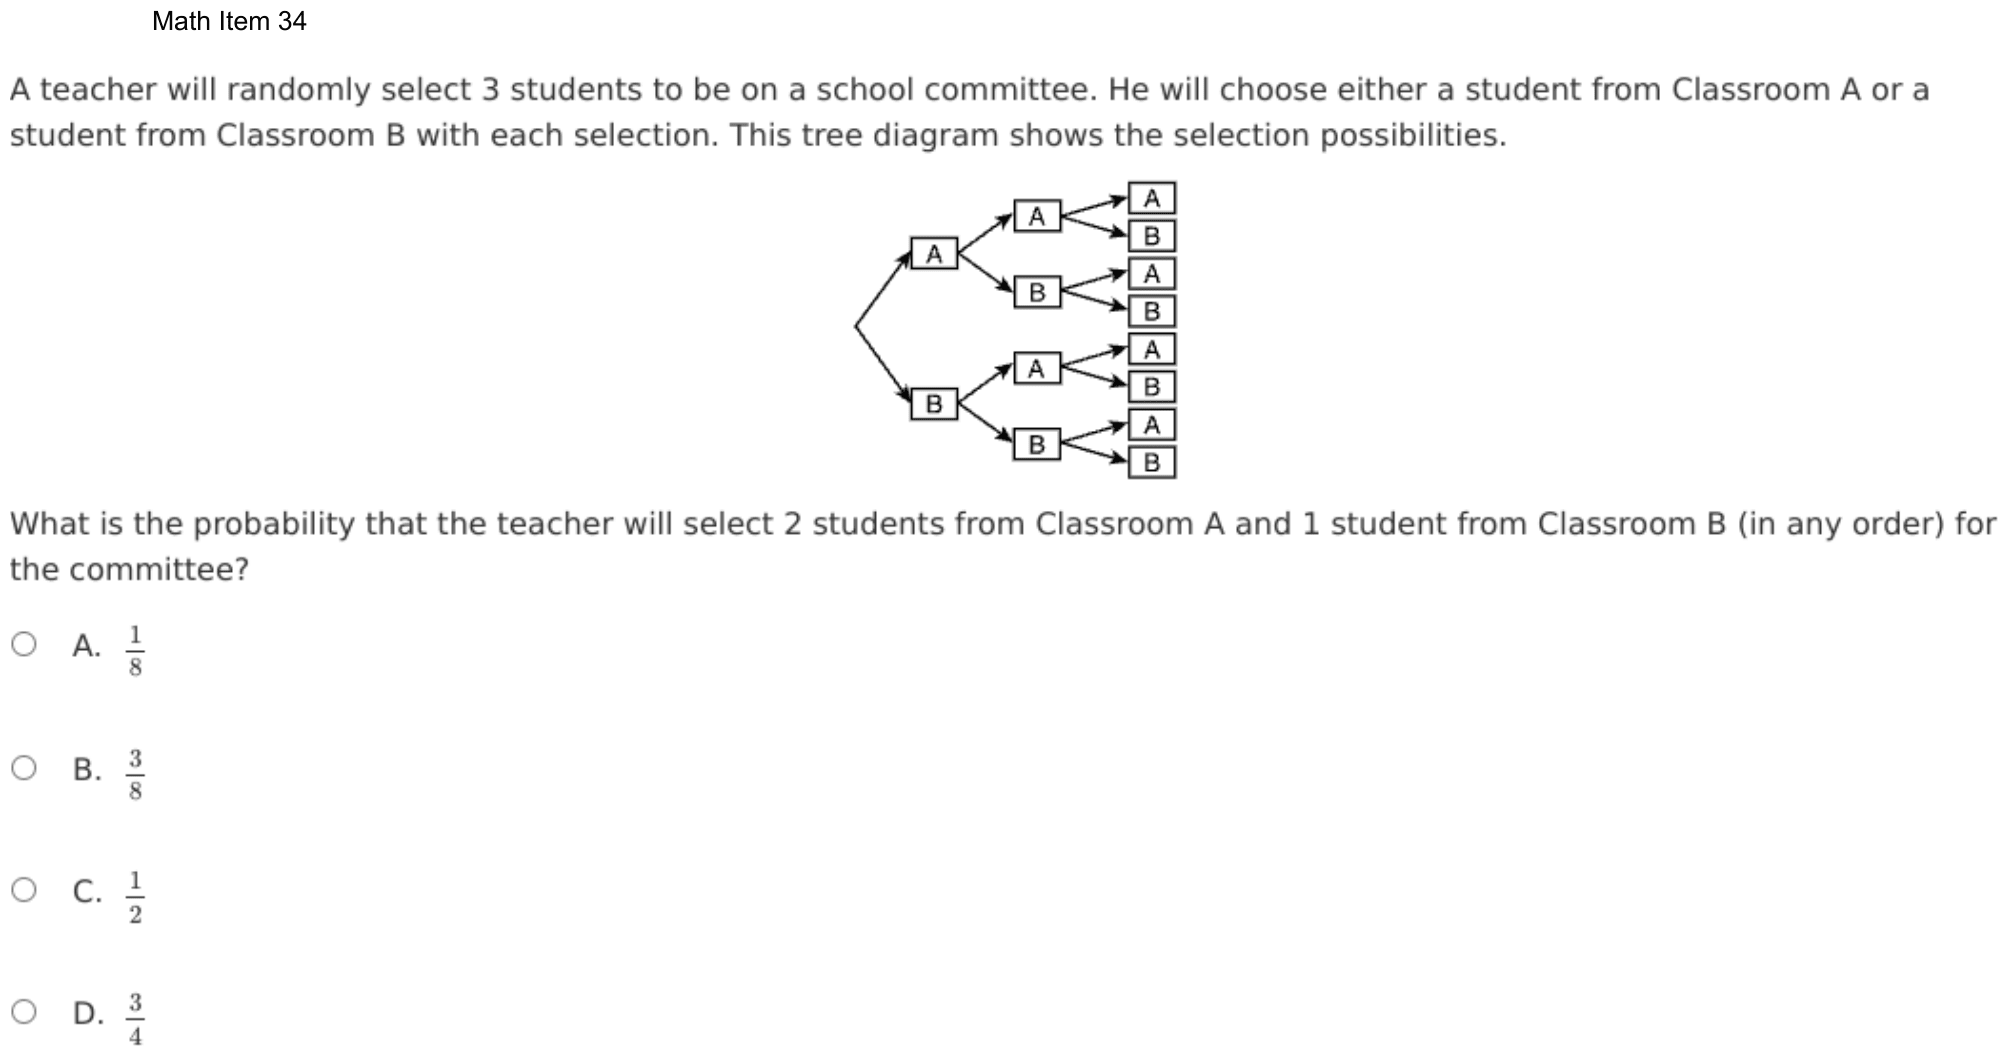
A teacher will randomly select 3 students to be on a school committee. He will choose either a student from Classroom A or a student from Classroom B with each selection. This tree diagram shows the selection possibilities.
What is the probability that the teacher will select 2 students from Classroom A and 1 student from Classroom B (in any order) for the committee?
- A
- B
- C
- D
Show the answer
Correct answer: B
The tree diagram shows that each of the 3 randomly selected students is from Classroom A or Classroom B. So the first chosen is either A or B, represented by the left column of the diagram.
The second student is either A or B, so if the first is A, the first two chosen will be either AA or AB. If the first is B, then the first two chosen will be either BA or BB, represented by the middle column.
The third student is either A or B, so if the first 2 were AA, the group of 3 would be either AAA or AAB. These outcomes are represented by the top two boxes of the right column. This pattern is followed so that 8 distinct outcomes can be visualized in order:
AAA, AAB, ABA, ABB, BAA, BAB, BBA, BBB
Since the order does not matter, there are 3 groups made up of 2 students from Classroom A and 1 student from Classroom B: AAB, ABA, and BAA.
Out of 8 possible outcomes, 3 outcomes have 2 students from Classroom A and 1 student from Classroom B. Therefore, the probability is 3 out of 8, or .
Question analysis
A teacher picks 3 students for a committee, each from Classroom A or Classroom B, and a tree diagram shows every possible sequence of picks. Students find the probability of getting 2 students from A and 1 from B in any order. Reading the tree as a list of outcomes, and counting each order, is the key.
- NYS standards
- Grade level
- Grade 7 content, by NYS standard
- Compared with grade 7
- At grade 7 Finding a compound probability from a tree diagram is a grade 7 standard, and here the tree is already drawn. Listing its paths and counting the ones that fit the event, in any order, is typical grade 7 classwork.
- Estimated difficulty
- Straightforward: two steps or one careful reading.
- Thinking it demands
- Depth of knowledge 2, skills and concepts · mainly apply
- What makes it hard
- Reading a figure, table or graph moderate
- Much to keep track of minor
- Solution
- 3 steps
- Reading level
- Question and choices: about grade 7, 65 words.
- Students, last 30 days
- Not enough answers yet to show (it takes 10).
Why it is hard, traps and wrong answers (shows the answer)
Why it is hard
The tree does the hard part of the setup, but it shows each outcome only as a path through three columns, not as a list. The parenthesis “in any order” is the key phrase: missing it leaves a single path, while reading the event loosely, as at least two from Classroom A, adds A, A, A. Writing out all eight paths and marking those with exactly two A’s settles the count.
Reading a figure, table or graph moderate Understanding the question
The tree prints only A or B in each box, so the eight three-pick outcomes, such as A, B, A, have to be read by tracing each path across all three columns. (Lesh, Post & Behr, 1987; Kirsch & Mosenthal, 1990)
Much to keep track of minor Working it out
All eight paths must be tracked while counting those with exactly two A’s and one B, and “in any order” means three of them count, not just A, A, B. (Sweller, 1988; Carpenter, Just & Shell, 1990)
Strategy: Follow each path through the tree to write out every three-letter outcome, mark the ones with exactly two A's and one B, and divide by the total number of outcomes.
Traps
- Misreads the question: Misses or misreads a condition or a word in the question: "at least", "each", "remaining", "not".
- Answers a different question: A choice is right for another quantity: the other unknown, the rest instead of the part, the part instead of the whole.
The wrong answers, classified
A Misreads the question (Hegarty, Mayer & Monk, 1995)
Counts only the path A, A, B, missing the stem’s “in any order”, so it finds 1 of the 8 outcomes instead of 3.
C Answers a different question (King et al., 2004; Hegarty, Mayer & Monk, 1995)
Counts every outcome with at least two picks from Classroom A, adding A, A, A to the three right paths, so 4 of 8, or 1/2.
D Answers a different question (King et al., 2004; Hegarty, Mayer & Monk, 1995)
Counts every outcome that mixes the two classrooms, including those with two from B, so 6 of the 8 outcomes, or 3/4.
Worked solution, step by step
Formulas used
- Probability
- P is the probability, the chance something happens. The top counts the outcomes that fit the event. The bottom counts every outcome that can happen. This works when every outcome is equally likely, like each path through this tree.
Sort out the question
The teacher picks 3 students, one at a time. Each pick is from Classroom A or Classroom B.
You need the chance of getting 2 students from A and 1 from B. The words “in any order” matter. They mean the B can be the first, second or third pick.
List every path in the tree
Each path from left to right is one outcome, or possible result. The top path is A, then A, then A. Read all of them:
AAA, AAB, ABA, ABB, BAA, BAB, BBA, BBB
Each pick has 2 choices, so there are outcomes in all.
Mark the ones that fit
Look for exactly two A’s and one B. Three outcomes fit: AAB, ABA and BAA.
Watch out: counting only AAB misses “in any order” and gives , choice A. AAA has three A’s, not two. Counting it too gives , choice C. Counting every mixed outcome gives , choice D, but three of those have two B’s.
Find the probability
Use the probability formula. 3 outcomes fit, out of 8:
So the answer is B, .
Check your answer
Count every outcome by type. Two A’s and one B: 3 outcomes. Two B’s and one A: 3 outcomes (ABB, BAB, BBA). All A’s: 1. All B’s: 1. , so each outcome was counted once.
More questions like this
The original DOE question
Question 6 of 45
2026 Practice Test C Math, question 49Question
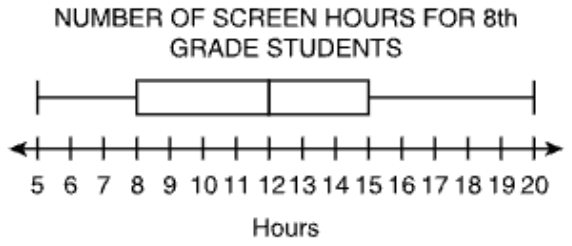
The box plot illustrates the number of hours eighth-grade students spend on screens during a typical week. What is the difference between the range and the interquartile range (IQR) of the screen time data?
Move the correct answer to each box. Not all answers will be used.
The range of screen time hours is hours.
The IQR is hours.
The difference between the range and the IQR is hours.
On the test you drag tiles into the boxes; here, choose each box’s tile from its menu. Each tile can be used once. The DOE has not published how answers with several parts are scored; this site counts one right only when every part is right.
Show the answer
Correct answer: blank 1: 15; blank 2: 7; blank 3: 8
Determine the range by subtracting the minimum value on the box plot from the maximum value on the box plot:
Maximum value , Minimum value
Determine the interquartile range by subtracting the lower quartile value on the box plot from the upper quartile value on the box plot:
Upper Quartile Value , Lower Quartile Value
Determine the difference between the range (15 hr) and the interquartile range (7 hr):
Question analysis
A box plot shows how many hours a week eighth-grade students spend on screens, on a number line marked every hour. Students move number tiles to complete three sentences: the range, the interquartile range, and the difference between them. Each tile can be used only once, and keeping the range and the interquartile range apart is the tricky part.
- Grade level
- Grade 7 content, by NYS standard
- Compared with grade 7
- At grade 7 Reading a box plot and finding its range and interquartile range are grade 7 statistics skills. The values sit on labeled whole-number ticks and the three sentences lead through the steps, a typical grade 7 task.
- Estimated difficulty
- Straightforward: two steps or one careful reading.
- Thinking it demands
- Depth of knowledge 2, skills and concepts · mainly apply
- What makes it hard
- Something you must already know minor
- Many steps minor
- Solution
- 3 steps
- Reading level
- Question and choices: about grade 4, 69 words.
- Corrected from the DOE handbook
- A missing comma in the explanation was restored.
- Students, last 30 days
- Not enough answers yet to show (it takes 10).
Why it is hard, traps and wrong answers (shows the answer)
Why it is hard
The plot is drawn on whole-hour ticks, and the three sentences lay out the steps, so this is a direct check of two definitions. The main risk is taking a value off the plot, such as the lower quartile of 8, for a spread between two values. Because the four tiles allow only one use each, a student who confuses the measures can still fill every box, which hides the error.
Something you must already know minor Working it out
The sentences name the range and the IQR but never define them; students must know the range spans the whiskers and the IQR spans only the box. (Anderson & Krathwohl, 2001)
Many steps minor Working it out
Three boxes must all be right, the third depends on the first two, and each tile can be used once, so one mix-up spreads to a second box. (Daniel & Embretson, 2010; Enright, Morley & Sheehan, 2002)
Strategy: Read the five key values off the plot, subtract the least from the greatest for the range, subtract the lower quartile from the upper for the IQR, then subtract those results.
Traps
- Misunderstands the concept: A wrong belief about a concept: that percents can be added, that area grows like length, that averages can be averaged, that a bigger denominator means a bigger fraction.
- Wrong formula: Uses a related but wrong formula: perimeter for area, diameter for radius, area for volume, or a misremembered one.
The wrong answers, classified
DCB Misunderstands the concept (Smith, diSessa & Roschelle, 1993; De Bock et al., 1998; Ni & Zhou, 2005)
Takes the lower quartile, 8, as the interquartile range, reading a value off the box instead of its width, so the difference becomes 15 − 8 = 7.
BDC Wrong formula (King et al., 2004)
Swaps the two measures, giving the box’s width, 7, as the range and the whiskers’ spread, 15, as the IQR, while the difference stays 8.
What was corrected from the DOE handbook, and why
- Explanation: The DOE’s explanation runs two values together: “Maximum value = 20 hr Minimum value = 5 hr”. Its next line is “Upper Quartile Value = 15 hr, Lower Quartile Value = 8 hr”, and Question 32’s explanation has “Maximum value = 84° F, Minimum value = 39° F”. The site adds the comma.
Worked solution, step by step
Formulas used
- Range
- The maximum is the greatest value, at the right end of the right whisker. The minimum is the least value, at the left end of the left whisker. The range tells how far the whole set of data spreads.
- Interquartile range (IQR)
- Q3 is the upper quartile, the right edge of the box. Q1 is the lower quartile, the left edge of the box. The IQR is the width of the box. It tells how far the middle half of the data spreads.
Sort out the question
The box plot shows the hours of screen time for eighth graders in a week. You need three numbers: the range, the IQR, and the difference between them.
There are four tiles: 5, 7, 8 and 15. Each tile is used at most once, and one tile is left over.
Read the five values
The number line has a tick at every hour, and every value sits on a tick:
- The left whisker starts at 5. This is the minimum.
- The box starts at 8. This is the lower quartile, the middle of the lower half of the data.
- The line inside the box is at 12. This is the median, the middle value.
- The box ends at 15. This is the upper quartile, the middle of the upper half.
- The right whisker ends at 20. This is the maximum.
Find the range
Use the range formula with the two ends of the whiskers:
The screen times spread over 15 hours, from the least to the most.
Find the IQR
Use the IQR formula with the two edges of the box:
The middle half of the students spend between 8 and 15 hours, a spread of 7 hours.
Watch out: the IQR is a width, not a point on the plot. The tile 8 is the lower quartile. Putting it in the IQR box also makes the last box 7, which is wrong.
Find the difference
Subtract the IQR from the range:
Watch out: do not swap the two measures. The range uses the whiskers’ ends, and the IQR uses only the box.
Fill in the three boxes
On the test, you drag a tile into each box. On this site, you choose each tile from its box’s menu. The range box gets 15, the IQR box gets 7, and the difference box gets 8. The tile 5 is not used.
So the boxes get 15, 7 and 8.
Check your answer
The difference is just the two whiskers added together. The left whisker is hours long. The right whisker is hours long. , which matches the third box.
More questions like this
The original DOE question
Question 7 of 45
2026 Practice Test D Math, question 5Question
In a school raffle, 1 out of every 25 students wins a prize. Each prize includes a randomly selected trading card from a set of 100 different cards, labeled C1 through C100, with each card equally likely to be chosen. If one student is selected at random, what is the probability that the student both wins a prize and receives Card C17?
Write an expression that represents the probability that a student wins the prize and receives Card C17.
Enter your answer in the space provided. Enter only your answer.
On the test you build the answer on an on-screen keypad; here, type it. Use ^ for a power, sqrt( ) or √ for a root, pi for π, and <= or >= for ≤ and ≥.
Show the answer
Correct answer: 1/25 · 1/100
To calculate the joint probability, first determine the probability of each independent event.
The probability that a randomly selected student wins the prize is .
The probability that the card in a prize is Card C17 is , because Card C17 is 1 card out of 100 labeled cards.
The probability that a student wins the prize and receives Card C17 is the product of those two probabilities, .
Question analysis
In a school raffle, 1 out of every 25 students wins a prize, and each prize includes one of 100 equally likely trading cards. Students type an expression for the probability that a randomly chosen student both wins and gets one particular card. It tests the probability of two independent events, and combining the two chances correctly is the main hurdle.
- Grade level
- Grade 7 content, by NYS standard
- Compared with grade 7
- At grade 7 Grade 7 students find compound probabilities, usually by listing outcomes for coins or number cubes. These two stages have 25 and 100 outcomes, far too many pairs to list, so a rule must be used, and the answer is typed as an expression.
- Estimated difficulty
- Straightforward: two steps or one careful reading.
- Thinking it demands
- Depth of knowledge 2, skills and concepts · mainly apply
- What makes it hard
- Solution
- 2 steps
- Reading level
- Question and choices: about grade 8, 87 words.
- Corrected from the DOE handbook
- The explanation gave the wrong event the chance 1/100; one sentence was corrected.
- Students, last 30 days
- Not enough answers yet to show (it takes 10).
Why it is hard, traps and wrong answers (shows the answer)
Why it is hard
Each chance is stated almost directly, 1 out of 25 and 1 out of 100, so the question tests one rule: both events must happen, and the chances multiply. The word “and” pulls students toward adding, which gives a result larger than either chance, a sign that something is wrong. Others write only the card's chance and forget that the student must first win a prize.
Something you must already know moderate Working it out
The question never says that the chance of two independent events both happening is the product of their chances, so students must bring that rule to the 1/25 and the 1/100 themselves. (Anderson & Krathwohl, 2001)
An answer in an unexpected form minor Choosing the answer
The answer is typed as an expression with no choices to compare, so a sum of the two chances, which looks just as finished, gets no warning on screen. (Enright, Morley & Sheehan, 2002)
Strategy: Write each event's chance as a fraction, then apply the rule for two independent events that must both happen, and check that the result is smaller than either chance alone.
Traps
- Follows a key word: Picks the operation from a single word rather than the situation: "removed" so subtract, "of" so multiply, "more" so add, when the situation needs something else.
- Stops one step early: A choice is a number from partway through the solution.
- A faulty procedure: A systematic but wrong procedure: adding fractions straight across, applying an exponent to each term of a sum, dropping a sign when moving a term.
The wrong answers, classified
1/25 + 1/100 Follows a key word (Hegarty, Mayer & Monk, 1995)
Reads “both wins a prize and receives Card C17” as a cue to add, so sums the chances, though needing both events must be less likely than either.
1/100 Stops one step early (King et al., 2004; Gierl et al., 2017)
Writes only the chance of receiving Card C17 and leaves out that the student must first be one of the 1 in 25 who win a prize.
1/125 A faulty procedure (Brown & Burton, 1978; Tatsuoka, 1983)
Combines “1 out of 25” and “1 out of 100” by adding the totals, 25 + 100, a faulty rule that gives neither the sum nor the product.
What was corrected from the DOE handbook, and why
- Explanation: The DOE’s explanation says “The probability that a randomly selected student will receive Card C17 is 1/100.” Only students who win a prize receive a card, so a randomly selected student’s chance of receiving Card C17 is the question’s own answer, 1/25 × 1/100. The 1/100 is the chance that the card in a prize is Card C17, and the site now says so. The answer is unchanged.
Worked solution, step by step
Formulas used
- Probability of one outcome
- P is the probability, the chance that something happens, from 0 to 1. The top counts the outcomes you want. The bottom counts all the outcomes that could happen. Use it when every outcome is equally likely, like one card picked from 100.
- Probability that two independent events both happen
- A and B are two events. Independent means one does not change the chance of the other. P(A) is the chance of A, and P(B) is the chance of B. Multiply them to get the chance that both happen. The result is smaller than either chance, since both things must happen.
Sort out the question
Two things must both happen. First, the student wins a prize. Second, the card in that prize is Card C17. You need an expression for that chance. An expression is a math phrase made of numbers and signs, with no equal sign. You do not have to work it out to one number.
Find the chance of winning
The question says “1 out of every 25 students wins a prize.” One student is the part that wins, and 25 is the whole group. So:
Find the chance of Card C17
Each prize has one card, picked at random from 100 cards. Every card is equally likely. Card C17 is 1 of those 100 cards:
Multiply the two chances
Winning a prize does not change which card is inside it. So the two events are independent. To find the chance that both happen, multiply:
The dot · means times. Worked out, this is 1/2500.
Watch out: the word and does not mean add here. 1/25 + 1/100 is bigger than either chance, but needing both things must be less likely. Writing only 1/100 forgets that the student must win a prize first.
Enter the expression
On the test, press the fraction key, a small box over a small box. Type 1 on top and 25 on the bottom. Move the cursor out of the fraction with the → key. Press the dot key for times. Then use the fraction key again for 1 over 100. On this site, type 1/25 * 1/100 or 1/25 · 1/100. The value 1/2500 also counts.
So you would enter 1/25 · 1/100.
Check your answer
Picture 2,500 students. 1 in 25 wins, so about 100 students win a prize. Of those 100, about 1 gets Card C17. That is 1 student out of 2,500, which matches 1/25 · 1/100 = 1/2500. It is smaller than 1/25 and 1/100, as it should be.
More questions like this
The original DOE question
Question 8 of 45
2026 Practice Test D Math, question 17Question
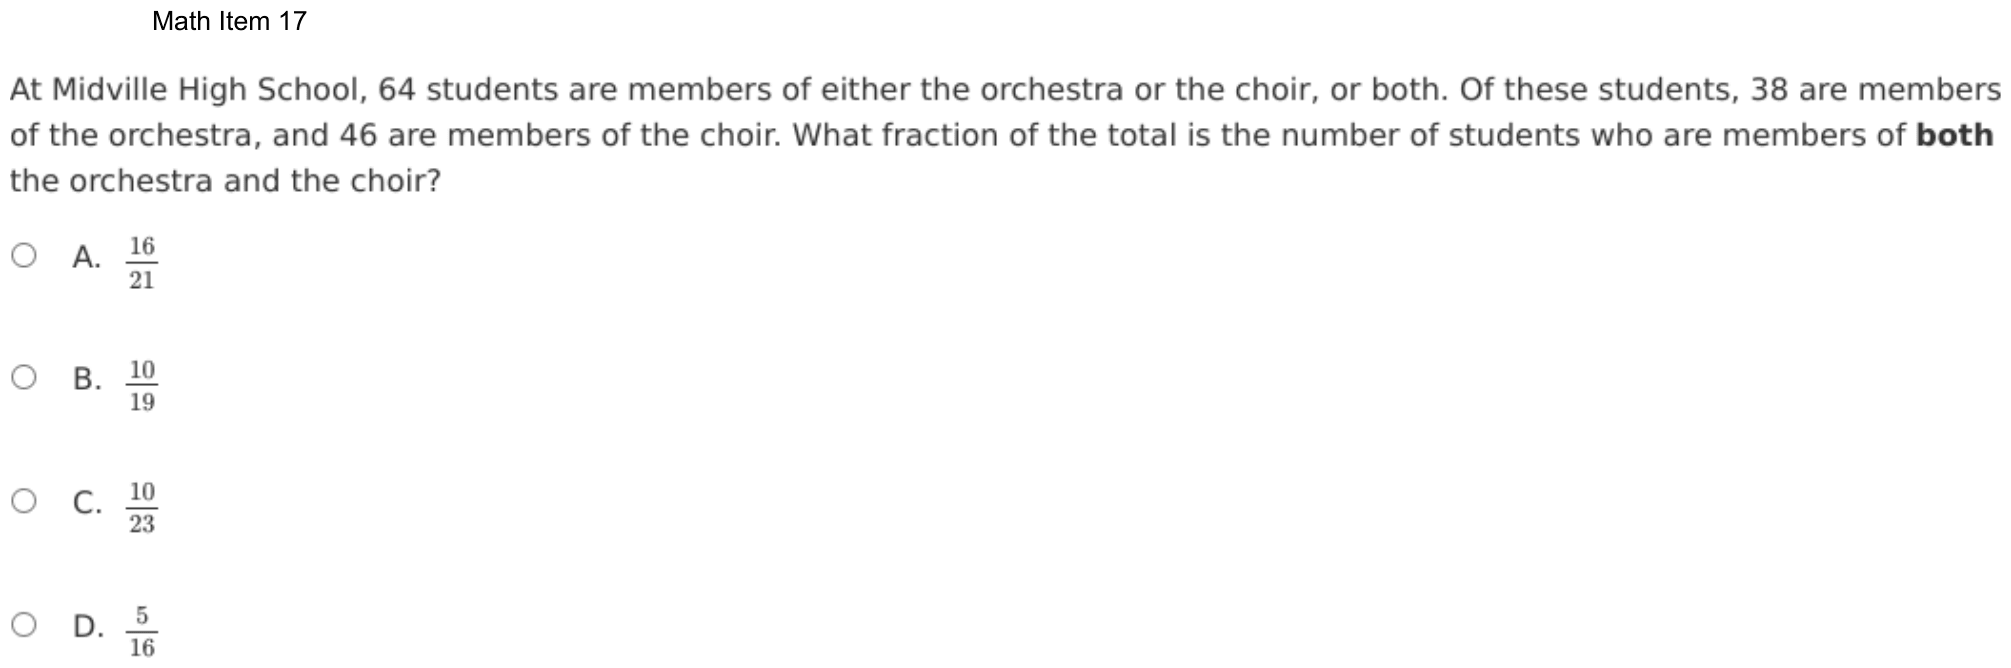
At Midville High School, 64 students are members of either the orchestra or the choir, or both. Of these students, 38 are members of the orchestra, and 46 are members of the choir. What fraction of the total is the number of students who are members of both the orchestra and the choir?
- A
- B
- C
- D
Show the answer
Correct answer: D
First, add the number of students that are members of the orchestra and the number of students that are members of the choir.
Then, subtract to find the number of students that are members of both orchestra and choir.
Then, find the fraction of the 64 students that are members of both orchestra and choir.
Question analysis
At Midville High School, 64 students belong to the orchestra, the choir or both; 38 are in the orchestra and 46 in the choir. Students find what fraction of the 64 belong to both groups. It is a Venn diagram counting question with a fraction, and the students in both groups are included in each membership number.
- Grade level
- Grade 7 content, by NYS standard
- Compared with grade 7
- At grade 7 Overlapping groups are seldom taught directly in grade 7, though the arithmetic is whole-number addition and subtraction. Students must first find the overlap and then choose the right whole for the fraction, two decisions where errors are common.
- Estimated difficulty
- Moderate: several steps, or a close reading with one strong distractor.
- Thinking it demands
- Depth of knowledge 2, skills and concepts · mainly apply
- What makes it hard
- Turning words into math moderate
- No obvious method minor
- An answer in an unexpected form minor
- Solution
- 3 steps
- Reading level
- Question and choices: about grade 5, 54 words.
- Corrected from the DOE handbook
- A misstatement in the explanation’s first step was corrected.
- Students, last 30 days
- Not enough answers yet to show (it takes 10).
Why it is hard, traps and wrong answers (shows the answer)
Why it is hard
The question hides its key number: the students in both groups appear only as the amount by which 38 + 46 overshoots 64. A sketch of two overlapping circles, with 20 in the middle, 18 in orchestra only and 26 in choir only, shows the whole group at once. After that, the remaining risk is the denominator, since the question asks for a fraction of all 64 students, not of one group.
Turning words into math moderate Understanding the question
“Either the orchestra or the choir, or both” means the 64 counts each student once, while 38 + 46 counts the students in both groups twice; the overlap itself is never stated. (Hegarty, Mayer & Monk, 1995; Koedinger & Nathan, 2004)
No obvious method minor Working it out
Nothing names the step that finds the overlap: the excess of 38 + 46 = 84 over 64 is the number in both groups, an idea students must bring themselves. (Schoenfeld, 1985)
An answer in an unexpected form minor Choosing the answer
The fraction 20/64 appears only in lowest terms, so it must be simplified by 4 before it can be matched with a choice. (Enright, Morley & Sheehan, 2002)
Strategy: Add the orchestra and choir counts, subtract the 64 students to find how many were counted twice, then put that number over the total and simplify.
Traps
- Answers a different question: A choice is right for another quantity: the other unknown, the rest instead of the part, the part instead of the whole.
- Overlapping groups: Things in two groups at once are counted twice, or not subtracted.
The wrong answers, classified
A Overlapping groups (King et al., 2004)
Takes 38 + 46 = 84 as the number of students, counting those in both groups twice, and puts the stated 64 over it to get 16/21.
B Answers a different question (King et al., 2004; Hegarty, Mayer & Monk, 1995)
Finds the 20 students in both groups but compares them with the 38 orchestra members instead of all 64 students, so 20/38 = 10/19.
C Answers a different question (King et al., 2004; Hegarty, Mayer & Monk, 1995)
Finds the 20 students in both groups but divides by the 46 choir members, using one group as the whole instead of all 64, so 20/46 = 10/23.
What was corrected from the DOE handbook, and why
- Explanation: The DOE’s explanation begins “First, add the number of students that are members of both orchestra and choir. 38 + 46 = 84.” But 38 is the number of orchestra members and 46 the number of choir members; the number of students in both is what the next step finds (84 − 64 = 20). The site now says “First, add the number of students that are members of the orchestra and the number of students that are members of the choir.”
Worked solution, step by step
Formulas used
- Counting two groups that overlap
- O is the number in the orchestra, and C is the number in the choir. Students in both groups are counted in O and again in C. Subtracting them once makes each student count one time. Here every student is in at least one group, so this gives everyone.
- Fraction of a total
- The part is the group you are asked about. The whole is the full group it comes from. Here the part is the students in both groups, and the whole is all 64 students. Simplify by dividing the top and bottom by the same number.
Sort out the question
There are 64 students in all. Each one is in the orchestra, the choir or both. 38 are in the orchestra, and 46 are in the choir. Some students are in both, but the question does not say how many. You need that number as a fraction of all 64 students.
Add the two groups
Add the number in the orchestra and the number in the choir:
That is more than the 64 students there are. Why? A student in both groups is counted once with the orchestra and once more with the choir.
Find the students in both
The extra amount over 64 is the students who were counted twice:
So 20 students are in both groups. This is the overlap rule turned around: both = O + C − total.
Watch out: 84 is not the number of students. Putting 64 over 84 gives 16/21, choice A.
Write the fraction and simplify
The part is 20 students, and the whole is all 64 students. Both numbers divide by 4:
Watch out: the whole is all 64 students, not one group. Using 38 gives 10/19, choice B. Using 46 gives 10/23, choice C.
So the answer is D, .
Check your answer
Split the 64 students into three groups that do not overlap. Only orchestra: 38 − 20 = 18. Only choir: 46 − 20 = 26. Both: 20. Add them: 18 + 26 + 20 = 64. That matches the total, so 20 is right.
More questions like this
The original DOE question
Question 9 of 45
2026 Practice Test D Math, question 29Question
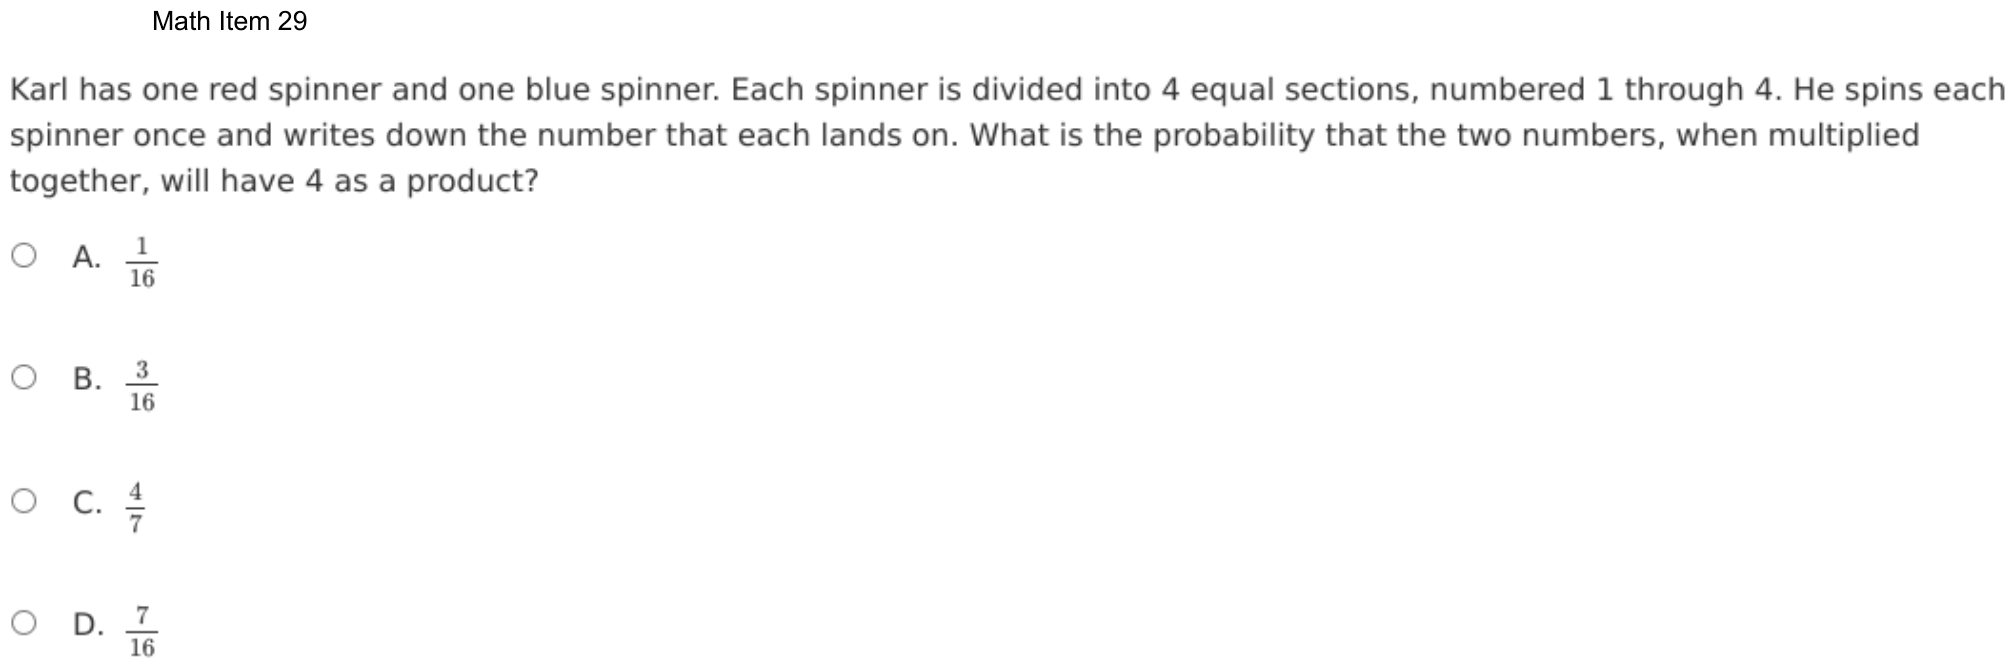
Karl has one red spinner and one blue spinner. Each spinner is divided into 4 equal sections, numbered 1 through 4. He spins each spinner once and writes down the number that each lands on. What is the probability that the two numbers, when multiplied together, will have 4 as a product?
- A
- B
- C
- D
Show the answer
Correct answer: B
There are four possible outcomes for each spin of the spinner:
1, 2, 3, 4
The possible outcomes of two spins are:
Of the 16 possible outcomes, only 3 pairings have a product of 4: 14, 22, and 41.
Therefore, the probability that the two numbers resulting from two consecutive spins have a product of 4 is .
Question analysis
Karl spins a red spinner and a blue spinner, each with four equal sections numbered 1 to 4, and multiplies the two results. This compound probability question asks for the chance that the product is 4. Students build the sample space of outcomes, and listing every pair rather than the ones that come to mind is the safe route.
- NYS standards
- Grade level
- Grade 7 content, by NYS standard
- Compared with grade 7
- At grade 7 Finding a compound probability from a list or table of equally likely outcomes is standard grade 7 work. Two four-section spinners give a small sample space that is quick to write out, and the event needs one careful scan of the products.
- Estimated difficulty
- Moderate: several steps, or a close reading with one strong distractor.
- Thinking it demands
- Depth of knowledge 2, skills and concepts · mainly apply
- What makes it hard
- Something you must already know moderate
- Much to keep track of minor
- Solution
- 3 steps
- Reading level
- Question and choices: about grade 5, 52 words.
- Students, last 30 days
- Not enough answers yet to show (it takes 10).
Why it is hard, traps and wrong answers (shows the answer)
Why it is hard
The question is decided by the count of favorable outcomes, not by any calculation. Students who think of 4 only as 2 × 2 find one outcome, and those who think in factor pairs find two, which is not a listed choice and should send them back to the table. A 4-by-4 grid of products, red down the side and blue across, shows all three cells at once.
Something you must already know moderate Working it out
Nothing in the stem says that red 1 with blue 4 and red 4 with blue 1 are separate outcomes, or that two four-part spinners give 16 equally likely pairs. (Anderson & Krathwohl, 2001)
Much to keep track of minor Working it out
All 16 pairs must be scanned for a product of 4, and the two pairs that use 1 and 4 are easy to miss beside the obvious 2 times 2. (Sweller, 1988; Carpenter, Just & Shell, 1990)
Strategy: Make a 4-by-4 table with the red spinner's numbers down the side and the blue spinner's across the top, write each product in its cell, and count the cells that match.
Traps
- Misreads the question: Misses or misreads a condition or a word in the question: "at least", "each", "remaining", "not".
- Stops one step early: A choice is a number from partway through the solution.
The wrong answers, classified
A Stops one step early (King et al., 2004; Gierl et al., 2017)
Finds only the double, 2 and 2, and stops, missing the two outcomes in which a 1 on one spinner meets a 4 on the other.
C Little reason to choose it (Haladyna & Downing, 1993; Rodriguez, 2005)
No count of the 16 outcomes gives a denominator of 7, so 4/7 has no working behind it and mostly attracts guesses.
D Misreads the question (Hegarty, Mayer & Monk, 1995)
Counts the 7 outcomes in which either spinner shows a 4, reading “4 as a product” as a pair that simply contains a 4.
Worked solution, step by step
Formulas used
- Probability of an event
- P is the probability, the chance that something happens. An outcome is one possible result. This works when every outcome is equally likely, like landing on equal sections of a spinner.
- Counting outcomes of two actions
- a is the number of results for the first action, and b is the number for the second. Each result of the first can go with each result of the second, so you multiply.
Sort out the question
Karl spins two spinners, one red and one blue. Each has 4 equal sections, numbered 1 to 4. He multiplies the two numbers. You need the probability that the product, the answer to a multiplication, is 4.
Count all the outcomes
The red spinner has 4 results, and so does the blue one. Each red result can go with each blue result:
So there are 16 outcomes, all equally likely. Red 1 with blue 4 is not the same as red 4 with blue 1. They come from different spinners.
Make a table of products
Write each product in a table. Red goes down the side and blue goes across the top.
Red × Blue 1 2 3 4 1 1 2 3 4 2 2 4 6 8 3 3 6 9 12 4 4 8 12 16 Three cells show 4: red 1 with blue 4, red 2 with blue 2, and red 4 with blue 1.
Watch out: thinking of 4 only as 2 × 2 finds one outcome. That gives 1/16, choice A.
Find the probability
Use the probability rule. Three outcomes give 4, out of 16 in all:
Watch out: 7 outcomes have a 4 on at least one spinner. But that counts pairs that show a 4, not pairs whose product is 4. That mistake gives 7/16, choice D.
So the answer is B, .
Check your answer
List the ways to multiply two numbers from 1 to 4 and get 4: , and . That is 3 ways. The table has 16 cells, and 13 of them are not 4. So a small chance like 3/16 makes sense.
More questions like this
The original DOE question
Question 10 of 45
2026 Practice Test D Math, question 34Question
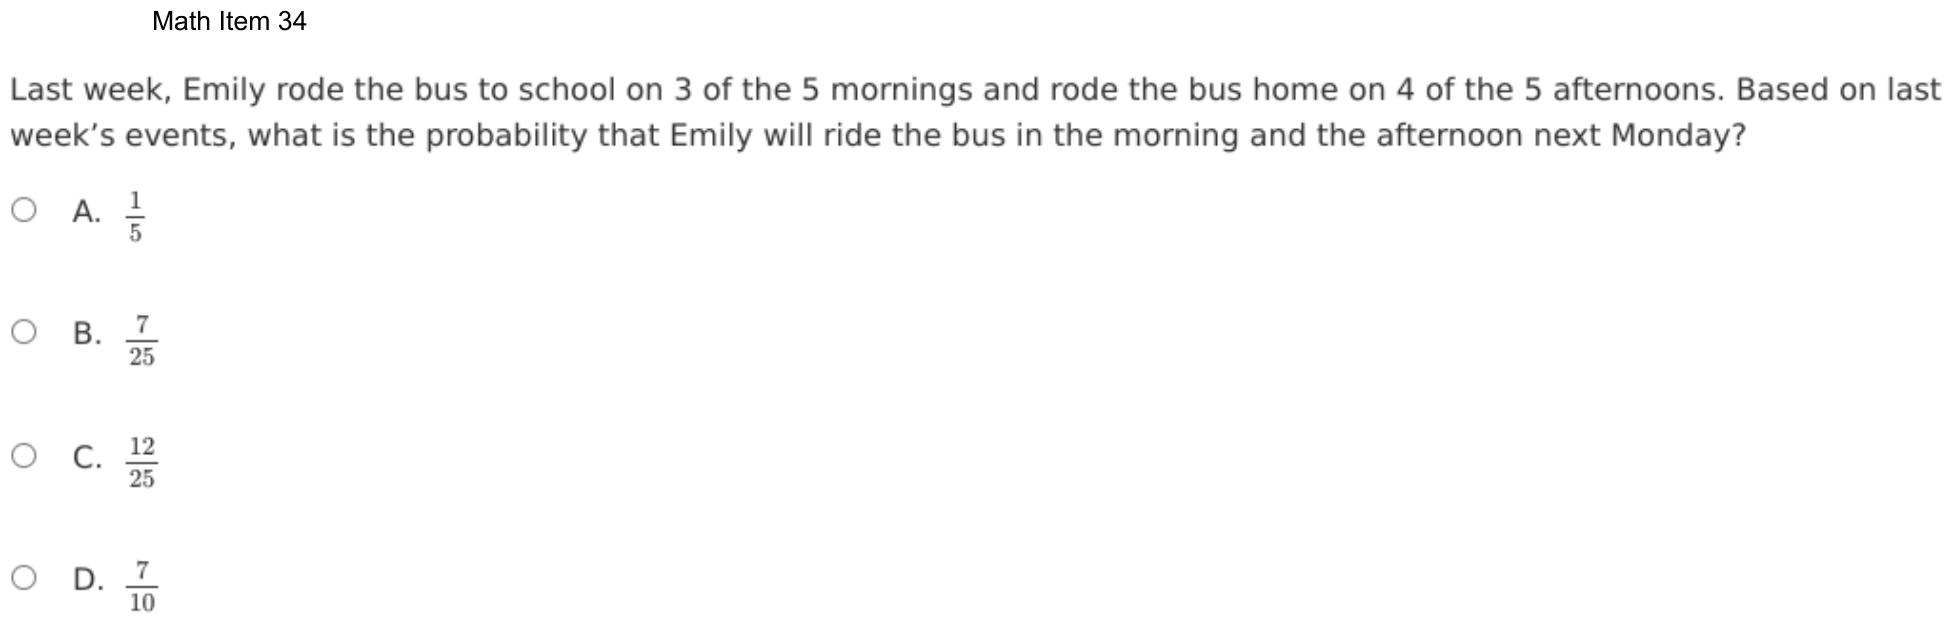
Last week, Emily rode the bus to school on 3 of the 5 mornings and rode the bus home on 4 of the 5 afternoons. Based on last week’s events, what is the probability that Emily will ride the bus in the morning and the afternoon next Monday?
- A
- B
- C
- D
Show the answer
Correct answer: C
Using the joint probability formula, find the product of the two independent events. The probability that Emily will ride the bus to school on any given morning is . The probability that Emily will ride the bus home on any given afternoon is . Therefore, the probability that Emily will ride the bus in the morning and the afternoon is .
Question analysis
Last week Emily rode the bus to school on 3 of 5 mornings and home on 4 of 5 afternoons. This probability question asks how likely she is to ride the bus both ways next Monday, based on those frequencies. Students turn each count into a probability and combine the two, deciding how chances join when both events must happen.
- NYS standards
- Grade level
- Grade 7 content, by NYS standard
- Compared with grade 7
- At grade 7 Compound probability is grade 7 work, often done with a table of outcomes. Each chance here comes from one week's frequencies, and joining the morning and afternoon events in one step is about the usual grade 7 demand.
- Estimated difficulty
- Moderate: several steps, or a close reading with one strong distractor.
- Thinking it demands
- Depth of knowledge 2, skills and concepts · mainly apply
- What makes it hard
- Something you must already know moderate
- Turning words into math minor
- Solution
- 3 steps
- Reading level
- Question and choices: about grade 5, 48 words.
- Corrected from the DOE handbook
- An inaccurate detail in the explanation was corrected.
- Students, last 30 days
- Not enough answers yet to show (it takes 10).
Why it is hard, traps and wrong answers (shows the answer)
Why it is hard
Once the two chances are written, the question is how they combine. Pooling the week into 7 bus rides out of 10 trips, or adding fractions in some way, gives listed choices that look reasonable, since each lies between 0 and 1. Picturing the 25 pairings of a morning with an afternoon, 3 × 4 = 12 of which have both rides, shows why the chances multiply.
Something you must already know moderate Working it out
The rule that two independent events both happen with the product of their chances, 3/5 times 4/5, is not given, and “the morning and the afternoon” is the only signal for it. (Anderson & Krathwohl, 2001)
Turning words into math minor Understanding the question
The counts “3 of the 5 mornings” and “4 of the 5 afternoons” have to become two separate probabilities based on last week, not one pool of 10 trips. (Hegarty, Mayer & Monk, 1995; Koedinger & Nathan, 2004)
Strategy: Turn each count into a probability, then multiply them, since both rides must happen; picturing a table of 5 mornings by 5 afternoons shows why multiplying works.
Traps
- Misunderstands the concept: A wrong belief about a concept: that percents can be added, that area grows like length, that averages can be averaged, that a bigger denominator means a bigger fraction.
- A faulty procedure: A systematic but wrong procedure: adding fractions straight across, applying an exponent to each term of a sum, dropping a sign when moving a term.
- Wrong operation: Adds instead of multiplying, divides the wrong way round, turns a ratio or rate upside down, or undoes a step in the wrong direction (subtracts what should be added back).
The wrong answers, classified
A Wrong operation (Hegarty, Mayer & Monk, 1995; King et al., 2004)
Subtracts the morning chance from the afternoon chance, 4/5 − 3/5 = 1/5, an operation with no meaning for two rides that must both happen.
B A faulty procedure (Brown & Burton, 1978; Tatsuoka, 1983)
Adds the numerators, 3 + 4, but multiplies the denominators, 5 × 5, mixing the rule for adding fractions with the rule for multiplying them.
D Misunderstands the concept (Smith, diSessa & Roschelle, 1993; De Bock et al., 1998; Ni & Zhou, 2005)
Pools the week’s trips into 7 bus rides out of 10, a rate for a single trip, as if riding both ways next Monday were just as likely.
What was corrected from the DOE handbook, and why
- Explanation: The DOE’s explanation says “The probability that Emily will ride the bus to school on any given afternoon is 4/5.” The question says she rode the bus home on 4 of the 5 afternoons; her rides to school are the morning ones. The site now says “ride the bus home on any given afternoon”.
Worked solution, step by step
Formulas used
- Probability from past results
- P is the probability, the chance something happens. You use what happened before to predict the chance it happens again. Emily rode in 3 of 5 mornings, so the chance for one morning is 3/5.
- Both of two independent events
- A and B are two events. Independent means one does not change the chance of the other. To find the chance that both happen, multiply their chances. The result is smaller than either one, since both must happen.
Sort out the question
Last week Emily:
- rode the bus to school on 3 of the 5 mornings;
- rode the bus home on 4 of the 5 afternoons.
You need the chance that she rides the bus in the morning and in the afternoon next Monday. The word and means both rides must happen.
Write each chance
Use last week to find each chance:
- Bus to school on a morning:
- Bus home on an afternoon:
Keep them apart. The morning rides go to school, and the afternoon rides go home.
Multiply the two chances
Both rides must happen, so multiply:
Why multiply? Pair each of the 5 mornings with each of the 5 afternoons. That makes 25 pairs. In of them, she rides both times. So the chance is 12 out of 25.
Avoid the tempting wrong choices
Watch out: pooling the week gives 7 rides out of 10 trips, or 7/10, choice D. That is the chance for one trip, not for two trips on one day.
Adding the tops but multiplying the bottoms gives 7/25, choice B. Subtracting the chances gives 1/5, choice A.
So the answer is C, .
Check your answer
The chance of both rides must be less than the chance of each ride alone. As decimals, 12/25 = 0.48. That is less than 3/5 = 0.6 and 4/5 = 0.8. Choice D, 7/10 = 0.7, is more than 3/5, so it cannot be right.
More questions like this
The original DOE question
Question 11 of 45
2026 Practice Test D Math, question 35Question
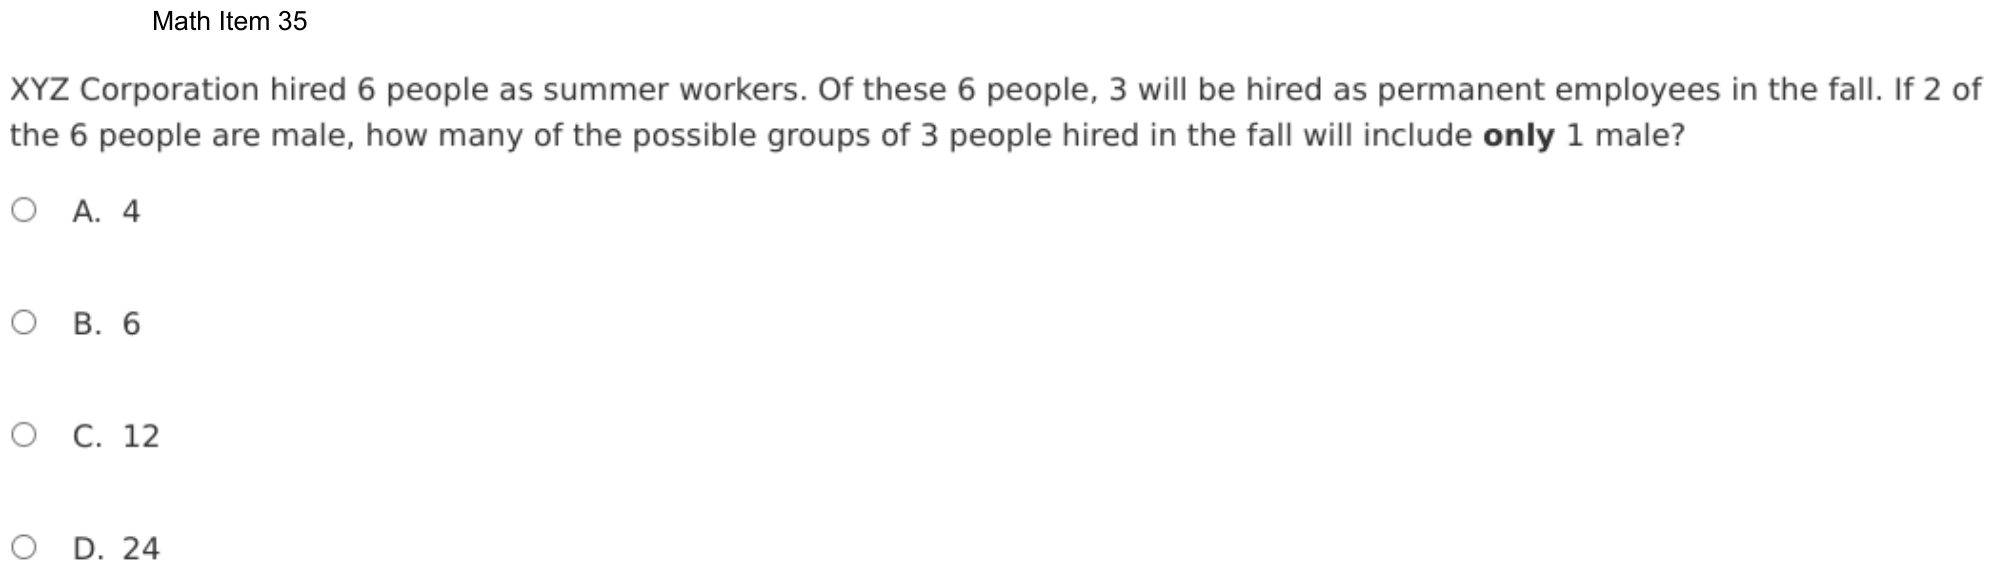
XYZ Corporation hired 6 people as summer workers. Of these 6 people, 3 will be hired as permanent employees in the fall. If 2 of the 6 people are male, how many of the possible groups of 3 people hired in the fall will include only 1 male?
- A4
- B6
- C12
- D24
Show the answer
Correct answer: C
An organized list can be used to determine the number of groups of 3 people that include only 1 male.
Let the letters A, B, C, and D represent the females, and let the numbers 1 and 2 represent the males.
Then, create a list of all possible combinations of 3 people with only 1 male.
AB1, AB2, AC1, AC2, AD1, AD2
BC1, BC2, BD1, BD2
CD1, CD2
There are 12 possible groups with only 1 male.
Question analysis
A company hired 6 summer workers, 2 of them male, and will keep 3 as permanent employees in the fall. This counting question asks how many possible groups of 3 include only 1 male. Students count combinations where order does not matter, and the bold word only, with two kinds of workers to combine, makes careful listing essential.
- NYS standards
- 7.SP.8b sample spaces for compound events
- Grade level
- Grade 7 content, by NYS standard
- Compared with grade 7
- Above grade 7 Grade 7 students list outcomes with organized lists and tree diagrams, usually ordered ones. Counting unordered groups of three under an "only one" condition, built from two kinds of people, goes beyond that typical work.
- Estimated difficulty
- Hard: combines ideas, needs a plan, and has more than one tempting wrong answer.
- Thinking it demands
- Depth of knowledge 2, skills and concepts · mainly apply
- What makes it hard
- Combines ideas moderate
- Something you must already know minor
- Turning words into math minor
- Solution
- 3 steps
- Reading level
- Question and choices: about grade 7, 41 words.
- Students, last 30 days
- Not enough answers yet to show (it takes 10).
Why it is hard, traps and wrong answers (shows the answer)
Why it is hard
The question hides a two-stage count in a hiring story. Students tend to get one stage right and forget the other: they count the pairs of women and stop, or they count ordered picks and so find every group twice. Naming the women A to D and the men 1 and 2, then listing the pairs of women alphabetically with each man attached, makes every group visible and checkable.
Combines ideas moderate Working it out
Two counts are joined: the 6 ways to pick 2 of the 4 women, then the 2 ways to pick the man, and the total is their product. (Embretson, 1998; Daniel & Embretson, 2010)
Something you must already know minor Working it out
Students must already know that a group is the same whichever order its members are named, so picking one woman and then another repeats the reverse pick. (Anderson & Krathwohl, 2001)
Turning words into math minor Understanding the question
The bold word only means exactly one man, so the other two places in each group of 3 must go to two of the 4 women, a step the stem leaves unsaid. (Hegarty, Mayer & Monk, 1995; Koedinger & Nathan, 2004)
Strategy: Name the women A to D and the men 1 and 2, list every pair of women without repeats, then attach each man to each pair and count the groups.
Traps
- Stops one step early: A choice is a number from partway through the solution.
- Overlapping groups: Things in two groups at once are counted twice, or not subtracted.
The wrong answers, classified
A Numbers taken from the question (Hegarty, Mayer & Monk, 1995)
Multiplies the 2 men by the 2 places left for women, 2 × 2 = 4, using numbers from the question without listing a single group.
B Stops one step early (King et al., 2004; Gierl et al., 2017)
Counts the 6 pairs of women correctly but stops before pairing each one with either of the 2 men, which doubles the count.
D Overlapping groups (King et al., 2004)
Counts ordered picks of the two women, 4 × 3 = 12 instead of 6, so each group appears twice, then doubles for the men to reach 24.
Worked solution, step by step
Formulas used
- Counting with two choices
- Each way of picking the man can go with each way of picking the two women. So you multiply the two counts. It is like outfits: 2 shirts with 6 pairs of pants make 12 outfits.
Sort out the question
Six people work for the summer. Two are male, so the other 4 are female. Three will be hired in the fall.
You need the number of groups of 3 with only 1 male. That means exactly 1 man and 2 women. In a group, order does not matter. Ann, Bea and Carl is the same group as Carl, Ann and Bea.
Give each person a name
Call the women A, B, C and D. Call the men 1 and 2. Every group you want has 2 letters and 1 number, like AB1.
List the pairs of women
List each pair once. Start with A, then pair B only with letters after it, and so on:
- AB, AC, AD
- BC, BD
- CD
That is 6 pairs. BA is not new, since it is the same pair as AB.
Watch out: counting the order gives pairs, each one twice. Then doubling for the men gives 24, choice D.
Add a man to each pair
Each pair of women can go with man 1 or man 2. Use the counting rule:
Watch out: stopping at the 6 pairs of women leaves out the men. That gives 6, choice B.
So the answer is C, 12.
Check your answer
Write out every group. With man 1: AB1, AC1, AD1, BC1, BD1, CD1. With man 2: AB2, AC2, AD2, BC2, BD2, CD2. Each list has 6 groups, and . No group repeats, and each has just one man.
More questions like this
The original DOE question
Question 12 of 45
2026 Practice Test D Math, question 38Question
Melissa has a bag of marbles that are all the same size. The bag contains three red (R) marbles, three green (G) marbles, and two white (W) marbles. For an experiment, she will take two marbles out of the bag without looking. Which list shows the sample space for Melissa’s experiment?
- AR, G, W
- BRG, RW, GW
- CR, R, R, G, G, G, W, W
- DRR, RG, RW, GG, GW, WW
Show the answer
Correct answer: D
The sample space of a random experiment is the collection of all possible outcomes. For this experiment, R represents a red marble, G represents a green marble, and W represents a white marble.
Since two marbles are being drawn, the possible outcomes for the first marble drawn are R, G, W.
List the possible results for each initial outcome combined with the second choice of marble. For example, if the first marble and second marble are both red, the sample space will include RR (red, red).
RR, RG, RW
GR, GG, GW
WR, WG, WW
Since order does not matter in this selection, remove any pairing that presents a duplicate choice, such as RG and GR—only one of the two pairings will be included in the sample space. Those are removed and leave a sample space of:
RR, RG, RW, GG, GW, WW
Question analysis
A bag holds three red, three green and two white marbles, and Melissa will take out two without looking. This probability question asks which list shows the sample space for her experiment. Students must know what a sample space is and what one outcome of drawing two marbles looks like, then decide which color pairs are possible.
- NYS standards
- 7.SP.8b sample spaces for compound events
- Grade level
- Grade 7 content, by NYS standard
- Compared with grade 7
- At grade 7 Representing the sample space of a compound event is a named grade 7 skill. Nothing is computed here; the demand is knowing what one outcome of drawing two marbles looks like and which pairs the bag allows, much as in grade 7 classwork.
- Estimated difficulty
- Moderate: several steps, or a close reading with one strong distractor.
- Thinking it demands
- Depth of knowledge 2, skills and concepts · mainly understand
- What makes it hard
- Something you must already know moderate
- A very close wrong answer moderate
- Solution
- 2 steps
- Reading level
- Question and choices: about grade 3, 71 words.
- Students, last 30 days
- Not enough answers yet to show (it takes 10).
Why it is hard, traps and wrong answers (shows the answer)
Why it is hard
The question tests a definition more than a skill, and three choices describe something real: the colors of one marble, the contents of the bag, and the pairs of different colors. The strongest pull comes from treating the colors as three single objects, which leaves out the pairs of one color although the bag holds three reds, three greens and two whites. Asking what Melissa could be holding after the draw settles it.
Something you must already know moderate Working it out
The term sample space is not defined in the question: students must know it means every possible result of the whole experiment, here a pair of colors drawn together. (Anderson & Krathwohl, 2001)
A very close wrong answer moderate Choosing the answer
The three mixed pairs, RG, RW and GW, form a complete-looking list that is the right list minus RR, GG and WW, so only asking whether two marbles of one color can come out together separates them. (Embretson & Wetzel, 1987; Gorin & Embretson, 2006; Ascalon et al., 2007)
Strategy: Describe one possible result of taking out two marbles, then build the list systematically, starting from each color and pairing it with every color that could come out with it.
Traps
- Misunderstands the concept: A wrong belief about a concept: that percents can be added, that area grows like length, that averages can be averaged, that a bigger denominator means a bigger fraction.
- Without replacement: In a second pick there is one fewer item, which changes the probability.
- Answers a different question: A choice is right for another quantity: the other unknown, the rest instead of the part, the part instead of the whole.
The wrong answers, classified
A Answers a different question (King et al., 2004; Hegarty, Mayer & Monk, 1995)
Lists the colors a single marble can be, the sample space for drawing one marble, though Melissa takes out two.
B Without replacement (Fischbein & Schnarch, 1997)
Leaves out pairs of one color, as if drawing a red marble left no red behind, though the bag holds three reds, three greens and two whites.
C Misunderstands the concept (Smith, diSessa & Roschelle, 1993; De Bock et al., 1998; Ni & Zhou, 2005)
Lists the eight marbles in the bag, describing what the bag holds rather than the possible results of taking two out.
Worked solution, step by step
Formulas used
- Sample space
- An outcome is one possible result of an experiment. The sample space lists every outcome once. For this experiment, one outcome is the pair of colors Melissa holds after she takes out two marbles.
Sort out the question
The bag holds 3 red (R), 3 green (G) and 2 white (W) marbles. Melissa takes out 2 marbles without looking.
You need the sample space: every possible result of taking out 2 marbles. So each outcome must name two colors, like RG for one red and one green.
List pairs by the first color
Start with each color the first marble could be. Then pair it with each color the second could be:
- First red: RR, RG, RW
- First green: GR, GG, GW
- First white: WR, WG, WW
That gives 9 pairs.
Remove pairs that repeat
Melissa ends up holding two marbles. One red and one green is the same result whichever came out first. So GR is the same as RG. Cross out GR, WR and WG. Six pairs are left:
RR, RG, RW, GG, GW, WW
Check the same-color pairs
Can both marbles be the same color? Yes. The bag has 3 reds, 3 greens and 2 whites, so RR, GG and WW can all happen.
Watch out: choice B leaves out RR, GG and WW. That would only be right if the bag had one marble of each color. Choice A is the colors of one marble. Choice C lists the marbles in the bag, not results.
So the answer is D, RR, RG, RW, GG, GW, WW.
Check your answer
Ask what Melissa could be holding. Two reds? Yes, there are 3. Two whites? Yes, there are exactly 2. A green and a white? Yes. Every pair in D can happen, and no possible pair is missing. Choice B misses three pairs that can happen.
More questions like this
The original DOE question
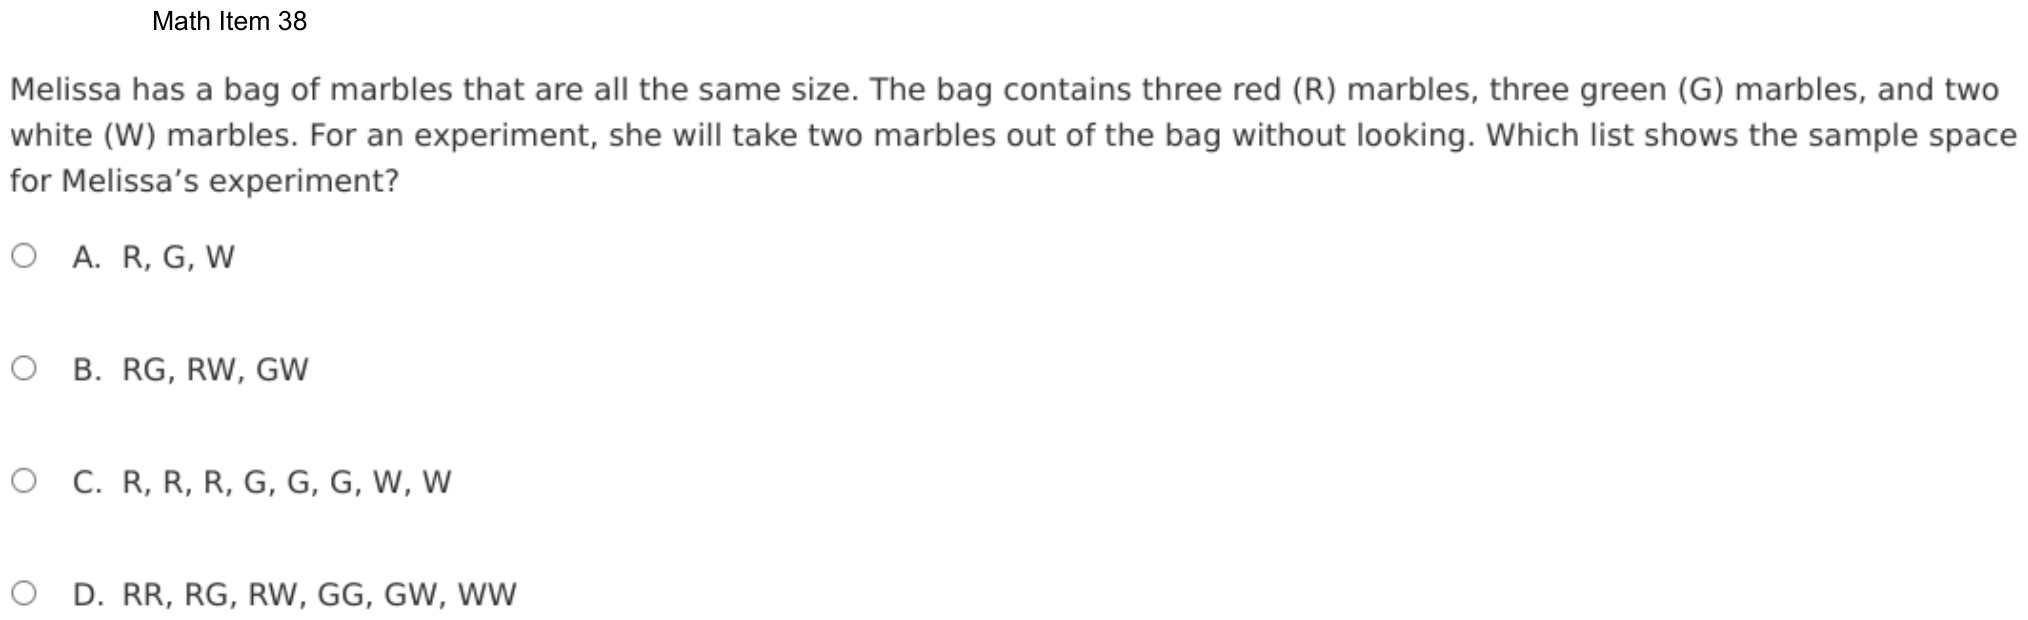
Question 13 of 45
2024 Test B Math, question 2Question
Two number cubes have sides labeled 1 through 6. Both number cubes are rolled. How many different outcomes will have a sum of 6?
Grid-in question: work out the answer and enter it as a number.
Show the answer
Correct answer: 5
There will be 5 different outcomes with a sum of 6:
Question analysis
A counting grid-in with two number cubes, each numbered 1 to 6, rolled together. Students count how many different outcomes give a sum of 6. The catch is deciding whether a 2 on the first cube with a 4 on the second counts as a different outcome from the reverse.
- NYS standards
- 7.SP.8b sample spaces for compound events
- Grade level
- Grade 7 content, by NYS standard
- Compared with grade 7
- At grade 7 Grade 7 students list sample spaces for two number cubes when finding compound probabilities. This asks for one count from that list, a short task, though as a grid-in it offers no choices to expose an incomplete list.
- Estimated difficulty
- Moderate: several steps, or a close reading with one strong distractor.
- Thinking it demands
- Depth of knowledge 2, skills and concepts · mainly apply
- What makes it hard
- Solution
- 2 steps
- Reading level
- Question and choices: about grade 3, 21 words.
- Students, last 30 days
- Not enough answers yet to show (it takes 10).
Why it is hard, traps and wrong answers (shows the answer)
Why it is hard
The arithmetic is trivial; the question turns on what counts as a different outcome. Treating the cubes as a first and a second settles it: the first cube runs from 1 to 5 and the second is forced each time. Students who think in pairs of numbers rather than in rolls of two cubes undercount, and those who double every pair overcount by one at the double 3 and 3.
Something you must already know moderate Working it out
Nothing in the stem says that a 2 on the first cube with a 4 on the second differs from the reverse; students must already know that two cubes give 36 ordered outcomes. (Anderson & Krathwohl, 2001)
An answer in an unexpected form minor Choosing the answer
As a grid-in it offers no list of counts to compare, so a student who counts unordered pairs gets no sign that ordered outcomes were wanted. (Enright, Morley & Sheehan, 2002)
Strategy: Treat the cubes as a first and a second cube, run the first cube's value from 1 to 6, and for each value check whether the second cube can complete the sum.
Traps
- Misunderstands the concept: A wrong belief about a concept: that percents can be added, that area grows like length, that averages can be averaged, that a bigger denominator means a bigger fraction.
- Overlapping groups: Things in two groups at once are counted twice, or not subtracted.
The wrong answers, classified
3 Misunderstands the concept (Smith, diSessa & Roschelle, 1993; De Bock et al., 1998; Ni & Zhou, 2005)
Counts unordered pairs, 1 and 5, 2 and 4, 3 and 3, treating a 1 on the first cube with a 5 on the second as the same outcome as the reverse.
6 Overlapping groups (King et al., 2004)
Knows order matters and doubles the 3 pairs to 6, but 3 and 3 reads the same both ways, so that outcome is counted twice.
36 Answers a different question (King et al., 2004; Hegarty, Mayer & Monk, 1995)
Grids the total number of outcomes for two cubes, 6 × 6 = 36, instead of only the outcomes whose sum is 6.
Worked solution, step by step
Formulas used
- Counting principle
- a is the number of ways the first cube can land, and b is the number of ways the second cube can land. Multiply them to count every pair. It works because each face of the first cube can go with each face of the second.
Sort out the question
You roll two number cubes. Each one shows 1, 2, 3, 4, 5 or 6. An outcome is one way the two cubes can land. You need the number of outcomes whose sum (the two numbers added) is 6.
The question does not say if order matters. The answer key counts the cubes as a first cube and a second cube. So 1 on the first and 5 on the second is a different outcome from 5 on the first and 1 on the second.
See why order counts
Picture a red cube and a blue cube. Red 1 with blue 5 is not the same roll as red 5 with blue 1. Both can happen, so both count.
This is how all the outcomes of two cubes are counted. Use the counting principle.
Watch out: 36 is every outcome, not just the ones that add up to 6.List the pairs that make 6
Go through the first cube one number at a time. The second cube has to make up the rest of the 6.
First cube Second cube Sum 1 5 6 2 4 6 3 3 6 4 2 6 5 1 6 The first cube cannot show 6. Then the second cube would need 0, and no face shows 0.
Count the outcomes
The table has 5 rows, so there are 5 outcomes. Watch out: counting 1 and 5 as the same as 5 and 1 gives only 3. Watch out: 3 and 3 is one outcome, not two. Doubling 3 pairs to get 6 counts it twice.
So you would grid 5.
Check your answer
Each number from 1 to 5 on the first cube goes with exactly one number on the second cube. A 6 on the first cube goes with nothing. So there are exactly 5 outcomes. The table shows the same pattern: as the first number goes up by 1, the second goes down by 1.
More questions like this
The original DOE question
Question 14 of 45
2024 Test B Math, question 18Question
A taxi driver recorded the number of fares each day for one month. The box plot displays the data.
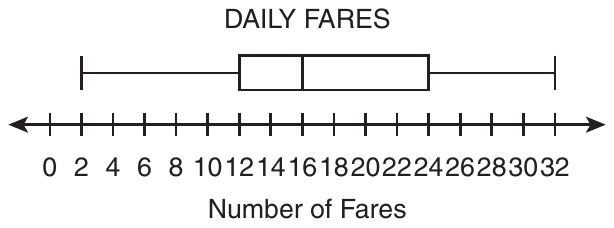
Based on the box plot, which statement is a correct interpretation of the data?
- AThe data point 2 is an outlier.
- BThe mean of the data is 16.
- CThe interquartile range (IQR) of the data is 30.
- DOn about 25% of the days, there were between 12 and 16 fares.
Show the answer
Correct answer: D
The amount of data in a box plot is broken into 4 parts, or quartiles, which each represent 25% of the data. So the amount of data represented between Quartile 1 (12) and the median (16) is about 25% of the data.
Question analysis
A statistics question on a box plot of the number of fares a taxi driver recorded each day for one month. Students decide which of four statements is a correct interpretation of the data, using what a box plot does and does not show. The statements draw on several different box plot ideas, so each one must be checked.
- NYS standards
- 7.SP.1 box plots and interquartile range
- Grade level
- Grade 7 content, by NYS standard
- Compared with grade 7
- At grade 7 Reading box plots, finding the interquartile range and testing for outliers are all grade 7 standards in New York. This item gathers several of them in one question, but each check is short, typical of grade 7 work.
- Estimated difficulty
- Moderate: several steps, or a close reading with one strong distractor.
- Thinking it demands
- Depth of knowledge 2, skills and concepts · mainly understand
- What makes it hard
- Something you must already know moderate
- Every choice must be checked moderate
- Reading a figure, table or graph minor
- Solution
- 3 steps
- Reading level
- Question and choices: about grade 4, 63 words.
- Students, last 30 days
- Not enough answers yet to show (it takes 10).
Why it is hard, traps and wrong answers (shows the answer)
Why it is hard
No calculation here is long; the challenge is knowing what a box plot does and does not show. Two of the wrong statements sound reasonable because they borrow real features of the plot, its long left whisker and its middle line, and give them the wrong meaning. Remembering that the plot splits the days into four groups of about equal size makes the true statement easy to confirm.
Something you must already know moderate Working it out
Each statement draws on a box plot fact the test does not supply: what the middle line marks, how the IQR is found, and when a value counts as an outlier. (Anderson & Krathwohl, 2001)
Every choice must be checked moderate Choosing the answer
The four statements test four separate ideas, an outlier, the mean, the IQR and a quartile's share, so ruling out one says nothing about the next. (Embretson & Wetzel, 1987)
Reading a figure, table or graph minor Understanding the question
The scale is labeled every 2 fares with the numbers crowded together, so the five values 2, 12, 16, 24 and 32 must be read off with care. (Lesh, Post & Behr, 1987; Kirsch & Mosenthal, 1990)
Strategy: Read the minimum, quartiles, median and maximum off the plot, then test each statement in turn, computing the IQR and the outlier cutoffs rather than judging by eye.
Traps
- Misunderstands the concept: A wrong belief about a concept: that percents can be added, that area grows like length, that averages can be averaged, that a bigger denominator means a bigger fraction.
- Wrong formula: Uses a related but wrong formula: perimeter for area, diameter for radius, area for volume, or a misremembered one.
The wrong answers, classified
A Misunderstands the concept (Smith, diSessa & Roschelle, 1993; De Bock et al., 1998; Ni & Zhou, 2005)
Takes the long left whisker as a sign that 2 is an outlier, but that whisker holds a quarter of the days, and 2 is above the cutoff 12 − 1.5 × 12 = −6.
B Misunderstands the concept (Smith, diSessa & Roschelle, 1993; De Bock et al., 1998; Ni & Zhou, 2005)
Takes the median line at 16 for the mean, though a box plot shows the median and quartiles and cannot show the mean.
C Wrong formula (King et al., 2004)
Subtracts the minimum from the maximum, 32 − 2 = 30, which is the range, not the interquartile range of 24 − 12 = 12.
Worked solution, step by step
Formulas used
- Interquartile range (IQR)
- Q1 is the first quartile, the left edge of the box. Q3 is the third quartile, the right edge. The IQR is the length of the box. It tells how spread out the middle half of the data is.
- Low cutoff for an outlier
- Q1 and the IQR are found from the box. An outlier is a value far away from the rest. A value below this cutoff counts as an outlier on the low side. A value at or above it does not.
Read the five numbers
A box plot sums up a set of data with five numbers. Here each piece of data is the number of fares on one day.
- Minimum, the smallest value: 2
- First quartile, Q1, the left edge of the box: 12
- Median, the middle value, the line inside the box: 16
- Third quartile, Q3, the right edge of the box: 24
- Maximum, the largest value: 32
Learn what each part holds
These five numbers split the days into four parts. Each part holds about one fourth of the days, or about 25%. For example, about 25% of the days fall between the minimum and Q1. Another 25% fall between Q1 and the median.
Check choice D
Choice D talks about days with between 12 and 16 fares. 12 is Q1, and 16 is the median. That stretch is one of the four parts. So on about 25% of the days, there were between 12 and 16 fares. Choice D is correct.
Rule out choices B and C
Choice B: a box plot shows the median, 16, not the mean (the average). You cannot find the mean from it. Watch out: do not mix up the median and the mean.
Choice C says the IQR is 30. But 30 is the range, . Watch out: the IQR uses the edges of the box, not the ends of the whiskers.
Rule out choice A and answer
A long whisker does not make 2 an outlier. Use the cutoff rule.
2 is above −6, so 2 is not an outlier. The long whisker just shows that the lowest fourth of the days is spread out.
So the answer is D.
Check your answer
Go back over the four choices. Only D uses what a box plot really shows: four parts of about 25% each. Choice B needs the mean, which the plot does not show. Choice C gives the range, not the IQR. And 2 is not far enough out to be an outlier, so A is wrong.
More questions like this
The original DOE question
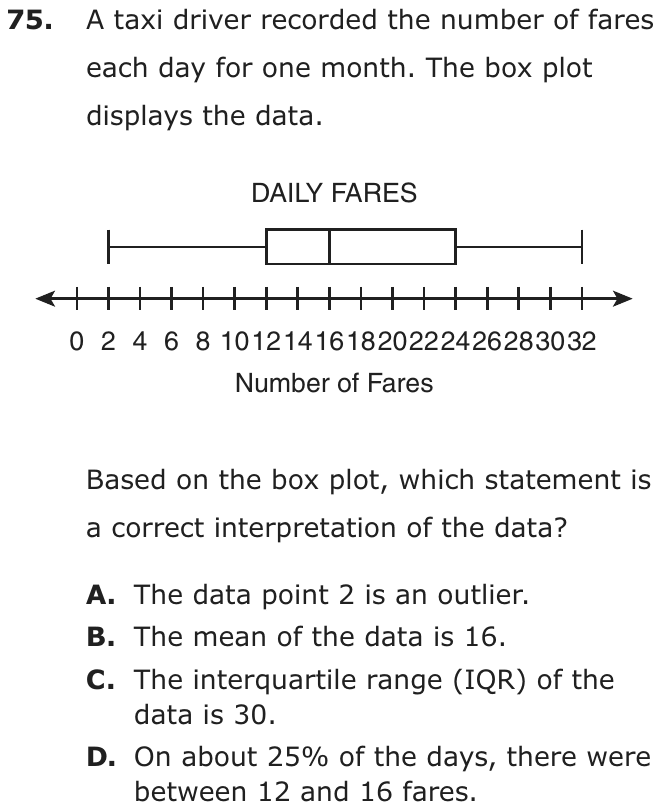
Question 15 of 45
2024 Test B Math, question 28Question
A community center has two 30-member exercise groups. The director recorded the ages of each group’s members in the box plots.
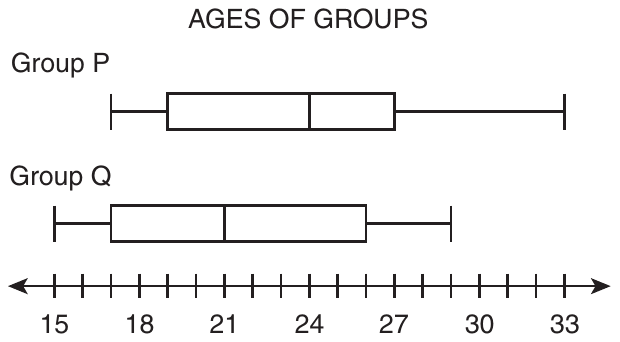
Which statement about the two groups can be verified based on the box plots?
- ABoth groups have at least one member who is exactly 29 years old.
- BGroup P has more members who are at least 17 years old than Group Q has.
- CBoth groups have an equal number of members who are between 21 and 24 years old.
- DGroup Q has fewer members who are between 19 and 27 years old than Group P has.
Show the answer
Correct answer: B
Groups P and Q have an equal number of members. All the members of Group P are 17 or older, but only about of the members of Group Q are 17 or older.
Question analysis
Box plots show the ages of the members of two 30-member exercise groups at a community center, Group P and Group Q. Students decide which statement comparing the groups can be verified from the plots alone. The challenge is knowing what a box plot guarantees about individual ages and counts, and what it leaves unknown.
- NYS standards
- Grade level
- Grade 7 content, by NYS standard
- Compared with grade 7
- Above grade 7 Grade 7 students read box plots and compare medians and spreads. Deciding which claims two box plots can prove, from what the five key values guarantee about counts, is a harder reasoning task than typical grade 7 work.
- Estimated difficulty
- Hard: combines ideas, needs a plan, and has more than one tempting wrong answer.
- Thinking it demands
- Depth of knowledge 3, strategic thinking · mainly evaluate
- What makes it hard
- Every choice must be checked major
- Something you must already know moderate
- Reading a figure, table or graph moderate
- Solution
- 3 steps
- Reading level
- Question and choices: about grade 5, 91 words.
- Students, last 30 days
- Not enough answers yet to show (it takes 10).
Why it is hard, traps and wrong answers (shows the answer)
Why it is hard
This is a question about evidence: the right statement is the only one the box plots guarantee, while the others may or may not be true. Students who treat the plots as pictures of every member, assuming ages fill each whisker or spread evenly through each box, find support for claims that cannot be checked. Asking what must hold for any 30 ages with these summaries separates the verifiable claim from the merely plausible ones.
Every choice must be checked major Choosing the answer
Three of the statements are not false but unverifiable, so each must be tested against what the five-number summaries guarantee, and none can be dismissed at a glance. (Embretson & Wetzel, 1987)
Something you must already know moderate Working it out
Students must know that the minimum and maximum are actual ages, that each quarter of a plot holds about a quarter of the 30 members, and that a whisker shows nothing in between. (Anderson & Krathwohl, 2001)
Reading a figure, table or graph moderate Understanding the question
The scale is labeled only every 3 years, so values such as 17, 19, 26 and 29 have to be read from unlabeled ticks on two separate plots. (Lesh, Post & Behr, 1987; Kirsch & Mosenthal, 1990)
Strategy: List each group's minimum, first quartile, median, third quartile and maximum, then test every statement against only what those five values guarantee about the 30 ages.
Traps
- Misunderstands the concept: A wrong belief about a concept: that percents can be added, that area grows like length, that averages can be averaged, that a bigger denominator means a bigger fraction.
- Numbers taken from the question: Combines the numbers in the question without a model of the situation, or is simply a number that appears in the question.
The wrong answers, classified
A Misunderstands the concept (Smith, diSessa & Roschelle, 1993; De Bock et al., 1998; Ni & Zhou, 2005)
Sees that Group Q's maximum is exactly 29 and that 29 also lies in Group P's upper whisker, assuming someone in Group P is that age.
C Numbers taken from the question (Hegarty, Mayer & Monk, 1995)
Matches the two medians, 21 and 24, and assumes the stretch between them holds the same number of members in both groups.
D Misunderstands the concept (Smith, diSessa & Roschelle, 1993; De Bock et al., 1998; Ni & Zhou, 2005)
Knows Group P's box from 19 to 27 holds half its members, then assumes ages spread evenly so Group Q has fewer there, which its plot cannot show.
Worked solution, step by step
Formulas used
- Members in each part of a box plot
- n is the number of members in a group, here 30. A box plot splits the data into four parts at the minimum, Q1, the median, Q3 and the maximum. Each part holds about one fourth of the data. It does not show how the ages spread out inside a part.
Read the two box plots
A box plot shows five numbers. The minimum is the youngest age, and the maximum is the oldest. Q1 is the left edge of the box, and Q3 is the right edge. The median is the line inside the box.
Group Min Q1 Median Q3 Max P 17 19 24 27 33 Q 15 17 21 26 29 Each group has 30 members.
Know what can be verified
To verify a statement means to know for sure that it is true. A box plot shows only five numbers, not every age. The minimum and maximum are real ages of real members. The other ages are hidden inside the box and whiskers.
Check choice B
In Group P, the youngest member is 17. So all 30 members are at least 17. In Group Q, the youngest member is 15, and 15 is under 17. So at most 29 members of Group Q are at least 17.
Group P has 30 such members, and Group Q has 29 or fewer. So choice B is true for sure.
Rule out choices A and C
A: Group Q’s oldest member is 29, so Group Q has a 29-year-old. But in Group P, 29 is inside the right whisker. A whisker does not show single ages. Watch out: 29 is in Group P’s range, but maybe no one in Group P is exactly 29.
C: The plots do not show how many members are between 21 and 24 in either group.
Rule out choice D and answer
Group P’s box, from 19 to 27, is two of its four parts.
So about 15 members of Group P are between 19 and 27. But 19 and 27 fall in the middle of Group Q’s parts, and ages inside a part can bunch up in any way. Group Q could have more or fewer. Watch out: D assumes the ages are spread out evenly, and a box plot never tells you that.
So the answer is B.
Check your answer
Choice B uses only the two minimums, which are real ages. Group P’s youngest member is 17, and Group Q’s is 15. That alone proves it. Each other choice needs ages inside a box or whisker, which a box plot does not show.
More questions like this
The original DOE question
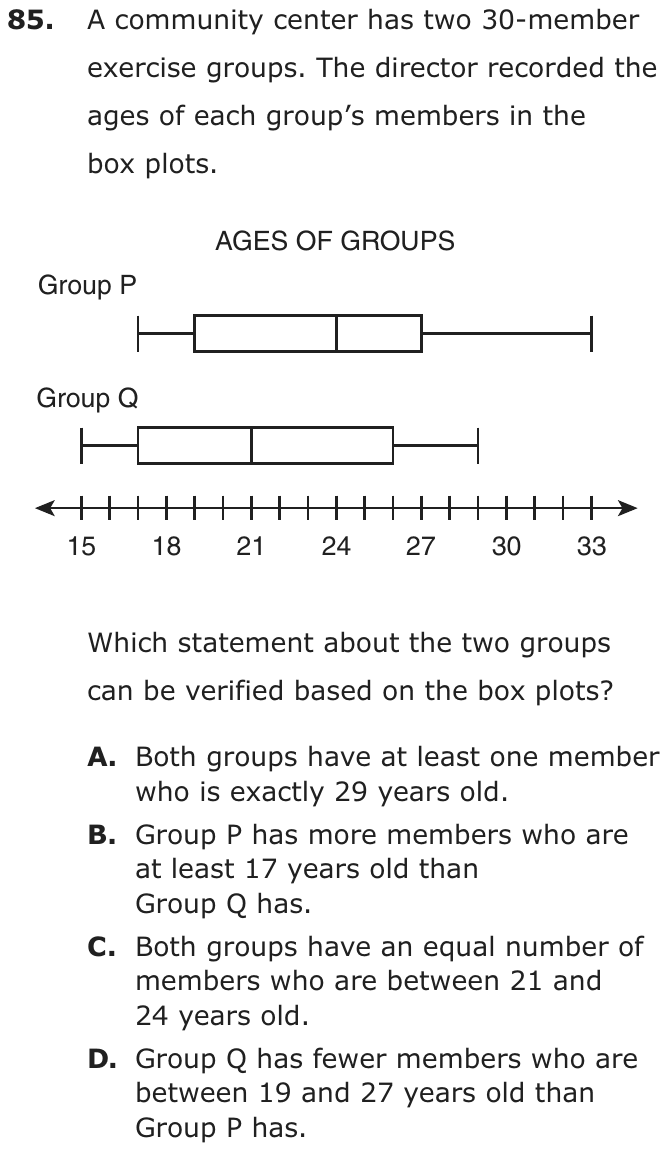
Question 16 of 45
2024 Test B Math, question 41Question
A bag contains 2 green, 4 blue, and 3 yellow disks. Alana selects 4 disks from the bag at random, one at a time, without replacing them. What is the probability that she selects all 4 blue disks?
- A
- B
- C
- D
Show the answer
Correct answer: B
If Alana picks 4 blue disks in a row, the number of blue disks and the total number of disks will both decrease by 1 after each selection.
For the first selection, there are 4 blue disks out of 9 total disks, so the probability of selecting the first blue disk is .
The probabilities of selecting blue for the next three selections are , , and .
Question analysis
A bag holds green, blue and yellow disks, and Alana draws four of them one at a time without putting any back. Students find the probability that all four disks are blue. It tests the probability of dependent events, and the difficulty is keeping track of how the bag changes after each draw.
- NYS standards
- Grade level
- Grade 7 content, by NYS standard
- Compared with grade 7
- Above grade 7 Grade 7 compound probability is usually found with lists or tree diagrams for two stages. Four dependent draws, each changing the counts, are too many to list and need the multiplication rule, which grade 7 does not formally teach.
- Estimated difficulty
- Hard: combines ideas, needs a plan, and has more than one tempting wrong answer.
- Thinking it demands
- Depth of knowledge 2, skills and concepts · mainly apply
- What makes it hard
- Something you must already know moderate
- Error-prone arithmetic moderate
- Solution
- 3 steps
- Reading level
- Question and choices: about grade 5, 37 words.
- Students, last 30 days
- Not enough answers yet to show (it takes 10).
Why it is hard, traps and wrong answers (shows the answer)
Why it is hard
Students who know the multiplication rule for successive draws still have two adjustments to make on every draw, and each wrong choice skips at least one of them. Leaving the bag at 9 disks, or putting each disk back, both produce fractions over 6,561 that look as exact as the right one. Writing the four fractions in a row before multiplying, and cancelling as you go, keeps the arithmetic small.
Something you must already know moderate Working it out
The rule for successive draws without replacement is assumed: each draw's chance is multiplied in, with both the blue count and the total lowered by one. (Anderson & Krathwohl, 2001)
Error-prone arithmetic moderate Working it out
The product 4/9 × 3/8 × 2/7 × 1/6 = 24/3,024 has to be reduced to 1/126, and two wrong choices hide behind 9 to the fourth power, 6,561. (Brown & Burton, 1978; Junker & Sijtsma, 2001)
Strategy: Write the chance of blue for each of the four draws in turn, lowering both the blue count and the total by one each time, and multiply.
Traps
- Without replacement: In a second pick there is one fewer item, which changes the probability.
- Wrong operation: Adds instead of multiplying, divides the wrong way round, turns a ratio or rate upside down, or undoes a step in the wrong direction (subtracts what should be added back).
The wrong answers, classified
A Without replacement (Fischbein & Schnarch, 1997)
Lowers the blue count on each draw but keeps all 9 disks in the bag, 4 × 3 × 2 × 1 over 9 × 9 × 9 × 9, which is 24/6,561 = 8/2,187.
C Without replacement (Fischbein & Schnarch, 1997)
Uses 4/9 for every draw, (4/9) to the fourth power = 256/6,561, as if each disk were put back before the next draw.
D Wrong operation (Hegarty, Mayer & Monk, 1995; King et al., 2004)
Adds the first draw's 4/9 four times, or multiplies it by 4, instead of multiplying the draws' chances, and misses that a probability cannot exceed 1.
Worked solution, step by step
Formulas used
- Probability
- P is the probability, the chance that something happens. It is a number from 0 to 1. The top counts the results you want. The bottom counts all the results that can happen. It works when every result is equally likely.
- Chance of events in a row
- A and B are two events that happen one after the other. P(A) is the chance of the first. P(B after A) is the chance of the second, counting only what is left after the first. You multiply because the second must also happen inside the share of times the first did.
Sort out the question
The bag holds 2 green, 4 blue and 3 yellow disks. That is 9 disks in all. Alana takes 4 disks, one at a time.
“Without replacing them” means a disk she takes does not go back in the bag. You need the chance that all 4 disks are blue.
Find the chance for each pick
For all 4 to be blue, each pick must be blue. After each blue pick, one blue disk is gone. One disk is gone from the total, too. So the top and the bottom each go down by 1.
Pick Blue disks left Disks left Chance of blue 1st 4 9 2nd 3 8 3rd 2 7 4th 1 6 Multiply the four chances
All four picks must go right, one after another. Use the rule for events in a row and multiply.
Simplify the fraction
Divide the top and the bottom by 24. That keeps the value the same.
Watch out: Using for every pick gives , choice C. That is right only if each disk goes back in. Keeping 9 on the bottom each time gives , choice A. Choice D is more than 1, and no chance can be more than 1.
So the answer is B, .
Check your answer
Cancel before you multiply. On top, cancels the 8 on the bottom. That leaves . Divide the top and bottom by 3 to get again.
More questions like this
The original DOE question
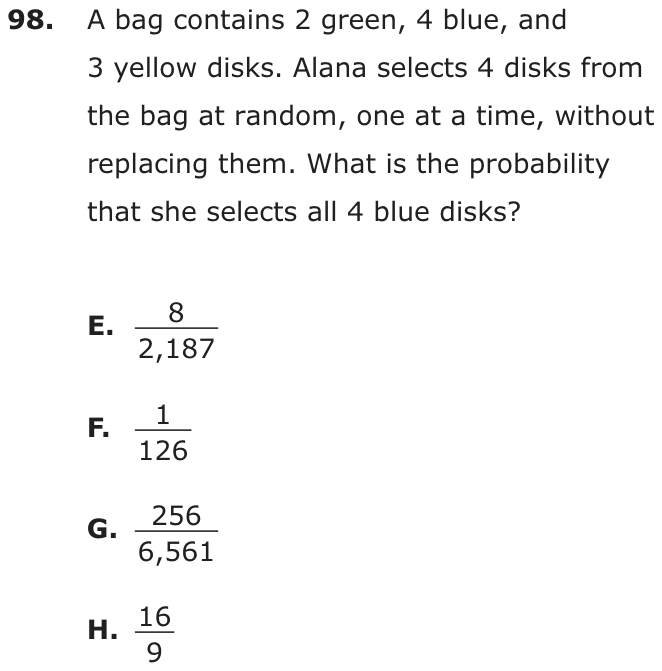
Question 17 of 45
2024 Test B Math, question 47Question
Three different colors of paint are available to paint the window frame, the door, and the wall of a house. If no two parts of the house may be painted the same color, how many different ways are there to paint the three parts of the house?
- A3
- B6
- C9
- D27
Show the answer
Correct answer: B
One method of solving the problem is to use a table to represent the sample space. Let the three colors be red, blue, and green.
PAINT COLORS
| Window Frame | Door | Wall |
|---|---|---|
| Red | Blue | Green |
| Red | Green | Blue |
| Blue | Red | Green |
| Blue | Green | Red |
| Green | Red | Blue |
| Green | Blue | Red |
There are 6 possible combinations of colors for the window frame, the door, and the wall where no two parts are painted the same color.
Question analysis
Three paint colors are available for a house's window frame, door and wall, and no two of the three parts may be painted the same color. Students count the different ways to paint them. It tests counting arrangements with a sample space, and the rule against repeating a color is what shapes the count.
- NYS standards
- 7.SP.8b sample spaces for compound events
- Grade level
- Grade 7 content, by NYS standard
- Compared with grade 7
- At grade 7 Counting arrangements with an organized list is grade 7 work, and this one has only three parts and three colors. It is typical practice, with the no-repeat rule as the one condition to keep in mind.
- Estimated difficulty
- Straightforward: two steps or one careful reading.
- Thinking it demands
- Depth of knowledge 2, skills and concepts · mainly apply
- What makes it hard
- Solution
- 2 steps
- Reading level
- Question and choices: about grade 8, 47 words.
- Students, last 30 days
- Not enough answers yet to show (it takes 10).
Why it is hard, traps and wrong answers (shows the answer)
Why it is hard
With three colors and three parts, the six arrangements can be listed in well under a minute, so the question rewards either a quick organized list or the counting principle. The main loss comes from ignoring the rule that no two parts match, which turns 3 × 2 × 1 into 3 × 3 × 3. The other wrong choices simply combine the two 3s in the stem.
Something you must already know minor Working it out
The counting principle is assumed: 3 color choices for the window frame, 2 left for the door, then 1 for the wall, multiplied together. (Anderson & Krathwohl, 2001)
Turning words into math minor Understanding the question
The rule that "no two parts of the house may be painted the same color" means each color is used exactly once, which removes one choice at every step. (Hegarty, Mayer & Monk, 1995; Koedinger & Nathan, 2004)
Strategy: Count the color choices for the window frame, then for the door with one color already used, then for the wall, and multiply; or list the arrangements.
Traps
- Without replacement: In a second pick there is one fewer item, which changes the probability.
- Numbers taken from the question: Combines the numbers in the question without a model of the situation, or is simply a number that appears in the question.
The wrong answers, classified
A Numbers taken from the question (Hegarty, Mayer & Monk, 1995)
Gives the number of colors, 3, as the number of ways, without arranging the colors across the three parts.
C Numbers taken from the question (Hegarty, Mayer & Monk, 1995)
Multiplies the 3 colors by the 3 parts, 3 × 3 = 9, a product of the stem's numbers rather than a count of arrangements.
D Without replacement (Fischbein & Schnarch, 1997)
Allows any color on each part, 3 × 3 × 3 = 27, ignoring the rule that a color used once cannot be used again.
Worked solution, step by step
Formulas used
- Counting principle
- a is the number of choices for the first part, b for the second and c for the third. Multiply them to get every possible way. It works because each choice for one part can go with each choice for the next part.
Sort out the question
There are 3 colors and 3 parts to paint: the window frame, the door and the wall. No two parts may be the same color. So each color is used exactly once.
You need the number of different ways to paint the three parts.
Count the choices for each part
Paint the parts in order. Each color you use is gone for the next part.
- Window frame: any of the 3 colors, so 3 choices.
- Door: one color is used, so 2 choices are left.
- Wall: only 1 color is left, so 1 choice.
Multiply the choices
Use the counting principle. Each choice for the window frame goes with each choice for the door, and so on. So you multiply.
Watch out: , choice D, lets a color be used twice. , choice C, just multiplies the numbers in the question.
So the answer is B, 6.
Check your answer
List them. Use R for red, B for blue and G for green, in the order frame, door, wall: RBG, RGB, BRG, BGR, GRB and GBR. That is 6 ways, and each one uses all three colors once.
More questions like this
The original DOE question
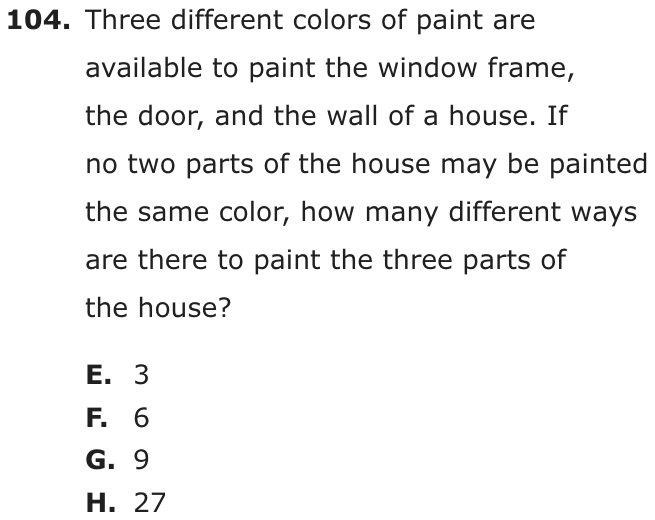
Question 18 of 45
2024 Test B Math, question 50Question
Chris has 1 red shirt, 2 white shirts, and 3 black shirts. Chris picks a shirt at random. Without putting the first shirt back, he picks a second shirt at random. What is the probability that the first shirt is black and the second shirt is red?
- A
- B
- C
- D
Show the answer
Correct answer: B
Use the joint probability formula: P (black shirt first) • P (red shirt second, given black shirt first).
Initially there are 3 black shirts out of 6 total shirts, so the probability of picking a black shirt first is .
Once a black shirt is picked first, there is 1 red shirt out of 5 total shirts remaining.
So the probability of picking a red shirt second, given that a black shirt was picked first, is .
Then P (black shirt first) • P (red shirt second, given black shirt first)
.
Question analysis
Chris has red, white and black shirts and picks two at random, one after the other, without putting the first back. Students find the probability that the first shirt is black and the second is red. It tests the probability of two dependent events, where the second pick has one fewer shirt to choose from.
- NYS standards
- Grade level
- Grade 7 content, by NYS standard
- Compared with grade 7
- Above grade 7 Grade 7 compound probability is usually found with a list or tree of equally likely outcomes. Only two picks are involved, but adjusting the second pick for the shirt already taken goes beyond typical grade 7 work.
- Estimated difficulty
- Moderate: several steps, or a close reading with one strong distractor.
- Thinking it demands
- Depth of knowledge 2, skills and concepts · mainly apply
- What makes it hard
- Something you must already know moderate
- A very close wrong answer moderate
- Turning words into math minor
- Solution
- 3 steps
- Reading level
- Question and choices: about grade 3, 48 words.
- Students, last 30 days
- Not enough answers yet to show (it takes 10).
Why it is hard, traps and wrong answers (shows the answer)
Why it is hard
Two dependent picks with small numbers make this a textbook question, but the choices punish each half-step. Students who leave the first shirt in the drawer get a fraction just below the right one, students who find only the second pick's chance stop at a listed value, and students who add the two chances get a probability far too large. Writing both fractions, 3/6 and 1/5, and multiplying is the whole method.
Something you must already know moderate Working it out
The rule for two dependent picks, the first pick's chance times the second's given the first, is assumed, along with the drop to 5 shirts for the second pick. (Anderson & Krathwohl, 2001)
A very close wrong answer moderate Choosing the answer
1/10 and 1/12 differ only in the second pick's denominator, 5 shirts or 6, so estimating cannot separate them. (Embretson & Wetzel, 1987; Gorin & Embretson, 2006; Ascalon et al., 2007)
Turning words into math minor Understanding the question
"Without putting the first shirt back" sets the second pick's total at 5 shirts, and the order, black first then red, fixes which fraction comes first. (Hegarty, Mayer & Monk, 1995; Koedinger & Nathan, 2004)
Strategy: Find the chance of black on the first pick, then the chance of red on the second pick with one shirt fewer, and multiply the two.
Traps
- Without replacement: In a second pick there is one fewer item, which changes the probability.
- Stops one step early: A choice is a number from partway through the solution.
- Wrong operation: Adds instead of multiplying, divides the wrong way round, turns a ratio or rate upside down, or undoes a step in the wrong direction (subtracts what should be added back).
The wrong answers, classified
A Without replacement (Fischbein & Schnarch, 1997)
Keeps all 6 shirts for the second pick, 3/6 × 1/6 = 1/12, as if the black shirt had been put back.
C Stops one step early (King et al., 2004; Gierl et al., 2017)
Gives only the chance that the second shirt is red once a black one is gone, 1/5, leaving out the first pick's 3/6.
D Wrong operation (Hegarty, Mayer & Monk, 1995; King et al., 2004)
Adds the two chances, 1/2 + 1/5 = 7/10, instead of multiplying them for two events that must both happen.
Worked solution, step by step
Formulas used
- Probability
- P is the probability, the chance that something happens. It is a number from 0 to 1. The top counts the results you want. The bottom counts all the results that can happen. It works when every result is equally likely.
- Chance of events in a row
- A and B are two events that happen one after the other. P(A) is the chance of the first. P(B after A) is the chance of the second, counting only what is left after the first. You multiply because the second must also happen inside the share of times the first did.
Sort out the question
Chris has 1 red, 2 white and 3 black shirts. That is 6 shirts. He picks one and keeps it out. Then he picks a second shirt.
You need the chance that the first shirt is black and the second is red. Both must happen, in that order.
Find the chance of black first
3 of the 6 shirts are black. Each shirt is equally likely to be picked.
That is one half.
Find the chance of red second
A black shirt is now out and not put back. That leaves 5 shirts: 1 red, 2 white and 2 black.
Watch out: The bottom is 5, not 6. Using 6 gives , choice A, as if the shirt went back.
Multiply the two chances
Use the rule for events in a row. The second pick must go right too, inside the half of the time the first one did.
Watch out: Adding the chances gives , choice D. Stopping at gives choice C.
So the answer is B, .
Check your answer
Count every ordered pair of picks. There are 6 choices for the first and 5 for the second, so pairs. Pairs with black then red: 3 black shirts times 1 red shirt is 3. So the chance is .
More questions like this
The original DOE question
Question 19 of 45
2024 Test B Math, question 52Question
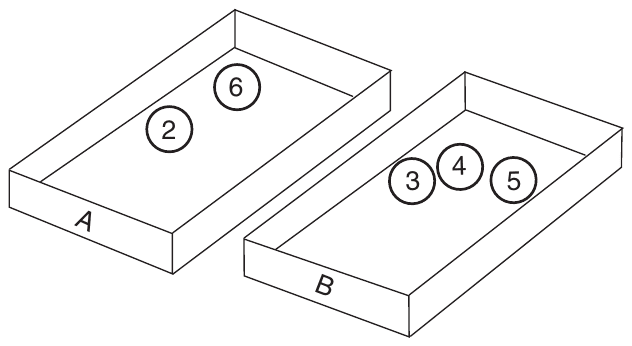
Five numbered balls are placed in two boxes as shown in the figure above. Davina picks one ball at random from Box B and places it in Box A. Then Yusuf picks one ball from Box A without looking. What is the probability that Yusuf will pick a ball with an odd number?
- A
- B
- C
- D
Show the answer
Correct answer: A
The probability of Davina picking an odd-numbered ball from Box B is . If Davina places an odd-numbered ball in Box A, then the probability of Yusuf picking an odd-numbered ball from Box A is . The probability of both of these events happening is the product of the two probabilities.
Question analysis
Two boxes hold five numbered balls, and Davina moves one ball at random from Box B into Box A before Yusuf draws one from Box A. Students find the probability that Yusuf's ball shows an odd number. It tests two-stage probability, and the tricky part is that the second draw depends on which ball was moved.
- NYS standards
- Grade level
- Grade 7 content, by NYS standard
- Compared with grade 7
- Above grade 7 Grade 7 compound probability lists outcomes for independent stages such as coins or spinners. Here the first random move changes what is in the second box, so students must follow two linked stages, a dependence typical grade 7 work does not include.
- Estimated difficulty
- Among the hardest on the SHSAT: a non-obvious approach, heavy reading, or a well-hidden trap.
- Thinking it demands
- Depth of knowledge 3, strategic thinking · mainly analyze
- What makes it hard
- Solution
- 3 steps
- Reading level
- Question and choices: about grade 4, 57 words.
- Students, last 30 days
- Not enough answers yet to show (it takes 10).
Why it is hard, traps and wrong answers (shows the answer)
Why it is hard
Two chance events are hidden in what reads like a question about a single draw. Every listed wrong answer is a reasonable single-stage answer, either one of the two factors on its own or a count of odd balls across both boxes. Listing the nine equally likely pairs, Davina's ball and then Yusuf's, shows that only two of them end with an odd ball and makes the structure visible without any formula.
No obvious method major Working it out
The stem asks one question about Yusuf's draw, but the answer depends on Davina's earlier random pick; the key is that Box A starts with only even balls, so Yusuf can draw odd only by drawing the ball she moved. (Schoenfeld, 1985)
Something you must already know minor Working it out
Multiplying the chances of the two stages, 2/3 for an odd ball moving and 1/3 for Yusuf then drawing it, is a rule students must bring themselves. (Anderson & Krathwohl, 2001)
Reading a figure, table or graph minor Understanding the question
The numbers appear only in the figure, Box A holding 2 and 6 and Box B holding 3, 4 and 5, so the odd balls have to be spotted there. (Lesh, Post & Behr, 1987; Kirsch & Mosenthal, 1990)
Strategy: List every equally likely pair of a ball moved by Davina and a ball picked by Yusuf, and count the pairs that end with an odd ball.
Traps
- Stops one step early: A choice is a number from partway through the solution.
- Numbers taken from the question: Combines the numbers in the question without a model of the situation, or is simply a number that appears in the question.
The wrong answers, classified
B Stops one step early (King et al., 2004; Gierl et al., 2017)
Finds Yusuf's chance of drawing the odd ball once one is in Box A, 1 out of 3, leaving out the chance that Davina moves an odd ball at all.
C Numbers taken from the question (Hegarty, Mayer & Monk, 1995)
Counts the odd balls in the figure, 3 and 5, over all five balls, 2/5, ignoring that Yusuf draws only from Box A.
D Stops one step early (King et al., 2004; Gierl et al., 2017)
Gives the chance that Davina moves an odd ball, 2 out of 3, the first stage only, without multiplying by Yusuf's 1/3 chance of drawing it.
Worked solution, step by step
Formulas used
- Probability
- P is the probability, the chance that something happens. It is a number from 0 to 1. The top counts the results you want. The bottom counts all the results that can happen. It works when every result is equally likely.
- Chance of events in a row
- A and B are two events that happen one after the other. P(A) is the chance of the first. P(B after A) is the chance of the second, counting only what is left after the first. You multiply because the second must also happen inside the share of times the first did.
Read the figure
Box A holds balls numbered 2 and 6. Box B holds balls numbered 3, 4 and 5.
An odd number does not divide evenly by 2. So the only odd balls are 3 and 5, and both start in Box B. Box A starts with no odd balls at all.
Spot the two chance events
Two things happen by chance, one after the other:
- Davina picks one of the 3 balls in Box B and moves it to Box A.
- Then Yusuf picks one of the 3 balls now in Box A.
Yusuf gets an odd ball only if both go right. Davina must move an odd ball. Then Yusuf must pick that very ball.
The question asks only about Yusuf. But his chance depends on Davina’s pick, which comes first.
Find the chance for Davina’s pick
Box B has 3 balls, and 2 of them, the 3 and the 5, are odd.
If she moves the 4 instead, Box A holds only even balls. Then Yusuf can’t get an odd ball at all.
Find the chance for Yusuf’s pick
Say Davina moved an odd ball. Box A now holds 3 balls: the 2, the 6 and that one odd ball.
Watch out: alone is choice B. It forgets that Davina might move the 4.
Multiply the two chances
Both events must happen, so use the rule for events in a row.
Watch out: alone, choice D, stops after Davina’s pick. , choice C, counts 2 odd balls out of all 5. But Yusuf picks only from Box A.
So the answer is A, .
Check your answer
List all 9 equally likely outcomes. Davina can move 3, 4 or 5. Then Yusuf picks one of 3 balls.
| Ball moved | Box A then | Odd picks |
|---|---|---|
| 3 | 2, 6, 3 | 1 |
| 4 | 2, 6, 4 | 0 |
| 5 | 2, 6, 5 | 1 |
That is 2 odd picks out of 9, or .
More questions like this
The original DOE question
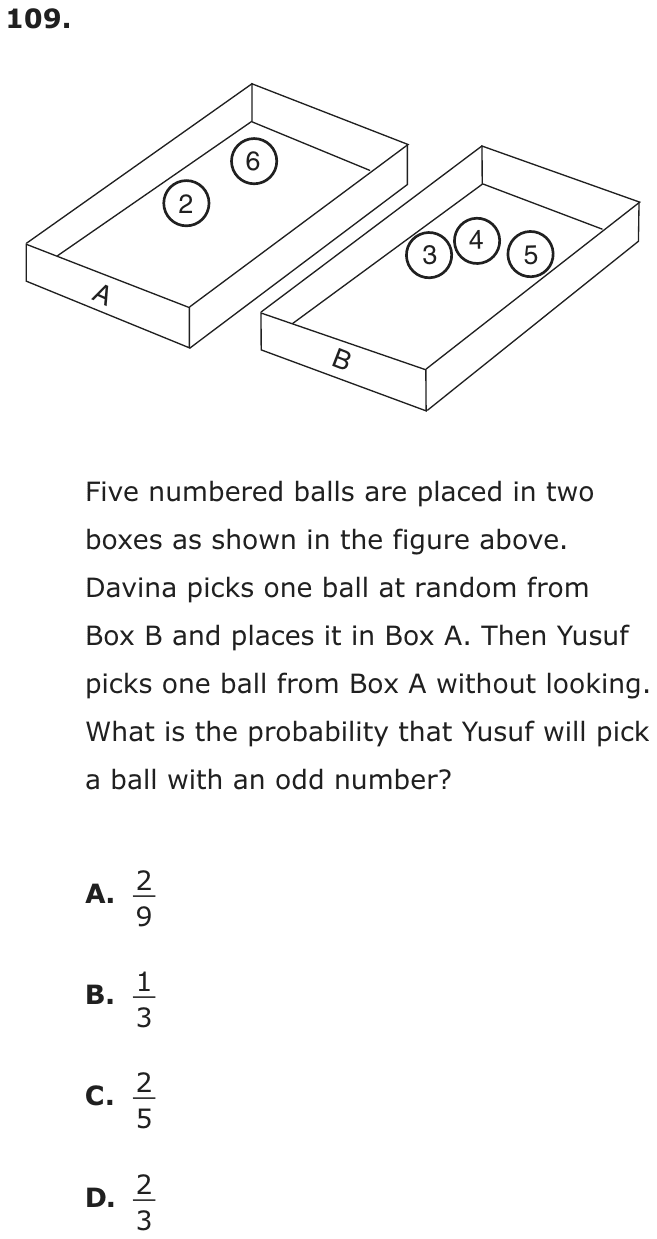
Question 20 of 45
2023 Test A Math, question 15Question
A swim instructor used the box plot below to display the distribution of the ages of students who signed up for swim lessons.
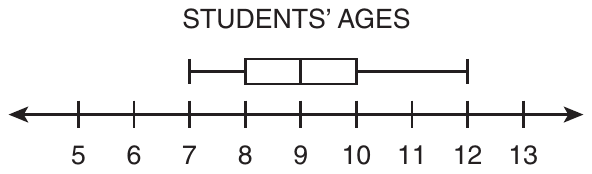
Which statement about the distribution of ages is true?
- AThe data contain an outlier.
- BApproximately half the students are exactly 9 years old.
- CApproximately one-fourth of the students are at least 10 years old.
- DThe interquartile range is 3 greater than the range of the data.
Show the answer
Correct answer: C
The data points in the box plot are as follows:
- minimum: 7
- first quartile: 8
- median: 9
- third quartile: 10
- maximum: 12
Since the value of the third quartile is 10, approximately one-fourth of the students are 10–12 years old.
Question analysis
A swim instructor's box plot shows the ages of students who signed up for lessons. Students decide which of four statements about the distribution is true, using the minimum, quartiles, median and maximum. The statements test different box plot ideas, including outliers, the median, the quartiles and the range, so each needs its own check.
- Grade level
- Grade 7 content, by NYS standard
- Compared with grade 7
- At grade 7 New York places box plots, the interquartile range and outliers in grade 7. Here four statements test those ideas one at a time; each check is short, so the item matches typical grade 7 work.
- Estimated difficulty
- Moderate: several steps, or a close reading with one strong distractor.
- Thinking it demands
- Depth of knowledge 2, skills and concepts · mainly understand
- What makes it hard
- Something you must already know moderate
- Every choice must be checked moderate
- Reading a figure, table or graph minor
- Solution
- 3 steps
- Reading level
- Question and choices: about grade 8, 66 words.
- Students, last 30 days
- Not enough answers yet to show (it takes 10).
Why it is hard, traps and wrong answers (shows the answer)
Why it is hard
Reading the five values off the plot is quick; the work is knowing what a box plot can and cannot say. It shows where quarters of the data begin and end, not how many students share any one age, and a long whisker is not an outlier unless it passes the 1.5 × IQR cutoff, here 13. The true statement uses the third quartile: about a quarter of the students are 10 or older.
Something you must already know moderate Working it out
The statements rely on box plot facts the question does not give: each section holds about a quarter of the data, the middle line is the median, and outliers lie beyond 1.5 IQRs. (Anderson & Krathwohl, 2001)
Every choice must be checked moderate Choosing the answer
Four statements test four separate ideas, an outlier, the share at one age, a quarter of the data and two spreads, so ruling one out says nothing about the rest. (Embretson & Wetzel, 1987)
Reading a figure, table or graph minor Understanding the question
The five values, 7, 8, 9, 10 and 12, are read off a 5-to-13 scale, where the longer right whisker draws the eye more than the box does. (Lesh, Post & Behr, 1987; Kirsch & Mosenthal, 1990)
Strategy: Read the five key values off the plot, then test each statement: compute the range, the interquartile range and the outlier cutoffs, and recall what share of the data each part holds.
Traps
- Misunderstands the concept: A wrong belief about a concept: that percents can be added, that area grows like length, that averages can be averaged, that a bigger denominator means a bigger fraction.
- Wrong formula: Uses a related but wrong formula: perimeter for area, diameter for radius, area for volume, or a misremembered one.
The wrong answers, classified
A Misunderstands the concept (Smith, diSessa & Roschelle, 1993; De Bock et al., 1998; Ni & Zhou, 2005)
Takes the long right whisker, reaching 12, as a sign of an outlier, but 12 is below the cutoff 10 + 1.5 × 2 = 13.
B Misunderstands the concept (Smith, diSessa & Roschelle, 1993; De Bock et al., 1998; Ni & Zhou, 2005)
Reads the median line at 9 as the age of half the students, though a median only splits the ages into a lower and an upper half.
D Wrong formula (King et al., 2004)
Swaps the two measures, taking the box's 2 years as the range and the whiskers' 5 years as the interquartile range, so the IQR seems 3 greater.
Worked solution, step by step
Formulas used
- Range
- The maximum is the largest value, the right end of a box plot. The minimum is the smallest, the left end. The range is how far apart they are. It shows how spread out all the data are.
- Interquartile range
- IQR is short for interquartile range. Q1, the first quartile, is the left edge of the box. Q3, the third quartile, is the right edge. The IQR is the width of the box. It is the spread of the middle half of the data. The four parts of a box plot each hold about one-fourth of the data.
- Outlier test
- An outlier is a value far from the rest of the data. A common rule says a value is an outlier if it lies more than 1.5 IQRs below Q1 or above Q3.
Read the five values off the plot
A box plot shows five numbers. The median is the middle value when the ages are in order.
Part Age Minimum, the left whisker’s end 7 First quartile, Q1, the box’s left edge 8 Median, the line in the box 9 Third quartile, Q3, the box’s right edge 10 Maximum, the right whisker’s end 12 Check choice A, an outlier
An outlier would be above 13 or below 5. The ages only run from 7 to 12. So there is no outlier. Watch out: a long whisker is not an outlier. It just means the top ages are spread out. Choice A is false.
Check choice B, the median
The median, 9, is the middle age. About half the students are 9 or younger. About half are 9 or older. It does not tell how many are exactly 9. Watch out: the median line does not mean half the students are 9. Choice B is false.
Check choice C, the top fourth
The box plot splits the students into four groups of about the same size. Each group holds about one-fourth of them. The last group runs from Q3, 10, to the maximum, 12. At least 10 means 10 or more. So about one-fourth of the students are at least 10 years old. Choice C is true.
Check choice D, the two spreads
The IQR is 3 less than the range, not 3 greater. The box always fits inside the whiskers, so the IQR can never be bigger. Watch out: swapping the two measures gives choice D. So the answer is C: about one-fourth of the students are at least 10 years old.
Check your answer
Picture 20 students. About 5 would be in each fourth of the plot. The top 5 would be ages 10 to 12. That is about one-fourth, just as choice C says. Each other choice fails a fact you can read straight off the plot.
More questions like this
The original DOE question
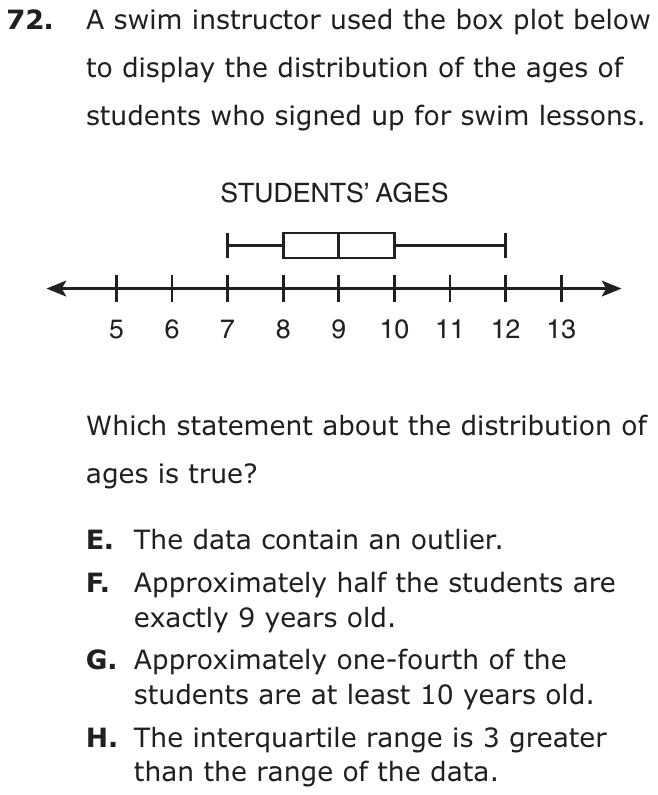
Question 21 of 45
2023 Test A Math, question 24Question
A student uses Spinner R and Spinner T to generate a list of two-digit numbers.
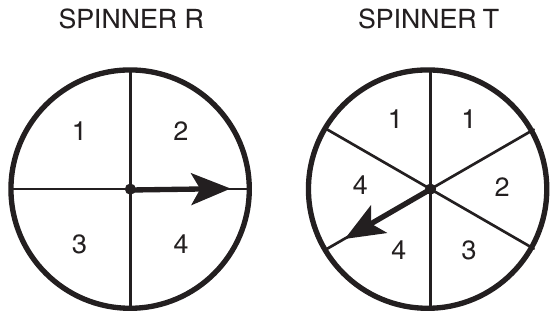
Spinner R determines the digit in the tens place, and Spinner T determines the digit in the ones place. What is the probability that the two-digit number determined by spinning each spinner one time is a prime number?
- A
- B
- C
- D
Show the answer
Correct answer: A
Spinner R has 4 equal sections and Spinner T has 6 equal sections, so the number of possible two-digit numbers that can be created is found by multiplying 4 and 6, which is 24. List the possible outcomes:
| 11 | 11 | 12 | 13 | 14 | 14 |
| 21 | 21 | 22 | 23 | 24 | 24 |
| 31 | 31 | 32 | 33 | 34 | 34 |
| 41 | 41 | 42 | 43 | 44 | 44 |
There are 9 prime numbers out of 24 possible outcomes: 11, 11, 13, 23, 31, 31, 41, 41, and 43.
So the probability that the two-digit number created is a prime number is , which is equivalent to .
Question analysis
Spinner R, with four equal sections, gives the tens digit and Spinner T, with six equal sections and some labels repeated, gives the ones digit of a two-digit number. Students find the probability that the number is prime. Building the full table of outcomes, counting repeated sections separately, and checking whether each number is prime all take care.
- NYS standards
- Grade level
- Grade 7 content, by NYS standard
- Compared with grade 7
- Above grade 7 Listing a sample space for two spinners is grade 7 work, usually with distinct labels and a simple event. Here one spinner repeats two numbers, the space has 24 outcomes, and each two-digit result must be tested for being prime.
- Estimated difficulty
- Hard: combines ideas, needs a plan, and has more than one tempting wrong answer.
- Thinking it demands
- Depth of knowledge 2, skills and concepts · mainly apply
- What makes it hard
- Reading a figure, table or graph moderate
- Much to keep track of moderate
- Something you must already know minor
- Solution
- 4 steps
- Reading level
- Question and choices: about grade 7, 57 words.
- Students, last 30 days
- Not enough answers yet to show (it takes 10).
Why it is hard, traps and wrong answers (shows the answer)
Why it is hard
The question combines a compound sample space with a test for primes, and its figure adds a twist: two labels repeat on Spinner T. Counting the 24 section pairs rather than the 16 different numbers is the careful route, though here both happen to give the same fraction. The points are lost in the prime test, where 33 is easy to count as prime, and in writing the count as a share of all 24 outcomes.
Reading a figure, table or graph moderate Understanding the question
Spinner T has six equal sections but only four labels, with 1 and 4 each appearing twice, so the 24 equally likely outcomes include repeats such as 11 and 11. (Lesh, Post & Behr, 1987; Kirsch & Mosenthal, 1990)
Much to keep track of moderate Working it out
Twenty-four two-digit numbers have to be built and each tested for primality while the repeated sections are kept track of; a 4-by-6 table is the reliable way to hold them. (Sweller, 1988; Carpenter, Just & Shell, 1990)
Something you must already know minor Working it out
Which two-digit numbers are prime is not given; students must test 21, 33, 43 and the rest themselves, and 21 = 3 × 7 and 33 = 3 × 11 look prime at a glance. (Anderson & Krathwohl, 2001)
Strategy: Make a 4-by-6 table with Spinner R's digits as tens and Spinner T's six sections as ones, mark each prime, and count every section, including repeated labels.
Traps
- An arithmetic slip: The right method with a plausible arithmetic error: a digit, a place value or a times-table fact.
- Misunderstands the concept: A wrong belief about a concept: that percents can be added, that area grows like length, that averages can be averaged, that a bigger denominator means a bigger fraction.
- Answers a different question: A choice is right for another quantity: the other unknown, the rest instead of the part, the part instead of the whole.
The wrong answers, classified
B An arithmetic slip (Junker & Sijtsma, 2001)
Counts 33 as prime, missing that 33 = 3 × 11, so 10 of the 24 outcomes look prime and 10/24 reduces to 5/12.
C Misunderstands the concept (Smith, diSessa & Roschelle, 1993; De Bock et al., 1998; Ni & Zhou, 2005)
Finds the 9 prime outcomes but compares them with the 15 that are not prime, a part-to-part ratio, 9/15 = 3/5, instead of dividing by all 24.
D Answers a different question (King et al., 2004; Hegarty, Mayer & Monk, 1995)
Counts the 15 outcomes that are not prime and gives 15/24 = 5/8, the probability of the opposite event.
Worked solution, step by step
Formulas used
- Counting outcomes
- a is the number of equal sections on the first spinner, and b is the number on the second. Each section of the first can go with each section of the second. So the number of pairs is a times b.
- Probability
- P is the probability, the chance that something happens. Possible results are all the results that are equally likely. Wanted results are the ones you are looking for. The chance is the fraction of all the results that you want.
Sort out the question
Spinner R gives the tens digit. Spinner T gives the ones digit. Together they make a two-digit number, like 23. You need the chance that the number is prime. A prime number has exactly two factors, 1 and itself. For example, 13 is prime, but 21 = 3 × 7 is not.
Count all the outcomes
Spinner R has 4 equal sections. Spinner T has 6 equal sections. Look closely: T has two 1s and two 4s. Each section counts as its own outcome.
There are 24 outcomes, all equally likely.
Make a table of the numbers
Each row is a tens digit from R. Each column is a section of T. Prime numbers are in bold.
R 1 1 2 3 4 4 1 11 11 12 13 14 14 2 21 21 22 23 24 24 3 31 31 32 33 34 34 4 41 41 42 43 44 44 Count the prime numbers
Numbers ending in 2 or 4 are even, so 2 divides them. They are not prime. Check the rest. 11, 13, 23, 31, 41 and 43 are prime. But 21 = 3 × 7 and 33 = 3 × 11 are not. Count every section, so 11, 31 and 41 each count twice. That makes 3 + 1 + 2 + 3 = 9 primes. Watch out: counting 33 as prime gives , choice B.
Find the probability
Watch out: divide by all 24 outcomes. Comparing the 9 primes with the 15 others gives , choice C. So the answer is A, .
Check your answer
There are numbers that are not prime. Their chance is . And , as it should be. Notice that , choice D, is the chance of not prime.
More questions like this
The original DOE question
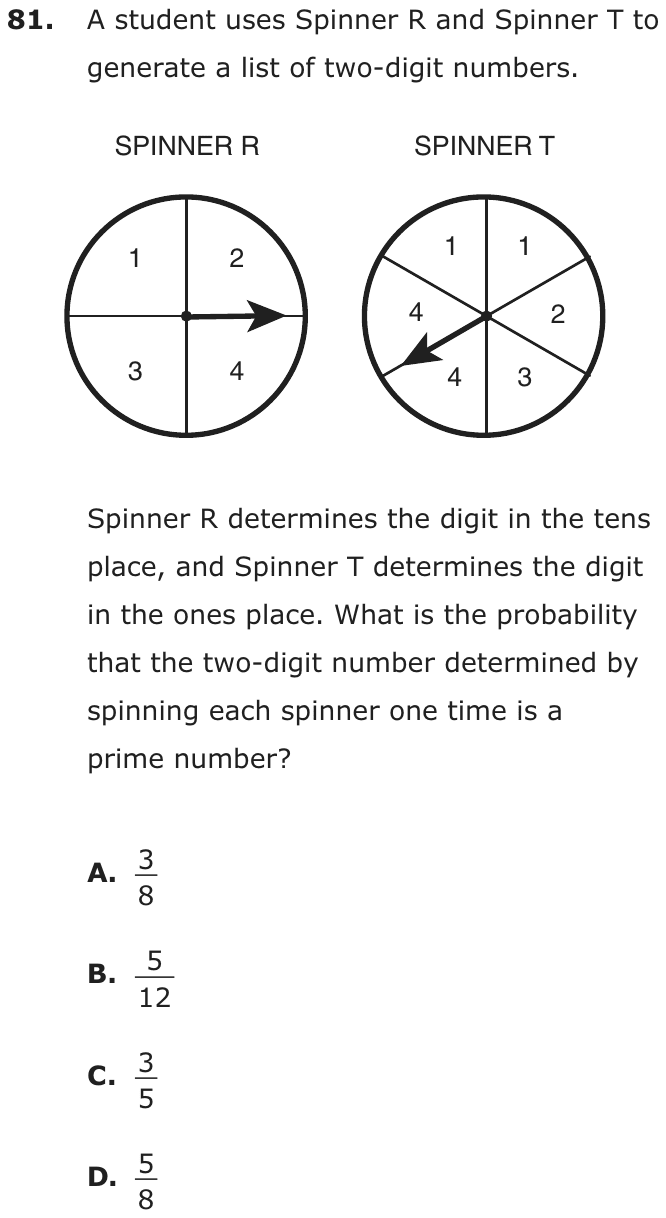
Question 22 of 45
2023 Test A Math, question 32Question
Mei-Ling is one of 6 members of a committee. If 2 members of that committee are selected to go to a conference, how many of the possible pairs of members would include Mei-Ling?
- A5
- B6
- C10
- D12
Show the answer
Correct answer: A
Call the 6 members A, B, C, D, E, and M (for Mei-Ling). The possible combinations are AB, AC, AD, AE, AM, BC, BD, BE, BM, CD, CE, CM, DE, DM, and EM. Of those pairs, 5 include Mei-Ling.
Question analysis
This counting question describes a six-member committee sending two members to a conference and asks how many of the possible pairs include Mei-Ling. Students count combinations in which order does not matter. The traps are counting a pair twice, pairing Mei-Ling with herself, or multiplying the numbers in the question instead of listing the pairs.
- NYS standards
- 7.SP.8b sample spaces for compound events
- Grade level
- Grade 7 content, by NYS standard
- Compared with grade 7
- At grade 7 Grade 7 students count outcomes with organized lists and tree diagrams. Here the list of pairs is short and a single condition, that one named person belongs to the pair, filters it, which matches routine grade 7 counting work.
- Estimated difficulty
- Straightforward: two steps or one careful reading.
- Thinking it demands
- Depth of knowledge 2, skills and concepts · mainly apply
- What makes it hard
- Turning words into math minor
- Much to keep track of minor
- Solution
- 2 steps
- Reading level
- Question and choices: about grade 8, 31 words.
- Students, last 30 days
- Not enough answers yet to show (it takes 10).
Why it is hard, traps and wrong answers (shows the answer)
Why it is hard
The count is small enough to list, so the question rewards a clear picture of what a pair is: two different people, in no particular order. The tempting errors count Mei-Ling as her own partner, count each pair twice, or multiply the two numbers in the stem. Writing the five pairs out, M with each of A through E, takes seconds and rules out all three.
Turning words into math minor Understanding the question
Pairs that include Mei-Ling are simply Mei-Ling with each of the other 5 members, a count of her possible partners, though the phrase “possible pairs” invites counting all 15 pairs. (Hegarty, Mayer & Monk, 1995; Koedinger & Nathan, 2004)
Much to keep track of minor Working it out
Listing pairs by letter, as the explanation does with A to E and M, means tracking which pairs are already written, so that AM and MA are not both counted. (Sweller, 1988; Carpenter, Just & Shell, 1990)
Strategy: Label the members with letters and list every pair that contains Mei-Ling, remembering that a pair is two different people and that order does not matter.
Traps
- Counting the ends: Inclusive or exclusive ends, fence posts, consecutive numbers: an answer that is one too many or too few, or an endpoint drawn open where it belongs closed (or the reverse).
- Overlapping groups: Things in two groups at once are counted twice, or not subtracted.
- Numbers taken from the question: Combines the numbers in the question without a model of the situation, or is simply a number that appears in the question.
The wrong answers, classified
B Counting the ends (Brown & Burton, 1978)
Counts all 6 committee members as possible partners, forgetting that Mei-Ling cannot be paired with herself, one more than the real count.
C Overlapping groups (King et al., 2004)
Counts ordered pairs, Mei-Ling with a partner and that partner with Mei-Ling, as different, so each of the 5 pairs is counted twice.
D Numbers taken from the question (Hegarty, Mayer & Monk, 1995)
Multiplies the 6 members by the 2 people chosen, 6 × 2 = 12, a product of the stem's numbers that counts no actual pairs.
Worked solution, step by step
Formulas used
- Number of pairs in a group
- n is the number of people in the group. Each person can pair up with the n − 1 others. Multiplying counts every pair twice, once from each partner’s side. So you divide by 2.
Sort out the question
The committee has 6 members, and Mei-Ling is one of them. Two members go to the conference together. That makes a pair. You don’t need every possible pair. You only need the pairs that include Mei-Ling.
Find Mei-Ling’s possible partners
A pair with Mei-Ling is Mei-Ling plus one other member. Call Mei-Ling M, and call the other members A, B, C, D and E. Her pairs are M with A, M with B, M with C, M with D and M with E. That is 5 pairs.
Watch out: she can’t be paired with herself. Counting all 6 members as partners gives 6, choice B.
Don’t count a pair twice
Mei-Ling with A is the same pair as A with Mei-Ling. The same two people go either way. Watch out: counting both orders doubles the count to 10, choice C. Multiplying 6 × 2 = 12 gives choice D, but that does not count any pairs.
Check against all the pairs
Count every pair in the committee.
Each pair has 2 people, so the 15 pairs have 30 name spots. All 6 members get the same share: . So the answer is A, 5.
Check your answer
List all 15 pairs: AB, AC, AD, AE, AM, BC, BD, BE, BM, CD, CE, CM, DE, DM, EM. Now circle the ones with M in them: AM, BM, CM, DM, EM. There are exactly 5.
More questions like this
The original DOE question
Question 23 of 45
2023 Test A Math, question 48Question
The manager of a shipping company recorded the weights, in pounds, of the last 9 packages the company shipped. The manager displayed the distribution of the weights in a box plot with the five-number summary shown below:
- minimum: 29
- first quartile: 31
- median: 42
- third quartile: 73
- maximum: 98
Which statement about the distribution of weights is supported by the box plot the manager created?
- AThe minimum, 29, is an outlier.
- BThe maximum, 98, is an outlier.
- CThe interquartile range of the data is 11.
- DThe interquartile range and the median are equal.
Show the answer
Correct answer: D
First, identify the first quartile and the third quartile:
- first quartile: 31
- third quartile: 73
Then, find the difference between the first quartile and the third quartile:
The median is given: 42.
So, the interquartile range and the median are equal.
Question analysis
This statistics question gives the five-number summary of nine package weights shown in a box plot and asks which statement about the distribution is supported. Students compute the interquartile range and decide whether the minimum or the maximum is an outlier. Judging outliers by eye, or subtracting the wrong pair of values for the IQR, makes wrong statements look true.
- NYS standards
- 7.SP.1 box plots and interquartile range
- Grade level
- Grade 7 content, by NYS standard
- Compared with grade 7
- At grade 7 Finding the interquartile range and testing for outliers are grade 7 standards in New York. There is no plot to read here, only five numbers, but every statement has to be checked by calculation, which makes it a careful grade 7 task.
- Estimated difficulty
- Moderate: several steps, or a close reading with one strong distractor.
- Thinking it demands
- Depth of knowledge 2, skills and concepts · mainly apply
- What makes it hard
- Something you must already know moderate
- Every choice must be checked moderate
- Solution
- 3 steps
- Reading level
- Question and choices: about grade 7, 84 words.
- Students, last 30 days
- Not enough answers yet to show (it takes 10).
Why it is hard, traps and wrong answers (shows the answer)
Why it is hard
The numbers are given outright, so the work is knowing what each statement claims and testing it. The outlier statements sound right because 98 looks far from 73 and 29 is the smallest value, but the 1.5 × IQR rule clears both. The true statement needs only one subtraction, 73 − 31, and a look at the median, which happens to have the same value.
Something you must already know moderate Working it out
Neither the interquartile range, the third quartile minus the first, nor the outlier rule, more than 1.5 × IQR beyond a quartile, is defined on the page. (Anderson & Krathwohl, 2001)
Every choice must be checked moderate Choosing the answer
The four statements test different ideas, two possible outliers, a value for the IQR and a comparison of the IQR with the median, so ruling out one says nothing about the next. (Embretson & Wetzel, 1987)
Strategy: Compute the interquartile range from the two quartiles, use it to set the outlier cutoffs 1.5 IQR beyond each quartile, and test every statement against those numbers.
Traps
- Misunderstands the concept: A wrong belief about a concept: that percents can be added, that area grows like length, that averages can be averaged, that a bigger denominator means a bigger fraction.
- Wrong formula: Uses a related but wrong formula: perimeter for area, diameter for radius, area for volume, or a misremembered one.
The wrong answers, classified
A Misunderstands the concept (Smith, diSessa & Roschelle, 1993; De Bock et al., 1998; Ni & Zhou, 2005)
Calls 29 an outlier just because it is the minimum, though it sits only 2 below the first quartile and far inside the cutoff 31 − 63 = −32.
B Misunderstands the concept (Smith, diSessa & Roschelle, 1993; De Bock et al., 1998; Ni & Zhou, 2005)
Judges 98 an outlier because it lies 25 above the third quartile, without testing it against the cutoff 73 + 1.5 × 42 = 136.
C Wrong formula (King et al., 2004)
Subtracts the first quartile from the median, 42 − 31 = 11, instead of from the third quartile, measuring only the lower half of the box.
Worked solution, step by step
Formulas used
- Interquartile range
- Q1, the first quartile, is the middle of the lower half of the data. Q3, the third quartile, is the middle of the upper half. The interquartile range, or IQR, is the distance between them. It is the width of the box in a box plot. It shows how spread out the middle half of the data is.
- Outlier rule
- An outlier is a value far away from the rest of the data. Q1 and Q3 are the quartiles, and IQR is the interquartile range. A value is an outlier if it lies more than 1.5 times the IQR below Q1 or above Q3.
Sort out the question
The manager’s box plot is drawn from the five numbers in the list, so you can work from the list. The weights, in pounds, are: minimum 29, first quartile 31, median 42, third quartile 73, maximum 98. You need the one statement that is true. So check each choice.
Find the interquartile range
The interquartile range is 42 pounds. That makes choice C, which says 11, false.
Compare the IQR with the median
The median is 42 pounds. The interquartile range is also 42 pounds. They are equal, so statement D is true.
Watch out: 42 − 31 = 11 subtracts Q1 from the median, not from Q3. That mistake makes choice C look right.
Test the ends for outliers
An outlier would be below −32 or above 136. The minimum, 29, is not below −32. The maximum, 98, is not above 136. So A and B are false. Watch out: 98 looks far away, but not far enough to be an outlier.
Choose the answer
Only statement D is supported by the five numbers. So the answer is D, the interquartile range and the median are equal.
Check your answer
Check the subtraction by adding back: , which is Q3. The median, 42, sits inside the box, between 31 and 73, as it must. The two measures mean different things, but here they happen to be the same number.
More questions like this
The original DOE question
Question 24 of 45
2023 Test A Math, question 51Question
At a carnival, visitors can win a prize if an employee cannot correctly guess their age. The employee records the first 15 ages that he guesses one Saturday. The box plot shown below displays data about the ages he recorded.

What is the interquartile range of the box plot?
- A7
- B9
- C10
- D11
Show the answer
Correct answer: B
Quartile 1 is the median of the lower half of the data, 8.
Quartile 3 is the median of the upper half of the data, 17.
The interquartile range is 9.
Question analysis
This statistics question shows a box plot of 15 ages that a carnival employee guessed and asks for its interquartile range. Students read the quartiles from the edges of the box and subtract. Confusing the interquartile range with the full range, or using the median line in place of a quartile, gives the wrong choices.
- NYS standards
- 7.SP.1 box plots and interquartile range
- Grade level
- Grade 7 content, by NYS standard
- Compared with grade 7
- At grade 7 Reading a box plot and finding its interquartile range is a grade 7 standard in New York. The values sit on labeled whole-number ticks and one subtraction is needed, a routine grade 7 task once the box's edges are known as the quartiles.
- Estimated difficulty
- Straightforward: two steps or one careful reading.
- Thinking it demands
- Depth of knowledge 2, skills and concepts · mainly apply
- What makes it hard
- Solution
- 2 steps
- Reading level
- Question and choices: about grade 6, 48 words.
- Students, last 30 days
- Not enough answers yet to show (it takes 10).
Why it is hard, traps and wrong answers (shows the answer)
Why it is hard
The arithmetic is one subtraction, so the question tests whether students know which parts of a box plot to use. The whiskers' ends give the range, the line inside the box gives the median, and both are easy to grab in place of the quartiles. The story about the carnival and the 15 ages plays no part in the answer.
Something you must already know minor Working it out
The plot shows five values with no labels, so students must know that the box's ends mark the quartiles and that the interquartile range is the box's width, not the whiskers'. (Anderson & Krathwohl, 2001)
Reading a figure, table or graph minor Understanding the question
The values 7, 8, 10, 17 and 18 are read off a scale ticked at every whole number, with the box's ends at 8 and 17 and the median line at 10. (Lesh, Post & Behr, 1987; Kirsch & Mosenthal, 1990)
Strategy: Find the first and third quartiles on the plot by recalling which parts of a box plot mark them, then subtract the smaller quartile from the larger.
Traps
- Wrong formula: Uses a related but wrong formula: perimeter for area, diameter for radius, area for volume, or a misremembered one.
- Misunderstands the concept: A wrong belief about a concept: that percents can be added, that area grows like length, that averages can be averaged, that a bigger denominator means a bigger fraction.
- Information you don't need: The question gives numbers or facts that play no part in the answer.
The wrong answers, classified
A Wrong formula (King et al., 2004)
Subtracts the median from the third quartile, 17 − 10 = 7, measuring only the part of the box right of the middle line.
C Misunderstands the concept (Smith, diSessa & Roschelle, 1993; De Bock et al., 1998; Ni & Zhou, 2005)
Gives the median, 10, read off the line inside the box, taking a single value on the plot for the spread between the quartiles.
D Wrong formula (King et al., 2004)
Subtracts the minimum from the maximum, 18 − 7 = 11, which is the range shown by the whiskers, not the width of the box.
Worked solution, step by step
Formulas used
- Interquartile range
- Q1, the first quartile, is the middle of the lower half of the data. Q3, the third quartile, is the middle of the upper half. In a box plot, Q1 is the left end of the box and Q3 is the right end. So the IQR is the width of the box.
Sort out the question
A box plot shows five numbers. The whiskers, the lines sticking out, end at the smallest and largest values. The box covers the middle half of the data. The line inside the box is the median, the middle value. You need the interquartile range of the ages.
Read the five numbers
Read each one off the number line below the plot.
- Smallest age, the left whisker: 7
- Q1, the left end of the box: 8
- Median, the line inside the box: 10
- Q3, the right end of the box: 17
- Largest age, the right whisker: 18
Find the interquartile range
The interquartile range is 9 years. Watch out: 18 − 7 = 11 is the range, the whole spread from whisker to whisker. That is choice D. The median, 10, is choice C.
So the answer is B, 9.
Check your answer
Count the spaces across the box. From 8 to 17 there are 9 spaces of 1 year each, so the box is 9 years wide. The answer is also less than the whole range, 11, as it must be.
More questions like this
The original DOE question
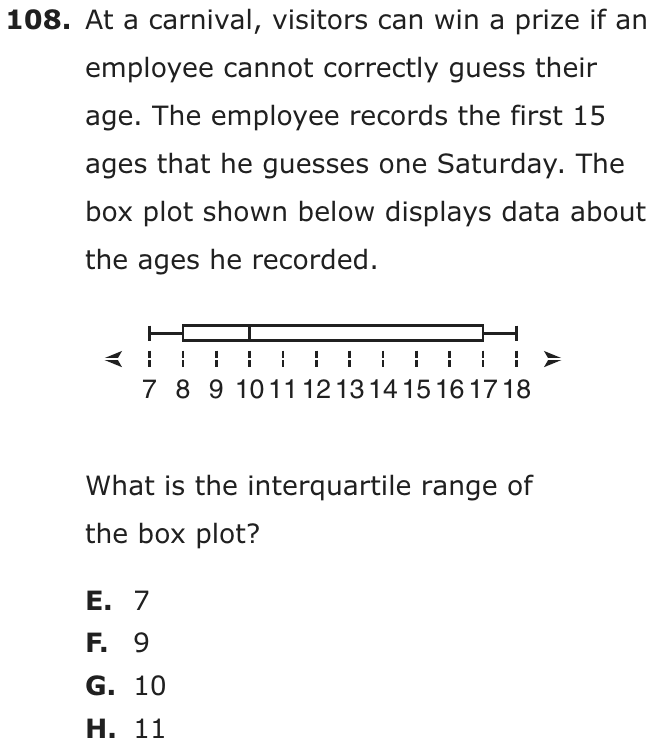
Question 25 of 45
2023 Test A Math, question 53Question
At West College, students are randomly assigned to one of 20 dormitories and one of 6 dining rooms. Kharleen likes 6 of the dormitories and 2 of the dining rooms. What is the probability that she is assigned to both a dormitory and a dining room that she likes?
- A10%
- B12%
- C19%
- D38%
Show the answer
Correct answer: A
Kharleen likes of the dormitories. She likes of the dining rooms. Multiply those fractions together to calculate the probability of Kharleen being assigned to both a dormitory and a dining room that she likes: .
Question analysis
This probability word problem says students at West College are randomly assigned one of 20 dormitories and one of 6 dining rooms, and Kharleen likes 6 dormitories and 2 dining rooms. It asks for the chance that she gets both a dormitory and a dining room she likes. Students combine two independent events and write the result as a percent.
- Grade level
- Grade 7 content, by NYS standard
- Compared with grade 7
- At grade 7 Finding the chance that two independent events both happen is grade 7 compound probability. Each event's chance comes straight from the counts given, and joining them and writing the result as a percent is a typical grade 7 task.
- Estimated difficulty
- Moderate: several steps, or a close reading with one strong distractor.
- Thinking it demands
- Depth of knowledge 2, skills and concepts · mainly apply
- What makes it hard
- Something you must already know moderate
- Turning words into math minor
- A very close wrong answer minor
- Solution
- 3 steps
- Reading level
- Question and choices: about grade 8, 45 words.
- Students, last 30 days
- Not enough answers yet to show (it takes 10).
Why it is hard, traps and wrong answers (shows the answer)
Why it is hard
The question turns on one rule, multiplying the chances of two independent events. Students who know it reduce the fractions first and finish in seconds; students who don't tend to combine the counts, and 6 × 2 = 12 reads naturally as 12%. The other two choices match no common working, so the real contest is between the product of the counts and the product of the chances.
Something you must already know moderate Working it out
The rule that the chance of two independent events both happening is the product of their chances, 3/10 × 1/3, is assumed; nothing in the stem says to multiply. (Anderson & Krathwohl, 2001)
Turning words into math minor Understanding the question
The phrase “both a dormitory and a dining room that she likes” describes two separate random assignments that must both go her way, so the two chances are combined, not compared. (Hegarty, Mayer & Monk, 1995; Koedinger & Nathan, 2004)
A very close wrong answer minor Choosing the answer
The choice 12% sits only 2 points above 10%, so a rough sense that the answer is small cannot separate them; only computing 3/10 × 1/3 does. (Embretson & Wetzel, 1987; Gorin & Embretson, 2006; Ascalon et al., 2007)
Strategy: Write the chance of a liked dormitory and the chance of a liked dining room as fractions, multiply them because both must happen, and convert the product to a percent.
Traps
- Numbers taken from the question: Combines the numbers in the question without a model of the situation, or is simply a number that appears in the question.
- A formula you must know: Needs a formula the test does not give: area, circumference, volume, probability rules.
The wrong answers, classified
B Numbers taken from the question (Hegarty, Mayer & Monk, 1995)
Multiplies the numbers of liked options, 6 × 2 = 12, and reads that product as 12%, without dividing by the 20 × 6 possible assignments.
C Little reason to choose it (Haladyna & Downing, 1993; Rodriguez, 2005)
No combination of 6/20 and 2/6 gives 19%, a value between the right answer and either single chance, so it mostly draws estimates and guesses.
D Little reason to choose it (Haladyna & Downing, 1993; Rodriguez, 2005)
No common working gives 38%, which is larger than either single chance, 30% or about 33%, so it mostly catches guesses.
Worked solution, step by step
Formulas used
- Probability
- P is the probability, the chance that something happens. The top counts the outcomes you want. The bottom counts every outcome that could happen. Each outcome must be equally likely.
- Probability of two separate events
- A and B are two events that don’t affect each other, like two separate random picks. P(A) is the chance of A, and P(B) is the chance of B. The chance that both happen is the two chances multiplied.
Sort out the question
Kharleen gets one of 20 dorms, or dormitories, where students live. She also gets one of 6 dining rooms. Each is picked at random. She likes 6 dorms and 2 dining rooms. You need the chance that she gets a dorm she likes and a dining room she likes.
Find the chance of a liked dorm
She likes 6 of the 20 dorms. Divide the top and bottom by 2 to simplify.
Find the chance of a liked dining room
Use the same formula for the dining rooms.
She likes 2 of the 6 dining rooms. Divide the top and bottom by 2.
Multiply the two chances
The two picks are separate. One doesn’t change the other.
Both must happen, so the chance is smaller than either one alone.
Change to a percent
Watch out: multiplying 6 × 2 = 12 and calling it 12% skips dividing by all the possible assignments. That is choice B. So the answer is A, 10%.
Check your answer
Count every possible assignment. There are dorm and dining room pairs, all equally likely. She likes of them. Then , which is 10%, the same answer.
More questions like this
The original DOE question
Question 26 of 45
2023 Test A Math, question 57Question
Chanelle selects a marble from a container and then returns it to the container. When she does this 3 times, the probability of choosing a red marble all 3 times is . Based on this information, what is the probability of Chanelle choosing a red marble the first time she selects a marble?
- A
- B
- C
- D
Show the answer
Correct answer: D
Let be the probability of Chanelle selecting a red marble the first time. The probability of selecting a red marble three times is , which is given as . Since , the value of x is 6, and the probability of Chanelle selecting a red marble the first time is .
Question analysis
This probability question says Chanelle draws a marble and puts it back, three times, and the chance of red all three times is 1/216. It asks for the chance of red on her first draw. Students reverse the multiplication rule for repeated independent draws, which means finding a cube root, and dividing by 3 is the tempting shortcut.
- Grade level
- Grade 8 content, by NYS standard
- Compared with grade 7
- Above grade 7 Multiplying probabilities for repeated draws with replacement is grade 7 compound probability. Running it backward, from three draws to one, needs a cube root, a grade 8 idea, though the numbers are friendly and the work is short once set up.
- Estimated difficulty
- Moderate: several steps, or a close reading with one strong distractor.
- Thinking it demands
- Depth of knowledge 2, skills and concepts · mainly apply
- What makes it hard
- Something you must already know moderate
- No obvious method minor
- Solution
- 2 steps
- Reading level
- Question and choices: about grade 7, 55 words.
- Students, last 30 days
- Not enough answers yet to show (it takes 10).
Why it is hard, traps and wrong answers (shows the answer)
Why it is hard
Once the three draws are seen as one chance cubed, the question is a cube root, and 216 is a perfect cube many students know. The risk lies in undoing the cube the wrong way: dividing by 3 because there are three draws, or stopping at 36 after one division by 6. A quick check, 1/6 × 1/6 × 1/6 = 1/216, confirms the answer.
Something you must already know moderate Working it out
Students must know that three draws with the marble returned each time multiply, p × p × p, and must recognize 216 as 6 × 6 × 6; the stem states neither. (Anderson & Krathwohl, 2001)
No obvious method minor Working it out
The usual direction runs from one draw to three; here the three-draw chance is given and the bold first asks for one draw, so students work backward and undo a cube. (Schoenfeld, 1985)
Strategy: Call the chance of red on one draw p, so three draws with replacement give p × p × p; then find the number whose cube equals the given probability.
Traps
- Wrong operation: Adds instead of multiplying, divides the wrong way round, turns a ratio or rate upside down, or undoes a step in the wrong direction (subtracts what should be added back).
- Stops one step early: A choice is a number from partway through the solution.
The wrong answers, classified
A Wrong operation (Hegarty, Mayer & Monk, 1995; King et al., 2004)
Divides 216 by 3 because there are three draws, instead of finding the number that multiplied by itself three times makes 216.
B Stops one step early (King et al., 2004; Gierl et al., 2017)
Divides 216 by 6 to get 36 and stops one division short, keeping 1/36, which is the chance of two reds in a row, not one.
C Little reason to choose it (Haladyna & Downing, 1993; Rodriguez, 2005)
No working with 1/216 gives 1/8, the chance of three heads in three coin tosses, so it mostly attracts guesses at a familiar fraction.
Worked solution, step by step
Formulas used
- Probability of repeated picks
- p is the chance of red on one pick. Chanelle puts the marble back each time, so every pick has the same chance p, and one pick doesn’t change the next. The chance of red on all three picks is the three chances multiplied.
Sort out the question
Chanelle picks a marble and puts it back, 3 times. The chance of red all 3 times is . You need the chance of red on just the first pick. Call that chance p.
Write the three picks as a product
She puts each marble back, so the container is the same every time. Each pick has the same chance, p.
Find the number that fits
You need a fraction that, multiplied by itself three times, makes . Its top is 1, since 1 × 1 × 1 = 1. For the bottom, find a number that times itself three times makes 216.
So the bottom is 6, and p is .
Avoid the tempting shortcuts
Watch out: dividing 216 by 3 gives 72, choice A. Three picks means multiplying three times, not dividing by 3. Also, is the chance of red twice in a row, choice B.
So the answer is D, .
Check your answer
Multiply it out: . That matches the question. Choice A fails fast: is already far smaller than .
More questions like this
The original DOE question
Question 27 of 45
2023 Test B Math, question 10Question
A total of 24 students in a math class took a 100-point test:
- None of the students scored 100 points.
- 75% of the students scored less than 82 points.
- The lowest score in the class was 54 points.
Which box plot best represents the test scores from this math class?
- A
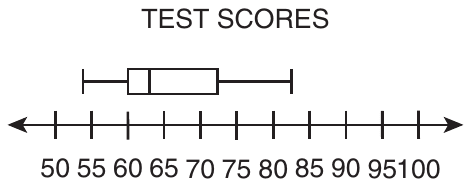
- B
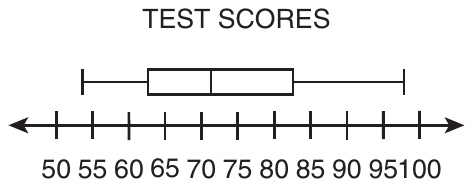
- C
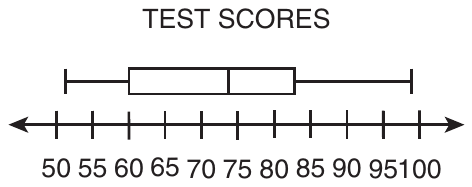
- D
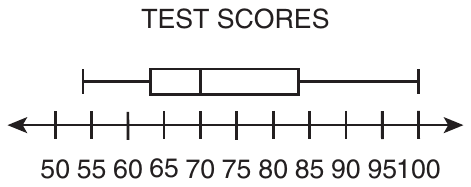
Show the answer
Correct answer: B
Use the information in the bullet points to reason which box plot could represent the data set of test scores.
Since none of the students scored 100, the maximum value on the box plot must be less than 100.
If 75% of the students scored less than 82, then 25% scored 82 points or more. Since the third quartile (Q3) indicates (75%) of the data is to the left and (25%) of the data is to the right, it is reasonable that Q3 would be at or about 82.
Given that the lowest score in the class was 54, the minimum point on the box plot must be 54.
The box plot graph in option B is the only one that meets all three criteria.
Question analysis
Twenty-four students took a 100-point test: nobody scored 100, 75% scored below 82, and the lowest score was 54. Students choose the box plot that fits all three facts. The skill is linking each statement to a part of the plot, the whiskers, the box and the quartiles, and checking every plot closely.
- NYS standards
- 7.SP.1 box plots and interquartile range
- Grade level
- Grade 7 content, by NYS standard
- Compared with grade 7
- At grade 7 Grade 7 students usually read values off a box plot. This item runs the other way, turning a percent statement into a quartile and checking the whiskers against two more facts, but the content stays at grade 7.
- Estimated difficulty
- Moderate: several steps, or a close reading with one strong distractor.
- Thinking it demands
- Depth of knowledge 2, skills and concepts · mainly analyze
- What makes it hard
- Every choice must be checked moderate
- Reading a figure, table or graph moderate
- Something you must already know minor
- Solution
- 3 steps
- Reading level
- Question and choices: about grade 2, 45 words.
- Students, last 30 days
- Not enough answers yet to show (it takes 10).
Why it is hard, traps and wrong answers (shows the answer)
Why it is hard
The question turns three sentences into three features of a box plot, and a plot that matches two of them is easy to accept. The upper-quartile fact is the conceptual one: students who do not know that the box’s right edge marks 75 percent put 82 at the end of the whisker. The other two facts are quick visual checks, but only if every plot is actually checked.
Every choice must be checked moderate Choosing the answer
Each wrong plot fails a different fact, so all four must be tested against all three bullets: the left whisker against 54, the right whisker against 100, and the box’s right edge against 82. (Embretson & Wetzel, 1987)
Reading a figure, table or graph moderate Understanding the question
The axis is labeled every 5 points, and the deciding features fall between labels: one left whisker starts near 51 instead of 54, and box edges sit near 82.5. (Lesh, Post & Behr, 1987; Kirsch & Mosenthal, 1990)
Something you must already know minor Working it out
Nothing explains that “75% of the students scored less than 82” locates the upper quartile, the right edge of the box, rather than the highest score. (Anderson & Krathwohl, 2001)
Strategy: Turn each fact into a feature to check: where the left whisker starts, where the right whisker ends, and where the box ends. Rule out any plot that breaks one.
Traps
- Misreads the question: Misses or misreads a condition or a word in the question: "at least", "each", "remaining", "not".
- Misunderstands the concept: A wrong belief about a concept: that percents can be added, that area grows like length, that averages can be averaged, that a bigger denominator means a bigger fraction.
- Misreads the figure: Reads a value, label or tick spacing in a figure, table or graph wrongly.
The wrong answers, classified
A Misunderstands the concept (Smith, diSessa & Roschelle, 1993; De Bock et al., 1998; Ni & Zhou, 2005)
Puts 82 at the end of the right whisker, as if it were the highest score, when 75 percent below 82 marks the box’s right edge.
C Misreads the figure (Lesh, Post & Behr, 1987; Kirsch & Mosenthal, 1990)
Accepts the left whisker as starting at the lowest score, 54, when it begins near 51, just past the 50 tick.
D Misreads the question (Hegarty, Mayer & Monk, 1995)
Matches the lowest score and the box’s right edge near 82 but overlooks that a whisker reaching 100 means someone scored 100.
Worked solution, step by step
Formulas used
- Parts of a box plot
- A box plot shows five numbers. The left whisker starts at the minimum, the lowest value. The box starts at Q1, the first quartile, and ends at Q3, the third quartile. The line inside is the median, the middle value. The right whisker ends at the maximum. About a quarter of the data falls in each of the four sections.
Sort out the question
24 students took a test. You know three facts. Nobody scored 100. 75% scored less than 82. The lowest score was 54. You need the box plot that fits all three facts.
Turn each fact into a feature
Match each fact to a part of the box plot.
- The lowest score is 54, so the left whisker starts at 54.
- Nobody scored 100, so the right whisker ends before 100.
- 75% is three quarters. Three quarters of the scores are below Q3. So the box should end at about 82.
Read the number line
The ticks are 5 points apart: 50, 55, 60 and so on. A score of 54 sits just left of the 55 tick. A score of 82 sits a little less than halfway from 80 to 85. Look closely, because these points fall between labels.
Check plot A
In plot A, the right whisker ends near 82, and the box ends near 72. That would make 82 the highest score. Watch out: 75% below 82 does not make 82 the top score. It tells you where the box ends. So A is out.
Check plot C
In plot C, the left whisker starts near 51, just right of the 50 tick. But the lowest score was 54. So C is out.
Check plot D
Plot D starts at 54, and its box ends near 82. But its right whisker reaches 100. That means someone scored 100, and nobody did. Watch out: D fits two facts, so it is easy to stop early. Check all three. So D is out.
Check plot B and answer
Plot B starts at 54. Its box ends near 82. Its right whisker stops near 98, below 100. It fits all three facts. So the answer is B.
Check your answer
Go over B once more with all three facts. Its lowest point is 54. Its box ends near 82. Its highest point is under 100. Each other plot breaks one fact: A’s box, C’s left whisker and D’s right whisker.
More questions like this
The original DOE question
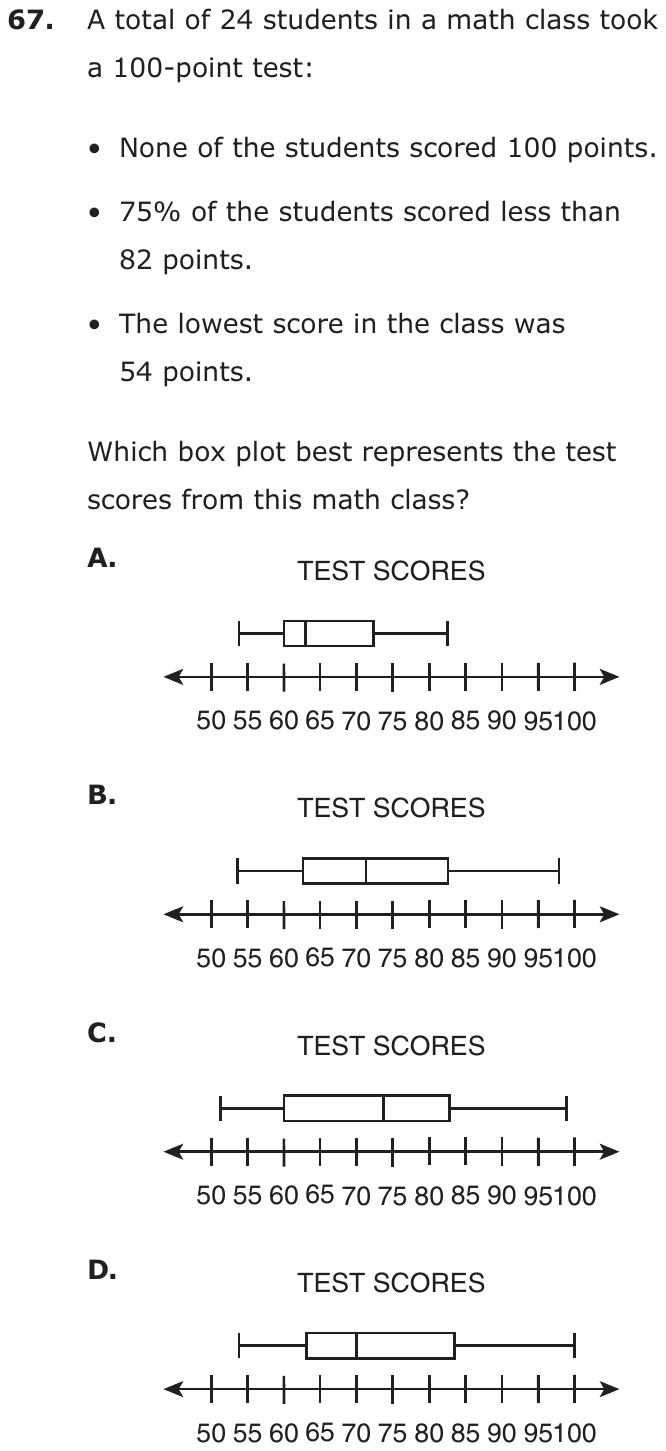
Question 28 of 45
2023 Test B Math, question 22Question
A vendor is selling 10 packages of homemade fudge at a bake sale. The vendor weighed and labeled each package. The package weights are given in ounces:
| 4.6 | 6.0 | 3.8 | 3.5 | 4.5 |
| 5.4 | 3.9 | 6.5 | 4.8 | 6.2 |
The vendor created a box plot of the package weights. Which box plot best represents the data?
- A
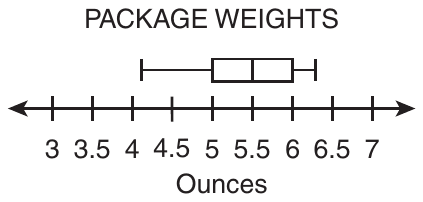
- B
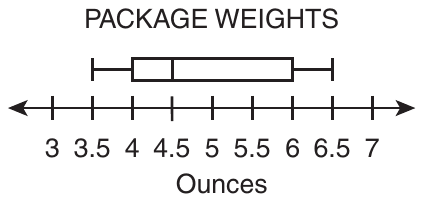
- C
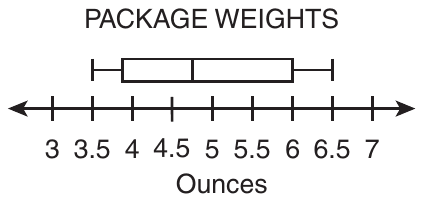
- D
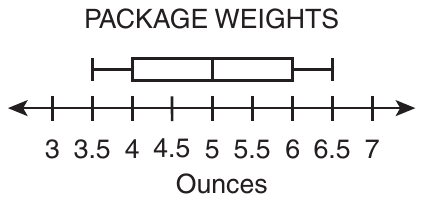
Show the answer
Correct answer: C
A set of 10 data points is given. The first step for determining the quartiles and minimum and maximum values of the box plot is to order the data from smallest to greatest value. For this data set the order is:
| 3.5 | 3.8 | 3.9 | 4.5 | 4.6 |
| 4.8 | 5.4 | 6.0 | 6.2 | 6.5 |
The minimum value is the smallest decimal, 3.5, and the maximum value is the greatest decimal, 6.5.
To determine the median in a set with an even number of values, locate the two middle values (5th and 6th in this case): 4.6 and 4.8. Determine the mean, or average, of the two middle numbers by adding them together and dividing the sum by 2:
To determine the value of the first quartile (Q1), locate the middle value of the 5 terms to the left of the median:
| 3.5 | 3.8 | 3.9 | 4.5 | 4.6 |
To determine the value of the third quartile (Q3), locate the middle value of the 5 terms to the right of the median:
| 4.8 | 5.4 | 6.0 | 6.2 | 6.5 |
Box plot C identifies the correct minimum, maximum, median, and quartiles of the data set.
Question analysis
A vendor weighs 10 packages of homemade fudge, from 3.5 to 6.5 ounces, and makes a box plot of the weights. Students choose the box plot that matches the data. They must sort the decimals, find the median of an even number of values and both quartiles, then compare plots that differ only slightly.
- Grade level
- Grade 7 content, by NYS standard
- Compared with grade 7
- Above grade 7 Building a box plot from data is grade 7 content. This version needs all five summary values from ten unsorted decimals, including a median between two values, then a close comparison of plots, longer and finer than typical.
- Estimated difficulty
- Hard: combines ideas, needs a plan, and has more than one tempting wrong answer.
- Thinking it demands
- Depth of knowledge 2, skills and concepts · mainly apply
- What makes it hard
- Many steps moderate
- A very close wrong answer moderate
- Reading a figure, table or graph moderate
- Slow to do carefully minor
- Solution
- 4 steps
- Reading level
- Question and choices: about grade 4, 43 words.
- Students, last 30 days
- Not enough answers yet to show (it takes 10).
Why it is hard, traps and wrong answers (shows the answer)
Why it is hard
Most of the work happens before the plots are even read: the weights must be sorted, and the median of ten values is the average of two of them. After that, three plots look almost identical, so a careless median, taken from the unsorted list or placed halfway between the extremes, settles on a wrong one. The careful student checks the median line and the box’s left edge against values that fall between the tick marks.
Many steps moderate Working it out
Ten unsorted decimals must be ordered, then five values found: the median as the mean of the fifth and sixth, 4.6 and 4.8, and each quartile as the middle of its half. (Daniel & Embretson, 2010; Enright, Morley & Sheehan, 2002)
A very close wrong answer moderate Choosing the answer
Three plots share whiskers at 3.5 and 6.5 and a box ending at 6; they differ only in the median line, at 4.5, near 4.75 or at 5, and in where the box starts. (Embretson & Wetzel, 1987; Gorin & Embretson, 2006; Ascalon et al., 2007)
Reading a figure, table or graph moderate Understanding the question
The axis is ticked every half ounce, and the correct plot’s median, 4.7, and lower quartile, 3.9, both fall between ticks, so each line’s position must be judged by eye. (Lesh, Post & Behr, 1987; Kirsch & Mosenthal, 1990)
Slow to do carefully minor Choosing the answer
Sorting ten decimals, computing a five-number summary and comparing four plots takes well over a minute and a half when done carefully. (Lu & Sireci, 2007)
Strategy: Sort the ten weights, then find the least and greatest, the median as the mean of the fifth and sixth values, and each quartile as the middle of its half.
Traps
- Wrong formula: Uses a related but wrong formula: perimeter for area, diameter for radius, area for volume, or a misremembered one.
- A faulty procedure: A systematic but wrong procedure: adding fractions straight across, applying an exponent to each term of a sum, dropping a sign when moving a term.
The wrong answers, classified
A Little reason to choose it (Haladyna & Downing, 1993; Rodriguez, 2005)
No working from these weights gives whiskers near 4.1 and 6.3 or a median of 5.5, since the data run from 3.5 to 6.5, so it mostly draws guesses.
B A faulty procedure (Brown & Burton, 1978; Tatsuoka, 1983)
Skips sorting and takes 4.5, the fifth weight as printed, for the median, so the plot with its median line on 4.5 seems to fit.
D Wrong formula (King et al., 2004)
Finds the median with the midrange formula, (3.5 + 6.5) ÷ 2 = 5, halfway between the lightest and heaviest packages instead of the middle of the sorted weights.
Worked solution, step by step
Formulas used
- Median of an even number of values
- First put the values in order. With an even number of values, two sit in the middle. The median is their mean, or average: add them and divide by 2. The median splits the data in half.
- Quartiles
- Q1 is the first quartile and Q3 is the third quartile. Split the ordered data in half at the median. Q1 is the middle of the lower half, and Q3 is the middle of the upper half. A box plot’s box runs from Q1 to Q3.
Sort out the question
The vendor weighed 10 packages of fudge, in ounces. You need the box plot that matches the weights. A box plot is built from five numbers. They are the minimum (least), the first quartile Q1, the median, the third quartile Q3 and the maximum (greatest). So find those five numbers first.
Put the weights in order
List the 10 weights from least to greatest.
3.5 3.8 3.9 4.5 4.6 4.8 5.4 6.0 6.2 6.5 Watch out: you must sort first. The fifth weight as printed is 4.5. Using it as the median points to choice B.
Find the least and greatest
The minimum is 3.5 ounces and the maximum is 6.5 ounces. So the whiskers must run from 3.5 to 6.5. Plot A’s whiskers run from about 4.1 to about 6.3, so A is out.
Find the median
With 10 weights, the two middle ones are the 5th and 6th: 4.6 and 4.8.
The median is 4.7 ounces. Watch out: the median is not halfway between the least and greatest. That gives and points to choice D.
Find the two quartiles
The lower half is the 5 weights below the median: 3.5, 3.8, 3.9, 4.5 and 4.6. Its middle value is .
The upper half is the 5 weights above the median: 4.8, 5.4, 6.0, 6.2 and 6.5. Its middle value is .
Match the summary to a plot
The five numbers are 3.5, 3.9, 4.7, 6.0 and 6.5. Plots B, C and D all run from 3.5 to 6.5, and their boxes end at 6. They differ in the median line and where the box starts.
- B: the box starts at 4, and the median line is at 4.5.
- D: the box starts at 4, and the median line is at 5.
- C: the box starts just left of 4, and the median line is between 4.5 and 5.
C is the closest match to a Q1 of 3.9 and a median of 4.7. So the answer is C.
Check your answer
A median splits the data in half. Five weights, 3.5 to 4.6, are below 4.7. Five, 4.8 to 6.5, are above it. A median line at 5, as in D, would have six weights below it. A line at 4.5, as in B, would have only three below it.
More questions like this
The original DOE question
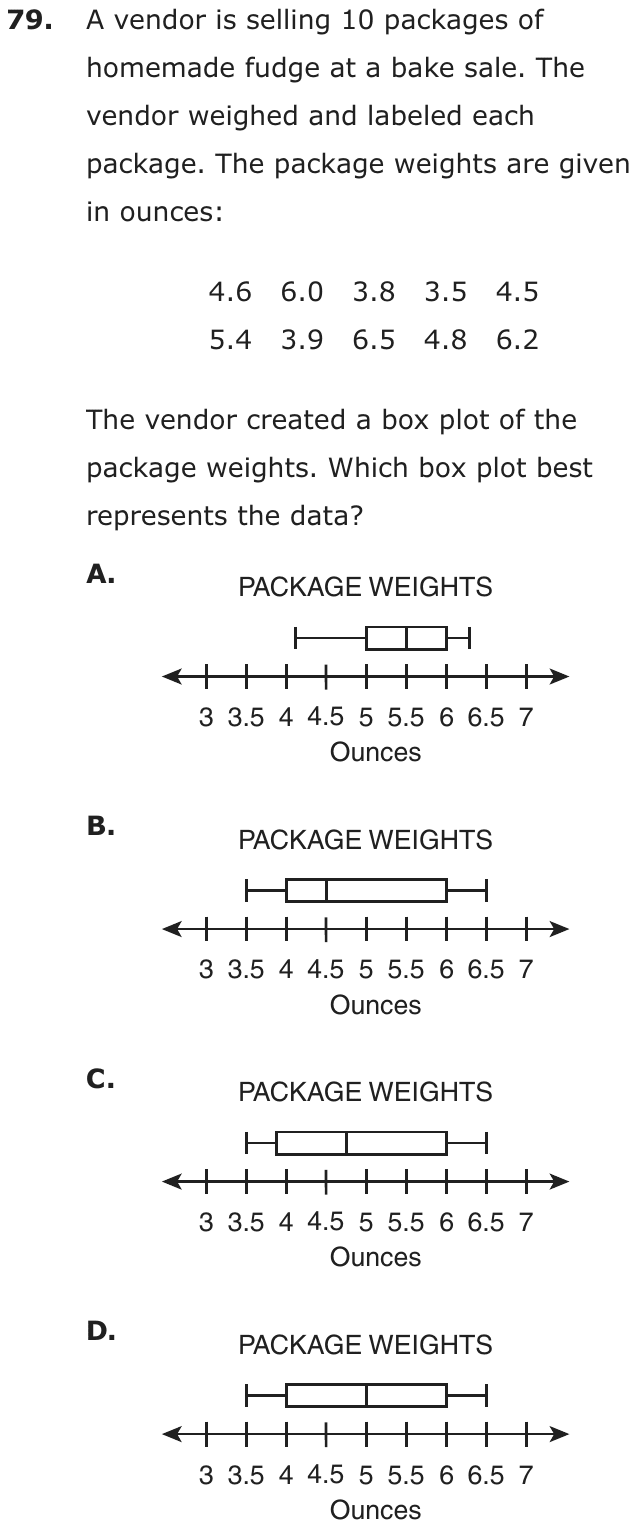
Question 29 of 45
2023 Test B Math, question 26Question
The box plot below represents a set of data.

What is the interquartile range of the set of data?
- A9
- B12
- C21
- D27
Show the answer
Correct answer: C
First, determine the values of the upper and lower quartiles of the set of data:
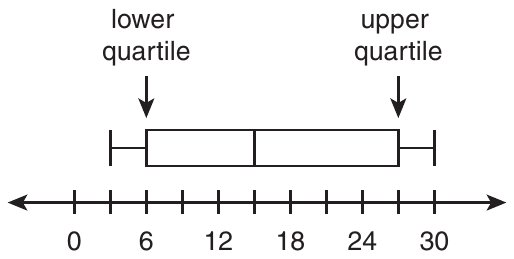
- The upper quartile value is indicated by the vertical line segment at the far right edge of the box plot above the hash mark representing 27.
- The lower quartile value is indicated by the vertical line segment at the far left edge of the box plot above the hash mark representing 6.
To determine the interquartile range, subtract the lower quartile value (6) from the upper quartile value (27):
Question analysis
A box plot on a number line marked every 3 units, with labels every 6, represents a set of data. Students find the interquartile range. They have to read the two ends of the box, one of which falls on an unlabeled tick, and remember exactly which part of the plot the interquartile range measures.
- NYS standards
- 7.SP.1 box plots and interquartile range
- Grade level
- Grade 7 content, by NYS standard
- Compared with grade 7
- At grade 7 Finding the interquartile range from a box plot is a grade 7 skill, and this is a typical example. Read two values and subtract; the only extra care is a box edge that falls on a tick with no label.
- Estimated difficulty
- Straightforward: two steps or one careful reading.
- Thinking it demands
- Depth of knowledge 1, recall and reproduction · mainly apply
- What makes it hard
- Solution
- 2 steps
- Reading level
- Question and choices: about grade 6, 19 words.
- Students, last 30 days
- Not enough answers yet to show (it takes 10).
Why it is hard, traps and wrong answers (shows the answer)
Why it is hard
Once the two edges of the box are read, one subtraction finishes the question, so the work is reading the scale and knowing which part of the plot is meant. The upper quartile falls on an unlabeled tick, which costs care. The wrong answers measure the whole spread or only half of the box, all common mix-ups of what the interquartile range covers.
Reading a figure, table or graph moderate Understanding the question
The axis is labeled only every 6 units but ticked every 3, and the box’s right edge sits on the unlabeled tick for 27, so it has to be counted from 24. (Lesh, Post & Behr, 1987; Kirsch & Mosenthal, 1990)
Something you must already know minor Working it out
Nothing defines the interquartile range; it is the width of the box, the upper quartile minus the lower, not the span of the whiskers. (Anderson & Krathwohl, 2001)
Strategy: Find the values at the left and right edges of the box, counting tick marks in steps of 3 where there is no label, and subtract the smaller from the larger.
Traps
- Wrong formula: Uses a related but wrong formula: perimeter for area, diameter for radius, area for volume, or a misremembered one.
The wrong answers, classified
A Wrong formula (King et al., 2004)
Gives the median minus the lower quartile, 15 − 6 = 9, as the interquartile range, measuring only the left part of the box.
B Wrong formula (King et al., 2004)
Gives the upper quartile minus the median, 27 − 15 = 12, as the interquartile range, measuring only the right part of the box.
D Wrong formula (King et al., 2004)
Subtracts the ends of the whiskers, 30 − 3 = 27, giving the range of the data instead of the interquartile range.
Worked solution, step by step
Formulas used
- Interquartile range
- IQR stands for interquartile range. Q3, the third quartile, is the right edge of a box plot’s box. Q1, the first quartile, is the left edge. Subtracting gives the width of the box, where the middle half of the data lies.
Sort out the question
You see a box plot and need the interquartile range, or IQR. That is the width of the box: the upper quartile minus the lower quartile. The whiskers don’t matter here.
Read the number line
The labels are 0, 6, 12, 18, 24 and 30. But there is a tick mark halfway between each pair of labels. So the ticks go up by 3: 0, 3, 6, 9 and so on. The tick between 24 and 30 stands for 27.
Find the edges of the box
The left edge of the box is at 6. That is the lower quartile, Q1. The right edge is at the unlabeled tick after 24, which is 27. That is the upper quartile, Q3.
Subtract to find the IQR
Watch out: uses the ends of the whiskers. That is the range, choice D. Also, the median line at 15 splits the box. and are each only part of the box. So the answer is C, 21.
Check your answer
Count the tick spaces across the box, from 6 to 27. There are 7 spaces, and each is worth 3. So the box is units wide. That matches.
More questions like this
The original DOE question
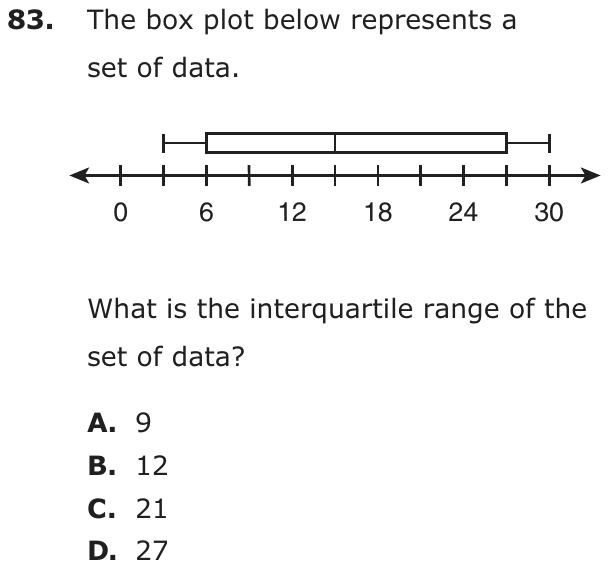
Question 30 of 45
2023 Test B Math, question 34Question
There are 3 different highways from City W to City X, 4 different highways from City X to City Y, and 3 different highways from City Y to City Z. How many different routes are there for a trip from City W to City X to City Y to City Z?
- A10
- B12
- C24
- D36
Show the answer
Correct answer: D
Multiply the numbers of highways between each pair of cities:
Question analysis
A counting question about highways: there are 3 highways from City W to City X, 4 from X to Y and 3 from Y to Z. Students count the different routes from W to Z through X and Y. It tests the counting principle, and deciding whether to add or multiply the numbers of highways is the key.
- NYS standards
- 7.SP.8b sample spaces for compound events
- Grade level
- Grade 7 content, by NYS standard
- Compared with grade 7
- Below grade 7 Grade 7 students build tree diagrams and lists for compound events. This item needs only the counting principle across three stages, with no restriction on the choices, which makes it shorter than typical grade 7 work.
- Estimated difficulty
- Routine: one familiar step, little to misread.
- Thinking it demands
- Depth of knowledge 2, skills and concepts · mainly apply
- What makes it hard
- Solution
- 1 step
- Reading level
- Question and choices: about grade 11, 48 words.
- Students, last 30 days
- Not enough answers yet to show (it takes 10).
Why it is hard, traps and wrong answers (shows the answer)
Why it is hard
Once a route is seen as one highway on each of three stretches, the count is a single product, 3 × 4 × 3. The wrong choices come from adding the counts, from stopping after two stretches, and from adding two-stretch products. A small tree for the first two stretches shows why the numbers multiply: each of the 3 highways to City X branches into 4.
Something you must already know minor Working it out
The counting principle, multiplying the 3, 4 and 3 highway choices because each route uses one highway on every stretch, is assumed; the stem never says to multiply. (Anderson & Krathwohl, 2001)
Strategy: A route uses one highway on each of the three stretches, so count the choices for each stretch and multiply; a small tree for two stretches shows why.
Traps
- Wrong operation: Adds instead of multiplying, divides the wrong way round, turns a ratio or rate upside down, or undoes a step in the wrong direction (subtracts what should be added back).
- Stops one step early: A choice is a number from partway through the solution.
The wrong answers, classified
A Wrong operation (Hegarty, Mayer & Monk, 1995; King et al., 2004)
Adds the highways, 3 + 4 + 3 = 10, counting the roads available rather than the ways to choose one road on each stretch.
B Stops one step early (King et al., 2004; Gierl et al., 2017)
Multiplies the first two stretches, 3 × 4 = 12 routes from City W to City Y, and stops before the 3 highways on to City Z.
C Wrong operation (Hegarty, Mayer & Monk, 1995; King et al., 2004)
Counts routes two stretches at a time, 3 × 4 = 12 for W to Y and 4 × 3 = 12 for X to Z, and adds them instead of multiplying all three.
Worked solution, step by step
Formulas used
- Counting principle
- a, b and c are the numbers of choices for the first, second and third parts of a task. Every choice for one part can go with every choice for the others. So you multiply. Use it when you make one choice at each stage and want to count all the ways.
Sort out the trip
A route goes from City W to X, then to Y, then to Z. It uses exactly one highway on each of three stretches:
- W to X: 3 highways
- X to Y: 4 highways
- Y to Z: 3 highways
You need to count all the different routes.
Count routes from W to Y
Start small. Pick any of the 3 highways to City X. From there, you can take any of the 4 highways to City Y. So each first highway leads to 4 routes.
There are 12 routes from City W to City Y.
Add the last stretch
Each of those 12 routes can end with any of the 3 highways to City Z. So multiply again. This is the counting principle with all three stretches.
There are 36 routes in all.
Avoid the common traps
Watch out: Adding 3 + 4 + 3 = 10 counts highways, not routes. That gives choice A. Stopping at 12 forgets the last stretch, choice B. Adding 12 + 12 = 24 mixes two partial counts, choice C. A route is built by choosing one highway after another, so you multiply.
So the answer is D, 36.
Check your answer
Picture one highway from W to X. After it, there are 4 × 3 = 12 ways to finish the trip. Each of the 3 highways from W to X gives 12 ways. That makes 12 + 12 + 12 = 36 routes.
More questions like this
The original DOE question
Question 31 of 45
2023 Test B Math, question 47Question
Four slips of paper numbered 1, 2, 3, and 4 were placed in a bag:
- One slip was selected from the bag, and the number recorded.
- Without replacement, a second slip was chosen.
- This process continued until no more slips remained in the bag.
- One part of a tree diagram representing the sample space is shown.
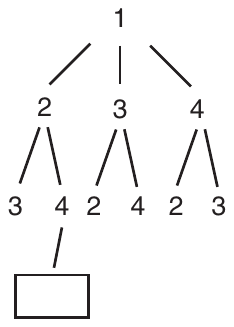
Which number should be placed in the box to complete this part of the tree diagram?
- A1
- B2
- C3
- D4
Show the answer
Correct answer: C
The “without replacement” statement means that the bag contained four slips for the first draw, three slips for the second draw, two slips for the third draw, and one slip for the last draw. Following the branch from the top and navigating down to the box, the 1 was chosen first, the 2 was chosen second, and the 4 was chosen third. The only remaining number is 3. The element would be 1243.
Question analysis
Four slips numbered 1 to 4 are drawn from a bag one at a time without replacement, and part of a tree diagram of the outcomes is shown. Students decide which number belongs in the empty box at the end of one branch. It tests reading a tree diagram and understanding what drawing without replacement means.
- NYS standards
- 7.SP.8b sample spaces for compound events
- Grade level
- Grade 7 content, by NYS standard
- Compared with grade 7
- Below grade 7 Tree diagrams for compound events are a grade 7 topic, but here the tree is already drawn and only one box is empty. Following a single branch to that box is shorter than typical grade 7 work with sample spaces.
- Estimated difficulty
- Routine: one familiar step, little to misread.
- Thinking it demands
- Depth of knowledge 2, skills and concepts · mainly understand
- What makes it hard
- Solution
- 2 steps
- Reading level
- Question and choices: about grade 5, 68 words.
- Students, last 30 days
- Not enough answers yet to show (it takes 10).
Why it is hard, traps and wrong answers (shows the answer)
Why it is hard
Only one branch matters, and once it is read as the slips drawn so far, 1, 2 and 4, the last slip left in the bag is the only one missing. Errors come from not counting the top 1 as a draw, from forgetting that a drawn slip stays out, or from copying a nearby number in the diagram instead of following the path.
Reading a figure, table or graph minor Understanding the question
The box hangs below the branch 1, then 2, then 4, and students must read that path from the top as the order of the first three draws. (Lesh, Post & Behr, 1987; Kirsch & Mosenthal, 1990)
Strategy: Follow the branch from the top down to the box, list the slips already drawn on that path, and name the one still left in the bag.
Traps
- Without replacement: In a second pick there is one fewer item, which changes the probability.
- Misreads the figure: Reads a value, label or tick spacing in a figure, table or graph wrongly.
The wrong answers, classified
A Misreads the figure (Lesh, Post & Behr, 1987; Kirsch & Mosenthal, 1990)
Treats the 1 at the top as the start of the diagram rather than the first slip drawn, so 1 seems still to be in the bag.
B Without replacement (Fischbein & Schnarch, 1997)
Lets slip 2, already drawn second on this branch, come up again, missing that a slip drawn without replacement stays out of the bag.
D Numbers taken from the question (Hegarty, Mayer & Monk, 1995)
Copies 4, the number directly above the box, reading the diagram as a pattern of numbers rather than as the order of the draws.
Worked solution, step by step
Sort out the question
The bag holds four slips: 1, 2, 3 and 4. Slips are drawn one at a time. “Without replacement” means a drawn slip does not go back in the bag. So each number can be drawn only once.
Read the tree diagram
A tree diagram shows the orders the draws can happen in. Each row going down is one draw. The 1 at the top is the first slip drawn. The numbers below it are the choices for the second draw, and so on.
Follow the path to the box
Start at the top and go down the lines to the box.
- First draw: 1
- Second draw: 2
- Third draw: 4
- Fourth draw: the box
Slips 1, 2 and 4 are already out of the bag.
Find the slip that is left
The bag started with 1, 2, 3 and 4. Only slip 3 has not been drawn. So it must be the fourth draw.
Watch out: The 1 at the top counts as a draw, so 1 is not left. That trap is choice A. Slip 2 was already drawn, so choice B can’t be right. And 4 is just the number above the box, choice D.
So the answer is C, 3.
Check your answer
Read the whole path: 1, 2, 4, 3. Each number from 1 to 4 shows up exactly once. That is just what should happen when no slip goes back in the bag.
More questions like this
The original DOE question
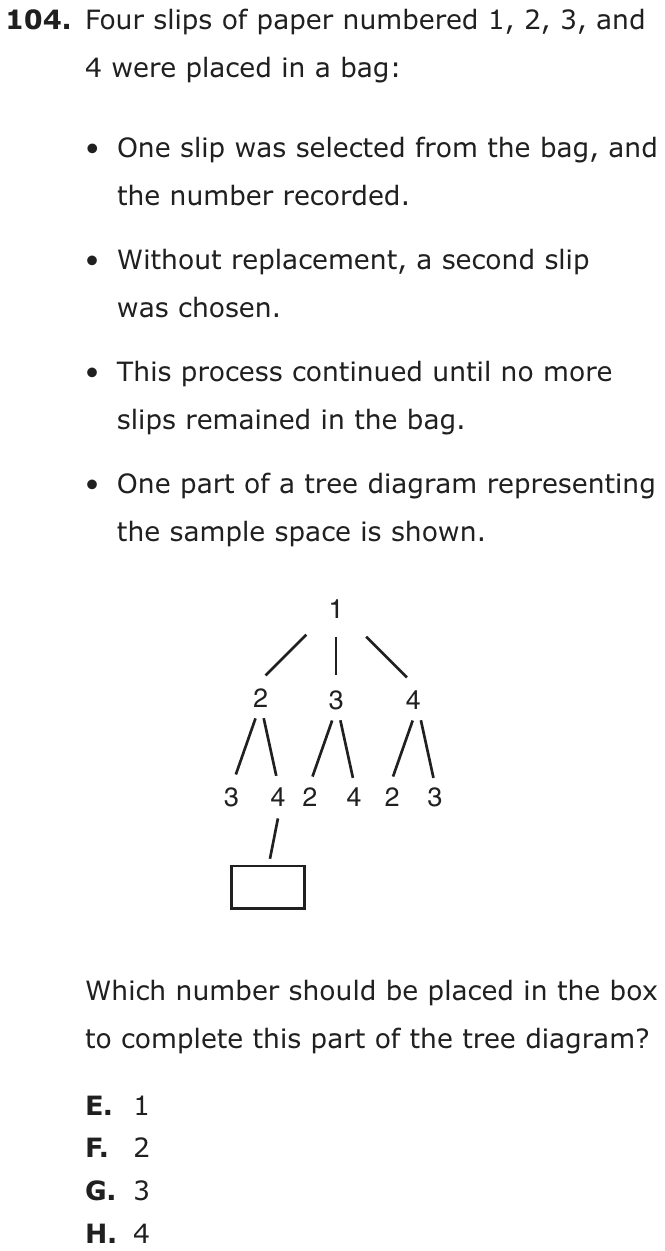
Question 32 of 45
2023 Test B Math, question 50Question
A student made a list of all possible products of 2 different numbers in the set above. What fraction of the products are odd?
- A
- B
- C
- D
Show the answer
Correct answer: B
First, list the products:
Of the 10 products, 3 are odd. The fraction is .
Question analysis
A student lists every product of two different numbers from the set 3, 4, 5, 6, 7. Students find what fraction of those products are odd. It tests listing outcomes systematically without counting a pair twice, and reasoning about odd and even numbers.
- NYS standards
- Grade level
- Grade 7 content, by NYS standard
- Compared with grade 7
- At grade 7 Organized lists of outcomes are grade 7 work. Here students list the products of pairs from five numbers, without repeating a pair or pairing a number with itself, then count the ones that fit.
- Estimated difficulty
- Moderate: several steps, or a close reading with one strong distractor.
- Thinking it demands
- Depth of knowledge 2, skills and concepts · mainly apply
- What makes it hard
- Much to keep track of moderate
- Something you must already know minor
- Solution
- 3 steps
- Reading level
- Question and choices: about grade 6, 28 words.
- Students, last 30 days
- Not enough answers yet to show (it takes 10).
Why it is hard, traps and wrong answers (shows the answer)
Why it is hard
The count of odd products is easy, since only 3, 5 and 7 can make one; the total is where students go wrong. Counting ordered pairs, 5 × 4 = 20, while listing odd products once mixes two kinds of counting. Writing the 10 pairs in order, 3 with each larger number, then 4, and so on, keeps the total honest.
Much to keep track of moderate Working it out
Listing the products of 2 different numbers from five means tracking 10 pairs, with no pair repeated in reverse order and no number paired with itself. (Sweller, 1988; Carpenter, Just & Shell, 1990)
Something you must already know minor Working it out
The shortcut, that a product is odd only when both factors are odd, cuts the work to counting pairs from 3, 5 and 7, but it must be known. (Anderson & Krathwohl, 2001)
Strategy: List each pair of different numbers once, then find each product, or use the fact that a product is odd only when both factors are odd, and count.
Traps
- Overlapping groups: Things in two groups at once are counted twice, or not subtracted.
- Misunderstands the concept: A wrong belief about a concept: that percents can be added, that area grows like length, that averages can be averaged, that a bigger denominator means a bigger fraction.
- Answers a different question: A choice is right for another quantity: the other unknown, the rest instead of the part, the part instead of the whole.
The wrong answers, classified
A Overlapping groups (King et al., 2004)
Counts ordered pairs for the total, 5 × 4 = 20, so each pair appears twice, but counts the odd products once, 3, giving 3/20.
C Misunderstands the concept (Smith, diSessa & Roschelle, 1993; De Bock et al., 1998; Ni & Zhou, 2005)
Assumes about half of all products are odd, as odd and even numbers come equally often, without listing the products or checking any.
D Answers a different question (King et al., 2004; Hegarty, Mayer & Monk, 1995)
Gives the share of the numbers in the set that are odd, 3 of 5, instead of the share of the products, never forming any products.
Worked solution, step by step
Formulas used
- Fraction of a list
- The top counts the products that are odd. The bottom counts all the products in the list. A product is the answer when you multiply. The fraction tells what share of the list is odd.
- Odd times odd
- An odd number can’t be split into pairs, like 3 or 7. An even number can, like 4. A product is odd only when both numbers are odd. If either number is even, the product is even, because it splits into pairs.
Sort out the question
The set has 3, 4, 5, 6 and 7. The student multiplies 2 different numbers, every possible way. A product is the answer to a multiplication. Each pair counts once, since 3 × 4 and 4 × 3 give the same product. You need the fraction of the products that are odd.
List every pair once
Pair 3 with each bigger number. Then pair 4 with each bigger number, and so on. This way no pair is counted twice.
3 × 4 = 12 3 × 5 = 15 3 × 6 = 18 3 × 7 = 21 4 × 5 = 20 4 × 6 = 24 4 × 7 = 28 5 × 6 = 30 5 × 7 = 35 6 × 7 = 42 There are 10 products.
Count the odd products
The odd products are 15, 21 and 35. That makes 3. They come from the only pairs where both numbers are odd: 3 and 5, 3 and 7, and 5 and 7.
Write the fraction
Use the fraction formula.
Watch out: Counting 4 × 3 as well as 3 × 4 makes 20 pairs. Then , choice A, mixes two ways of counting. And , choice D, is the share of the numbers that are odd, not the products.
So the answer is B, .
Check your answer
Count without listing. Each of the 5 numbers can pair with 4 others, which makes 20. But that counts every pair twice, so there are 20 ÷ 2 = 10 pairs. Only the odd numbers 3, 5 and 7 make odd products, and they form 3 pairs.
More questions like this
The original DOE question
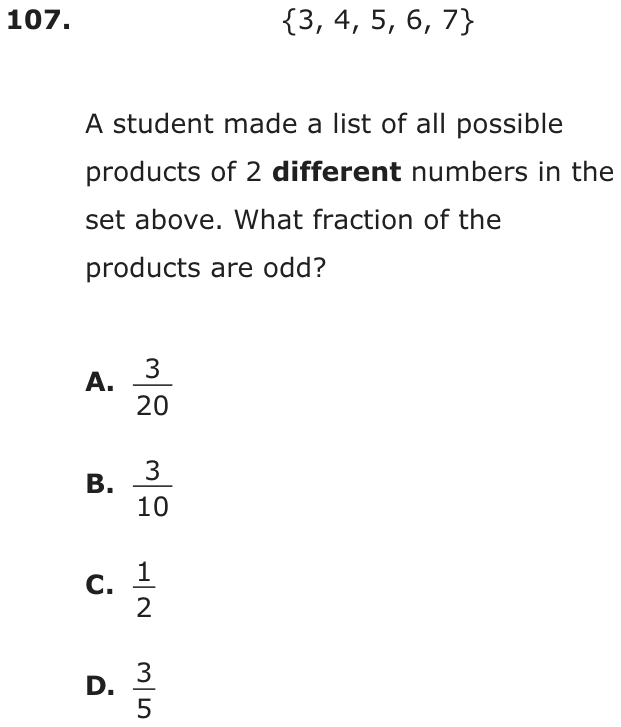
Question 33 of 45
2023 Test B Math, question 53Question
Micha is playing a game with five cards numbered 1 through 5. He will place the cards in a bag and draw one card at random three times, replacing the card each time. To win a prize, he must draw the number 5 all three times. What is the probability he will draw the number 5 all three times?
- A
- B
- C
- D
Show the answer
Correct answer: A
Each time Micha draws a card, the probability of drawing the number 5 is . To find the probability of drawing the number 5 three times, multiply:
Question analysis
Micha draws a card three times from five cards numbered 1 to 5, putting the card back each time, and wins only if he draws a 5 every time. Students find the probability that he wins. It tests the probability of independent events, where the chances for the separate draws have to be combined correctly.
- NYS standards
- Grade level
- Grade 7 content, by NYS standard
- Compared with grade 7
- At grade 7 Finding the probability of a compound event is a grade 7 standard, and repeated draws with replacement are a standard case. Three equal factors make this a short, typical grade 7 task.
- Estimated difficulty
- Straightforward: two steps or one careful reading.
- Thinking it demands
- Depth of knowledge 2, skills and concepts · mainly apply
- What makes it hard
- Solution
- 2 steps
- Reading level
- Question and choices: about grade 3, 59 words.
- Students, last 30 days
- Not enough answers yet to show (it takes 10).
Why it is hard, traps and wrong answers (shows the answer)
Why it is hard
With replacement each draw is the same 1 in 5, so the work is one product, 1/5 × 1/5 × 1/5. The wrong choices mark three ways to mishandle repetition: adding the chances, multiplying 5 by 3 instead of cubing it, and multiplying by 3 for the three draws. A quick sense check helps, since needing three 5s in a row must be far less likely than needing one.
Something you must already know minor Working it out
The rule that the chance of independent events all happening is the product of their chances is assumed, as is that replacing the card keeps each draw at 1/5. (Anderson & Krathwohl, 2001)
Strategy: Find the probability of drawing a 5 on one draw, then, because the card goes back each time, multiply that probability by itself once for each draw.
Traps
- Wrong operation: Adds instead of multiplying, divides the wrong way round, turns a ratio or rate upside down, or undoes a step in the wrong direction (subtracts what should be added back).
- A faulty procedure: A systematic but wrong procedure: adding fractions straight across, applying an exponent to each term of a sum, dropping a sign when moving a term.
- Overlapping groups: Things in two groups at once are counted twice, or not subtracted.
The wrong answers, classified
B Overlapping groups (King et al., 2004)
Finds 1/125 for three 5s, then multiplies by 3 for the three draws, counting the single outcome 5, 5, 5 as if it could happen in three orders.
C A faulty procedure (Brown & Burton, 1978; Tatsuoka, 1983)
Multiplies 5 by 3 instead of raising it to the third power, so the denominator becomes 15 rather than 5 × 5 × 5 = 125.
D Wrong operation (Hegarty, Mayer & Monk, 1995; King et al., 2004)
Adds the three probabilities, 1/5 + 1/5 + 1/5 = 3/5, as if drawing a 5 on any one draw were enough to win.
Worked solution, step by step
Formulas used
- Probability
- P is the probability, the chance something happens. It is a number from 0 to 1. The top counts the results you want. The bottom counts all the results that can happen. It works when every result is equally likely.
- Chance of events in a row
- A, B and C are events, things that might happen, like drawing a 5. When they do not change each other’s chances, the chance that all of them happen is the product of their chances. Putting each card back keeps the draws from changing each other.
Sort out the question
The bag has 5 cards, numbered 1 to 5. Micha draws a card three times. He puts it back each time, so every draw starts with all 5 cards. He wins only if he draws a 5 all three times. You need the probability, or chance, of that.
Find the chance for one draw
One card out of 5 is a 5. Use the probability formula.
Each draw has a 1 in 5 chance of being a 5.
Multiply for three draws
He needs a 5 on the first draw, and the second, and the third. The card goes back each time, so the draws don’t change each other. Use the rule for events in a row.
Give the answer
Watch out: Adding the chances gives , choice D. That would make winning likely, which makes no sense. Multiplying 5 × 3 instead of 5 × 5 × 5 gives , choice C.
So the answer is A, .
Check your answer
Count all the results. Each draw has 5 possible cards, so three draws have 5 × 5 × 5 = 125 possible orders. Only one of them is 5, 5, 5. That gives 1 out of 125. Needing three 5s should also be much less likely than needing one.
More questions like this
The original DOE question
Question 34 of 45
2022 Test A Math, question 43Question
A bag contains 15 marbles: 11 blue marbles and 4 red marbles. Sarah picks one marble randomly, returns it to the bag, and then randomly picks one marble again. What is the probability that she picks a red marble both times?
- A
- B
- C
- D
Show the answer
Correct answer: A
The probability of drawing a red marble at random from a bag of 15 marbles (11 blue and 4 red) is shown:
When the red marble is replaced in the bag, the probability of picking a red marble is unchanged, .
The two events are independent, so the multiplication rule of probability applies.
Question analysis
A bag holds 11 blue and 4 red marbles. Sarah picks one at random, puts it back, and picks again, and students find the probability that she picks red both times. It tests the probability of a compound event made of two independent picks; the bold word both and the replacement shape the calculation.
- Grade level
- Grade 7 content, by NYS standard
- Compared with grade 7
- At grade 7 Finding the probability of two independent picks is grade 7 compound-event work. Because the marble is put back, the two picks are alike, and the numbers are small, which makes this a typical grade 7 probability task.
- Estimated difficulty
- Straightforward: two steps or one careful reading.
- Thinking it demands
- Depth of knowledge 2, skills and concepts · mainly apply
- What makes it hard
- Something you must already know moderate
- Turning words into math minor
- Solution
- 2 steps
- Reading level
- Question and choices: about grade 6, 42 words.
- Students, last 30 days
- Not enough answers yet to show (it takes 10).
Why it is hard, traps and wrong answers (shows the answer)
Why it is hard
The arithmetic is two small fractions multiplied, so the question rests on knowing which rule applies. Adding the two chances gives more than either chance alone, which cannot be right for two reds in a row, and comparing red with blue instead of with all 15 marbles changes every denominator. A sense check helps: two reds in a row must be less likely than a single red, 4/15.
Something you must already know moderate Working it out
The multiplication rule for independent events is not given: because the marble goes back, each pick is 4 out of 15, and red both times means 4/15 × 4/15. (Anderson & Krathwohl, 2001)
Turning words into math minor Understanding the question
Two phrases carry the method: “returns it to the bag” keeps the second pick at 4 out of 15, and “red marble both times” asks for both events, not either. (Hegarty, Mayer & Monk, 1995; Koedinger & Nathan, 2004)
Strategy: Find the chance of red on a single pick out of all the marbles. Since the marble goes back, the second pick has the same chance; then use the rule for two independent events both happening.
Traps
- Wrong operation: Adds instead of multiplying, divides the wrong way round, turns a ratio or rate upside down, or undoes a step in the wrong direction (subtracts what should be added back).
- Misunderstands the concept: A wrong belief about a concept: that percents can be added, that area grows like length, that averages can be averaged, that a bigger denominator means a bigger fraction.
- Answers a different question: A choice is right for another quantity: the other unknown, the rest instead of the part, the part instead of the whole.
The wrong answers, classified
B Misunderstands the concept (Smith, diSessa & Roschelle, 1993; De Bock et al., 1998; Ni & Zhou, 2005)
Uses red to blue, 4 to 11, as the chance of red instead of 4 out of all 15 marbles, then squares it, a part-to-part ratio.
C Wrong operation (Hegarty, Mayer & Monk, 1995; King et al., 2004)
Adds the two chances, 4/15 + 4/15 = 8/15, instead of multiplying, as if a red marble on either pick were enough.
D Answers a different question (King et al., 2004; Hegarty, Mayer & Monk, 1995)
Finds the chance of blue both times, (11/15)² = 121/225, answering for the wrong color with the right method.
Worked solution, step by step
Formulas used
- Probability of an event
- P is the probability, the chance that something happens, from 0 (never) to 1 (always). An outcome is one possible result, here one marble. Divide the number of results you want by the number of all results.
- Two independent events both happening
- A and B are two events. Independent means one does not change the chance of the other. P(A) is the chance of A, and P(B) is the chance of B. Multiply them to get the chance that both happen.
Sort out the question
The bag has 15 marbles: 11 blue and 4 red. Sarah picks one, puts it back, then picks again. You need the probability, or chance, that both picks are red. Putting the marble back matters. The bag is the same for the second pick.
Find the chance of red on one pick
There are 4 red marbles out of 15 in all. Watch out: compare red with all 15 marbles, not with the 11 blue ones. Using 4 out of 11 leads to , choice B.
See that the picks are independent
Sarah puts the marble back. So the bag again has 4 red marbles out of 15. The second pick has the same chance, 4/15. The first pick does not change the second one. That makes the two picks independent.
Multiply the two chances
To multiply fractions, multiply the tops and multiply the bottoms. Watch out: don’t add. , choice C, is a bigger chance than one red. And , choice D, is the chance of blue both times. So the answer is A, .
Check your answer
Two reds in a row should be less likely than one red. One red is , about 0.27. is about 0.07, much smaller. That makes sense. Adding gave , about 0.53, which is too big.
More questions like this
The original DOE question
Question 35 of 45
2022 Test A Math, question 44Question
| Report | Subject | Topic Choices |
|---|---|---|
| #1 | Geography | Kenya, Thailand, Chile, Greece, New Zealand |
| #2 | English | R. Frost, L. Hughes, N. Giovanni |
| #3 | Science | 1997 Mars mission |
| #4 | Math | π, regular polyhedrons |
Anita is assigned to report on 1 topic in each of the 4 subjects shown in the table above. How many different sets of 4 reports are possible, according to the choices available to her?
- A10
- B24
- C30
- D44
Show the answer
Correct answer: C
One report is assigned for each of 4 subjects, and each subject has a specified number of topic choices:
- 5 choices for Geography
- 3 choices for English
- 1 choice for Science
- 2 choices for Math
The basic counting principle (product rule) applies since the number of choices for each subject is independent of the choices for the other subjects. The number of different sets of 4 reports possible is the product.
Question analysis
A table lists the topics Anita may choose from for reports in geography, English, science and math. She reports on one topic in each subject, and students count how many different sets of four reports are possible. It tests the counting principle; reading how many topics each row offers, including a row with only one, comes first.
- NYS standards
- 7.SP.8b sample spaces for compound events
- Grade level
- Grade 7 content, by NYS standard
- Compared with grade 7
- At grade 7 Counting the outcomes of several independent choices is grade 7 work, usually done with a tree diagram or a list. Four subjects make a full tree impractical, so a counting shortcut is needed, but each count is small and read from the table.
- Estimated difficulty
- Straightforward: two steps or one careful reading.
- Thinking it demands
- Depth of knowledge 2, skills and concepts · mainly apply
- What makes it hard
- Solution
- 2 steps
- Reading level
- Question and choices: about grade 7, 52 words.
- Students, last 30 days
- Not enough answers yet to show (it takes 10).
Why it is hard, traps and wrong answers (shows the answer)
Why it is hard
Once the four counts are read from the table, the question is a single product, so the real test is recognizing that independent choices multiply. Students who add the counts get 11, which is not offered, a useful signal that the method is wrong. Science's single topic multiplies by 1 and changes nothing, but it still has to be read as one choice, not as none.
Something you must already know moderate Working it out
The counting principle is not stated: choosing one topic from each subject means multiplying the numbers of choices, 5 × 3 × 1 × 2, not adding them. (Anderson & Krathwohl, 2001)
Reading a figure, table or graph minor Understanding the question
The topic lists must be counted by their commas, and two rows mislead: Science offers a single topic, and Math's “π, regular polyhedrons” is two topics, not one. (Lesh, Post & Behr, 1987; Kirsch & Mosenthal, 1990)
Strategy: Count the topic choices in each row of the table, reading the commas carefully, then apply the counting principle, since Anita picks one topic from every subject.
Traps
- Wrong operation: Adds instead of multiplying, divides the wrong way round, turns a ratio or rate upside down, or undoes a step in the wrong direction (subtracts what should be added back).
- Misunderstands the concept: A wrong belief about a concept: that percents can be added, that area grows like length, that averages can be averaged, that a bigger denominator means a bigger fraction.
- Numbers taken from the question: Combines the numbers in the question without a model of the situation, or is simply a number that appears in the question.
The wrong answers, classified
A Wrong operation (Hegarty, Mayer & Monk, 1995; King et al., 2004)
Adds the topic counts instead of multiplying and leaves out Science's single topic as no real choice, 5 + 3 + 2 = 10.
B Misunderstands the concept (Smith, diSessa & Roschelle, 1993; De Bock et al., 1998; Ni & Zhou, 2005)
Counts the orders in which four reports could be written, 4 × 3 × 2 × 1 = 24, instead of the ways to choose one topic per subject.
D Numbers taken from the question (Hegarty, Mayer & Monk, 1995)
Multiplies the 4 subjects by the 11 topics listed in all, 4 × 11 = 44, combining numbers without a model of the choices.
Worked solution, step by step
Formulas used
- Counting principle
- a, b, c and d are the numbers of choices for each separate pick. When you make one pick from each group, and the groups don’t affect each other, multiply the numbers of choices. Each choice in one group can go with every choice in the others.
Sort out the question
Anita writes 4 reports, one for each subject. For each subject she picks 1 topic from that row of the table. A set of 4 reports is one full pick: one topic for each subject. You need how many different sets are possible.
Count the topics in each row
Use the commas to count the topics.
- Geography: Kenya, Thailand, Chile, Greece, New Zealand. That is 5.
- English: Frost, Hughes, Giovanni. That is 3.
- Science: only the 1997 Mars mission. That is 1.
- Math: π and regular polyhedrons. That is 2.
New Zealand is two words but one country, so it is one topic.
Multiply the choices
Use the counting principle. Each of the 5 geography topics can go with each of the 3 English topics, and so on.
Science has just one topic, so every set has it. Multiplying by 1 changes nothing. Watch out: don’t add the counts. Adding them without Science, , gives choice A.
Rule out the other choices
counts the orders for writing 4 reports. The question does not ask about order, so 24, choice B, is wrong. multiplies the subjects by all the topics. That is choice D, and it has no meaning here. So the answer is C, 30.
Check your answer
Build it up. Geography and English alone give pairs, such as Kenya with Frost. Science adds only one topic, so there are still 15. Math doubles it, π or polyhedrons, so sets.
More questions like this
The original DOE question
Question 36 of 45
2022 Test B Math, question 42Question
At any given time, one person out of every 20 people has the common cold. Assume that the common cold can be caused by any one of 200 different viruses, each of which is equally likely to cause the cold. One of these 200 viruses is cold virus V144. What is the probability that a randomly selected person is suffering from a cold caused by virus V144?
- A
- B
- C
- D
Show the answer
Correct answer: D
To calculate the joint probability, you must first determine the probability of each independent event. The probability that a randomly selected person has a common cold is . The probability that a cold is caused by V144 is . The probability that a person has a cold and the cold is caused by the V144 virus is the product of those two probabilities, .
Question analysis
One person in 20 has a common cold at any given time, and each cold comes from one of 200 equally likely viruses. Students find the probability that a randomly selected person has a cold caused by one particular virus, V144. It tests the probability of a compound event, which is hidden here inside a single phrase.
- Grade level
- Grade 7 content, by NYS standard
- Compared with grade 7
- At grade 7 Grade 7 students find compound probabilities, usually from organized lists or tree diagrams. Here the two stages are hidden in one phrase, a cold caused by one particular virus, and there are far too many outcomes to list.
- Estimated difficulty
- Moderate: several steps, or a close reading with one strong distractor.
- Thinking it demands
- Depth of knowledge 2, skills and concepts · mainly apply
- What makes it hard
- Turning words into math moderate
- Something you must already know moderate
- Solution
- 2 steps
- Reading level
- Question and choices: about grade 6, 68 words.
- Corrected from the DOE handbook
- A probability in the explanation that was stated for the wrong event was corrected.
- Students, last 30 days
- Not enough answers yet to show (it takes 10).
Why it is hard, traps and wrong answers (shows the answer)
Why it is hard
The arithmetic is one multiplication; the difficulty is seeing that the event has two stages. Each stated chance, 1 in 20 for a cold and 1 in 200 for the virus behind it, is listed as a choice on its own, and each answers only half the question. A chance that both stages happen must be smaller than either one alone, which leaves a single choice.
Turning words into math moderate Understanding the question
The single phrase “a cold caused by virus V144” holds two events, having a cold at all and that cold coming from V144, and they must be separated before any rule applies. (Hegarty, Mayer & Monk, 1995; Koedinger & Nathan, 2004)
Something you must already know moderate Working it out
The stem never says that the chance of both stages is the product of their chances, so students must bring that rule to the 1 in 20 and the 1 in 200 themselves. (Anderson & Krathwohl, 2001)
Strategy: Split the event into two stages, having a cold and that cold coming from V144, write each stage's chance as a fraction, and combine them with the rule for events that must both happen.
Traps
- Stops one step early: A choice is a number from partway through the solution.
- Wrong operation: Adds instead of multiplying, divides the wrong way round, turns a ratio or rate upside down, or undoes a step in the wrong direction (subtracts what should be added back).
The wrong answers, classified
A Wrong operation (Hegarty, Mayer & Monk, 1995; King et al., 2004)
Divides one chance by the other, 1/200 ÷ 1/20 = 20/200 = 1/10, instead of multiplying them, giving a chance larger than either stage.
B Stops one step early (King et al., 2004; Gierl et al., 2017)
Gives the chance that a person has a cold of any kind, 1 in 20, and stops before multiplying by the 1/200 chance that V144 caused it.
C Stops one step early (King et al., 2004; Gierl et al., 2017)
Gives the chance that a cold is caused by V144, one virus out of 200, forgetting that only 1 person in 20 has a cold at all.
What was corrected from the DOE handbook, and why
- Explanation: The handbook says “The probability that a person has a cold caused by V144 is 1/200.” A person having a cold caused by V144 is exactly what the question asks about, and the same paragraph goes on to give its probability as 1/4,000; as printed, the sentence gives that event the value of choice C. The 1/200 is the probability that a cold is caused by V144 (one of 200 equally likely viruses), so the site reads “The probability that a cold is caused by V144 is 1/200.” The working and the answer are unchanged: 1/20 × 1/200 = 1/4,000.
Worked solution, step by step
Formulas used
- Probability of one outcome
- P is the probability, the chance that something happens, from 0 to 1. The top counts the outcomes you want. The bottom counts all the outcomes that could happen. Use it when every outcome is equally likely, like one virus out of 200.
- Chance that two events both happen
- A is the first event and B is the second. P(A) is the chance of A. P(B given A) is the chance of B among the times A has happened. Multiply them to get the chance that both happen. The result is smaller than either chance, since both things must happen.
Sort out the question
One person in 20 has a cold. Every cold comes from one of 200 viruses, all equally likely. V144 is one of them. You need the chance that a random person has a cold caused by V144.
That phrase holds two events. First, the person has a cold. Second, that cold comes from V144.
Find the chance of a cold
The question says “one person out of every 20 people has the common cold.” So 1 person is the part with a cold, and 20 is the whole group.
Find the chance it is V144
Now think only about people who have a cold. Each cold comes from one of 200 viruses, all equally likely. V144 is 1 of the 200.
This chance is only about people who already have a cold. So the second event depends on the first.
Multiply the two chances
Use the rule for two events that must both happen. Event A is a cold, and event B is V144 as its cause.
Multiply the tops: 1 × 1 = 1. Multiply the bottoms: 20 × 200 = 4,000.
Give the answer
Watch out: 1/20 is the chance of any cold, choice B. And 1/200 is the chance that a cold comes from V144, choice C. Each one answers only half the question. Dividing one by the other gives 1/10, choice A. So the answer is D, .
Check your answer
Picture 4,000 people. One in 20 has a cold, so people have colds. Of those 200 colds, 1 in 200 comes from V144. That is 1 person out of 4,000. It is also smaller than both 1/20 and 1/200, as it should be.
More questions like this
The original DOE question
Question 37 of 45
2018 Test A Math, question 4Question
A survey asked students what pets they have. Based on the results, the following statements are all true.
- 20 students have cats.
- 23 students have dogs.
- 3 students have both dogs and cats.
- 5 students have no dogs or cats.
How many students were surveyed?
Grid-in question: work out the answer and enter it as a number.
Show the answer
Correct answer: 45
Let x = number of students with only cats as pets.
Let y = number of students with only dogs as pets.
Calculate x and y using the given information:
There are 20 students who have cats, and of those 20 students, 3 have both cats and dogs.
Thus,
There are 23 students who have dogs, and of those 23 students, 3 have both cats and dogs.
Thus,
To find the total number of students surveyed, add the number of students who only have cats (x), the number of students who only have dogs (y), the number of students who have both (3), and the number of students who have neither (5):
Question analysis
A grid-in counting question about a survey of students' pets: some have cats, some dogs, some both, and some neither. Students find how many were surveyed by sorting everyone into groups without counting anyone twice. The students who own both pets are the trap in this classic Venn diagram problem.
- NYS standards
- 7.SP.8b sample spaces for compound events
- Grade level
- Grade 7 content, by NYS standard
- Compared with grade 7
- At grade 7 Grade 7 classes organize outcomes in lists and tables, but overlapping groups like these are rarely taught directly. The arithmetic is simple whole-number addition and subtraction; the demand lies in spotting the double count.
- Estimated difficulty
- Moderate: several steps, or a close reading with one strong distractor.
- Thinking it demands
- Depth of knowledge 2, skills and concepts · mainly apply
- What makes it hard
- Turning words into math moderate
- Much to keep track of minor
- An answer in an unexpected form minor
- Solution
- 3 steps
- Reading level
- Question and choices: about grade 3, 41 words.
- Students, last 30 days
- Not enough answers yet to show (it takes 10).
Why it is hard, traps and wrong answers (shows the answer)
Why it is hard
The arithmetic is small; the trap is in the wording. Because each bullet reads like a separate group, students tend to add the numbers as listed and count the students with both pets twice. A Venn diagram with the overlap filled in first solves the problem, and the remaining risk is forgetting that students with no pets were surveyed too.
Turning words into math moderate Understanding the question
The statement "20 students have cats" already includes the 3 who have both pets, and so does "23 students have dogs", which the separate bulleted list hides. (Hegarty, Mayer & Monk, 1995; Koedinger & Nathan, 2004)
Much to keep track of minor Working it out
Four facts, two overlapping groups, their overlap and an outside group of 5 with neither pet, all have to be placed before anything is added. (Sweller, 1988; Carpenter, Just & Shell, 1990)
An answer in an unexpected form minor Choosing the answer
As a grid-in it gives no choices, so a total that counts the 3 twice or leaves out the 5 looks just as finished as the right one. (Enright, Morley & Sheehan, 2002)
Strategy: Draw two overlapping circles: put the both-pets group in the middle, subtract it from each pet total to fill the outer parts, then add every region and the students with neither.
Traps
- Overlapping groups: Things in two groups at once are counted twice, or not subtracted.
The wrong answers, classified
48 Overlapping groups (King et al., 2004)
Adds 20 + 23 + 5 = 48, counting the 3 students with both pets once among the cat owners and again among the dog owners.
40 Answers a different question (King et al., 2004; Hegarty, Mayer & Monk, 1995)
Removes the overlap correctly, 20 + 23 − 3 = 40, but counts only the pet owners, leaving out the 5 surveyed students with no dogs or cats.
51 Numbers taken from the question (Hegarty, Mayer & Monk, 1995)
Adds all four numbers in the list, 20 + 23 + 3 + 5 = 51, treating the both-pets group as an extra group of students.
Worked solution, step by step
Formulas used
- Counting two groups that overlap
- T is the total number of students. C is the number with cats, and D is the number with dogs. B is the number with both pets, and N is the number with neither. Students with both are counted in C and again in D, so you subtract B once. Then add N.
Sort out the four facts
You need the number of students who were surveyed. Here is what you know:
- 20 students have cats.
- 23 students have dogs.
- 3 students have both dogs and cats.
- 5 students have no dogs or cats.
The tricky part: the 3 students with both pets are already inside the 20 and inside the 23.
Split the pet owners into groups
Picture two circles that overlap, one for cats and one for dogs. The overlap holds the 3 students with both pets. Take them out of each pet total to find who has only one kind of pet.
So 17 students have only cats.
So 20 students have only dogs.
Add every group once
Now every student is in exactly one group.
Group Students Only cats 17 Only dogs 20 Both pets 3 Neither pet 5 The formula gives the same total.
Avoid the traps and answer
Watch out: adding counts the 3 students with both pets twice. That gives 48. Watch out: the 5 students with no pets were surveyed too. Leaving them out gives 40. Adding all four numbers in the list gives 51, which is also wrong. So you would grid 45.
Check your answer
Check each fact against your groups. Cat owners: . Dog owners: . Both: 3. Neither: 5. Every fact matches, so 45 students were surveyed.
More questions like this
The original DOE question
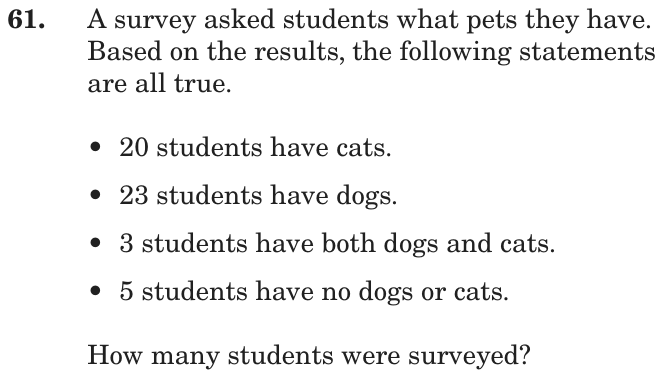
Question 38 of 45
2018 Test A Math, question 19Question
In Centerville, 45% of the population is female, and 60% of the population commutes to work daily. Of the total Centerville population, 21% are females who commute to work daily. What percentage of the total Centerville population are males who do not commute to work daily?
- A15%
- B16%
- C24%
- D39%
Show the answer
Correct answer: B
Create a table with the information provided in the problem and use subtraction to fill in the rest of the table:
| Female | Male | TOTAL | |
| Commutes to work | 21% | 39% (60 − 21) |
60% |
| Does not commute to work | 24% (45 − 21) |
16% (40 − 24) |
40% (100 − 60) |
| TOTAL | 45% | 100% |
16% of the population is male and does not commute to work.
Question analysis
A percent problem about overlapping groups in a town's population: the percents who are female, who commute daily, and who are female commuters are given. Students find the percent who are male and do not commute. A two-way table helps, since several of its cells are easy to confuse with the one asked for.
- Grade level
- Grade 7 content, by NYS standard
- Compared with grade 7
- Above grade 7 Grade 7 percent problems usually take a percent of one quantity. This needs two overlapping categories organized in a two-way table, which is not in New York's grade 7 standards, with three subtractions and two tempting cells.
- Estimated difficulty
- Hard: combines ideas, needs a plan, and has more than one tempting wrong answer.
- Thinking it demands
- Depth of knowledge 2, skills and concepts · mainly analyze
- What makes it hard
- No obvious method moderate
- Much to keep track of moderate
- Turning words into math moderate
- Solution
- 3 steps
- Reading level
- Question and choices: about grade 12, 43 words.
- Students, last 30 days
- Not enough answers yet to show (it takes 10).
Why it is hard, traps and wrong answers (shows the answer)
Why it is hard
The question gives three overlapping percents and asks for the one group none of them describes directly. Without a table, students tend to subtract the given numbers in some order, and several orders yield a listed choice. The last trap is the word "not", since the males who do commute are one cell away. Filling every cell of a two-by-two table before answering takes under a minute and leaves nothing to guess.
No obvious method moderate Working it out
Nothing in the wording points to a two-way table, yet the four groups, female or male by commuting or not, fall into place only once one is drawn. (Schoenfeld, 1985)
Much to keep track of moderate Working it out
Three given percents, 45, 60 and 21, plus their complements, 55 and 40, have to be kept straight while the cells are filled in by subtraction. (Sweller, 1988; Carpenter, Just & Shell, 1990)
Turning words into math moderate Understanding the question
"Of the total Centerville population, 21% are females who commute" is a share of everyone, not of the females, and belongs in a single cell of the table. (Hegarty, Mayer & Monk, 1995; Koedinger & Nathan, 2004)
Strategy: Make a two-by-two table of female and male against commutes and does not commute, fill in the totals, and complete each cell by subtraction.
Traps
- Misreads the question: Misses or misreads a condition or a word in the question: "at least", "each", "remaining", "not".
- Stops one step early: A choice is a number from partway through the solution.
The wrong answers, classified
A Numbers taken from the question (Hegarty, Mayer & Monk, 1995)
Subtracts one given percent from another, 60 − 45 = 15, without placing the 21% of female commuters anywhere.
C Stops one step early (King et al., 2004; Gierl et al., 2017)
Fills in the first empty cell, females who do not commute, 45 − 21 = 24, and stops before using it to reach the males' cell.
D Misreads the question (Hegarty, Mayer & Monk, 1995)
Finds the males who commute, 60 − 21 = 39, missing the word not in the question.
Worked solution, step by step
Formulas used
- Parts add up to the whole
- In a two-way table, every row and every column splits a group into two parts. a and b are the two parts, and W is the whole group. If you know the whole and one part, subtract to find the other part.
Sort out the question
Every number is a percent of the whole town. 45% of people are female. 60% commute, which means they travel to work every day. 21% are females who commute. You need the percent who are “males who do not commute to work daily”.
Make a two-way table
A two-way table sorts people two ways at once: female or male, and commutes or not. Put in what you know. The whole town is 100%.
Female Male Total Commute 21% ? 60% Do not commute ? ? ? Total 45% ? 100% Fill in the two totals
Everyone is female or male, so the males are what is left.
Everyone either commutes or does not.
So 55% are male, and 40% do not commute.
Find the males who commute
Use the commute row. All commuters are 60%, and the female commuters are 21%.
So 39% are males who commute. Watch out: the question says do not commute. Picking 39% is choice D.
Find the males who do not commute
Use the male column. All males are 55%, and the males who commute are 39%.
Watch out: 24% is the females who do not commute, . That is choice C. So the answer is B, 16%.
Check your answer
Find the same cell another way. Females who do not commute: . All who do not commute: 40%. So males who do not commute: . The answers match.
More questions like this
The original DOE question
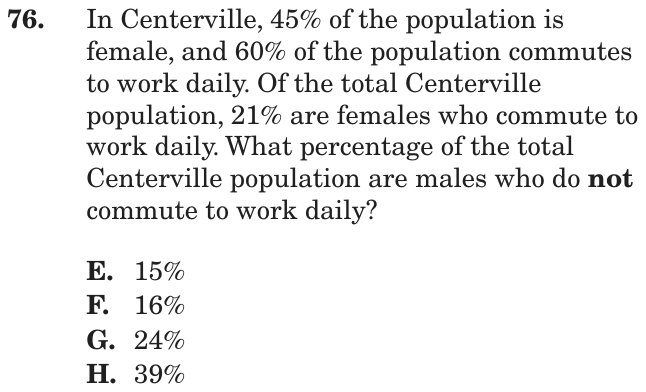
Question 39 of 45
2018 Test A Math, question 21Question
In a sample of 10 cards, 4 are red and 6 are blue. If 2 cards are selected at random from the sample, one at a time without replacement, what is the probability that both cards are not blue?
- A
- B
- C
- D
Show the answer
Correct answer: A
The probability that both cards are not blue is the same as the probability that both cards are red. There are 4 red cards out of the 10, so the probability of the first card being red is
Now there are 9 cards left, and 3 of those are red, so the probability of the second card being red is
Multiply the two probabilities to find the probability that both cards are red (not blue):
Question analysis
This probability question draws 2 cards, one at a time and without replacement, from 10 cards: 4 red and 6 blue. Students find the chance that neither card drawn is blue. The second draw has one fewer card, and the word not changes which color to count.
- NYS standards
- Grade level
- Grade 7 content, by NYS standard
- Compared with grade 7
- Above grade 7 Grade 7 compound probability is usually found with a list or tree of equally likely outcomes. Dependent draws without replacement, plus a negative phrasing to translate, go beyond that typical work.
- Estimated difficulty
- Hard: combines ideas, needs a plan, and has more than one tempting wrong answer.
- Thinking it demands
- Depth of knowledge 2, skills and concepts · mainly apply
- What makes it hard
- Something you must already know moderate
- A very close wrong answer moderate
- Turning words into math minor
- An answer in an unexpected form minor
- Solution
- 3 steps
- Reading level
- Question and choices: about grade 5, 39 words.
- Students, last 30 days
- Not enough answers yet to show (it takes 10).
Why it is hard, traps and wrong answers (shows the answer)
Why it is hard
Two ideas stack here: restating not blue as red, and changing the second draw's numbers after a card is removed. Students who know to multiply but forget the removal reach a listed choice, and so do students who compute both blue. Writing the second fraction explicitly as 3 red out of 9 cards, before multiplying, is what separates right from nearly right.
Something you must already know moderate Working it out
Multiplying the first draw's chance by the second draw's, with the second adjusted for the card already taken, is a rule the test assumes and does not give. (Anderson & Krathwohl, 2001)
A very close wrong answer moderate Choosing the answer
2/15 and 4/25 are about 0.13 and 0.16, too close to tell apart by estimate; only the second draw's fraction, 3 red of 9 cards rather than 4 of 10, separates them. (Embretson & Wetzel, 1987; Gorin & Embretson, 2006; Ascalon et al., 2007)
Turning words into math minor Understanding the question
"Both cards are not blue" has to be restated as both cards red, and the bold not also invites computing the chance that both are blue. (Hegarty, Mayer & Monk, 1995; Koedinger & Nathan, 2004)
An answer in an unexpected form minor Choosing the answer
The product comes out as 12/90, and it has to be reduced to lowest terms before it matches any of the listed fractions. (Enright, Morley & Sheehan, 2002)
Strategy: Restate not blue as red, then multiply the chance of red on the first draw by the chance of red on the second, with one card fewer.
Traps
- Without replacement: In a second pick there is one fewer item, which changes the probability.
- Misreads the question: Misses or misreads a condition or a word in the question: "at least", "each", "remaining", "not".
The wrong answers, classified
B Without replacement (Fischbein & Schnarch, 1997)
Multiplies 4/10 × 4/10 = 16/100 = 4/25, as if the first red card were put back before the second draw.
C Little reason to choose it (Haladyna & Downing, 1993; Rodriguez, 2005)
No standard working gives 3/10: it is not the chance of red or of blue on one draw or on two, so it mostly catches guesses.
D Misreads the question (Hegarty, Mayer & Monk, 1995)
Computes the chance that both cards are blue, 6/10 × 5/9 = 30/90 = 1/3, missing the bold word not.
Worked solution, step by step
Formulas used
- Probability
- P is the probability, the chance that something happens. Favorable is the number of ways to get what you want, here a red card. Total is the number of all possible picks, here all the cards you can pick from. It works when every pick is equally likely.
- Two events in a row
- A is the first event and B is the second. P( ) means the probability of what is inside. The chance that both happen is the first chance times the second. For the second chance, count only what is left after the first event.
Sort out the question
There are 10 cards: 4 red and 6 blue. You pick 2 cards “one at a time without replacement”. That means the first card is not put back. “Both cards are not blue” means both are red, since red is the only other color. You need the probability, or chance, of that.
Find the chance the first card is red
4 of the 10 cards are red. Each card is equally likely to be picked. Use the probability formula.
Find the chance the second card is red
One red card is gone now, and it is not put back. So 9 cards are left, and 3 of them are red.
Watch out: using 4/10 again acts as if the card went back. That gives 4/25, choice B.
Multiply the two chances
Both cards must be red. So multiply the first chance by the second. To multiply fractions, multiply the tops, then multiply the bottoms.
Simplify the fraction
None of the choices is 12/90, so simplify it. Divide the top and the bottom by 6, the biggest number that goes into both.
Watch out: the chance that both are blue is , choice D. The question says not blue. So the answer is A, .
Check your answer
Count the ways. There are ways to pick two cards in order. Red then red has ways. That gives 12/90, or 2/15. The answer is small, which makes sense, because there are fewer red cards than blue ones.
More questions like this
The original DOE question
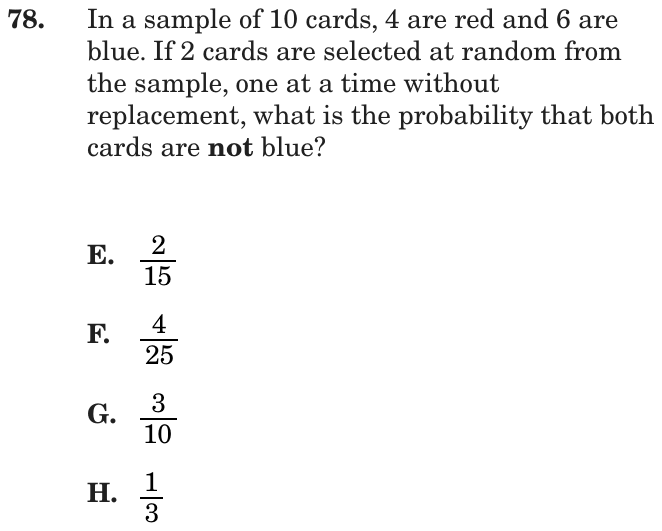
Question 40 of 45
2018 Test A Math, question 34Question
There are 6 different cookies on a plate. Aiden will choose 2 of these cookies to pack in his lunch. How many different pairs of 2 cookies can he choose from the 6?
- A12
- B15
- C30
- D36
Show the answer
Correct answer: B
Create a list of the possible pairs. Let the cookies be named A, B, C, D, E, and F.
AB, AC, AD, AE, AF
BC, BD, BE, BF
CD, CE, CF
DE, DF
EF
There are a total of 15 possible pairs of cookies that Aiden can choose.
Question analysis
This counting question asks how many different pairs of cookies Aiden can choose from six different cookies on a plate. Students must count combinations, where taking the same two cookies in a different order is not a new pair. The challenge is that the order of picking does not matter, so each pair must be counted once.
- NYS standards
- 7.SP.8b sample spaces for compound events
- Grade level
- Grade 7 content, by NYS standard
- Compared with grade 7
- At grade 7 Grade 7 students list the outcomes of compound events with organized lists and tree diagrams. Counting pairs is close to that work, but students must notice that the order of choosing does not matter.
- Estimated difficulty
- Moderate: several steps, or a close reading with one strong distractor.
- Thinking it demands
- Depth of knowledge 2, skills and concepts · mainly apply
- What makes it hard
- Much to keep track of moderate
- Solution
- 2 steps
- Reading level
- Question and choices: about grade 4, 29 words.
- Students, last 30 days
- Not enough answers yet to show (it takes 10).
Why it is hard, traps and wrong answers (shows the answer)
Why it is hard
Students who know the multiplication principle are the most at risk, because it counts each pair twice. The question rewards noticing that a pair has no order, either by listing systematically or by halving 6 × 5. The list of 15 pairs takes under a minute, so there is no time pressure to justify a shortcut.
Much to keep track of moderate Working it out
Listing all pairs by hand means tracking which have been written so none is repeated or skipped, which an organized list such as AB to AF handles. (Sweller, 1988; Carpenter, Just & Shell, 1990)
Strategy: Name the cookies with letters and list the pairs systematically: the first cookie with every later one, then the second with every later one, and so on.
Traps
- Overlapping groups: Things in two groups at once are counted twice, or not subtracted.
- Without replacement: In a second pick there is one fewer item, which changes the probability.
The wrong answers, classified
A Numbers taken from the question (Hegarty, Mayer & Monk, 1995)
Multiplies the 6 cookies by the 2 being chosen, a product of the stem's numbers that does not count any pairs.
C Overlapping groups (King et al., 2004)
Counts ordered picks, 6 choices then 5, so every pair such as AB and BA is counted twice, giving 30 instead of half that.
D Without replacement (Fischbein & Schnarch, 1997)
Uses 6 × 6, as if the first cookie went back on the plate, which counts order and also allows the same cookie twice.
Worked solution, step by step
Formulas used
- Number of pairs
- n is how many things you choose from. Each of the n things can pair with the n − 1 others. That counts every pair twice, once from each side, so you divide by 2.
Sort out the question
There are 6 different cookies. Aiden picks 2 of them. A pair is just two cookies together.
Order does not matter. Picking cookie 1 then cookie 2 gives the same pair as cookie 2 then cookie 1. You need to count the different pairs.
List the pairs in order
Number the cookies 1 to 6. Pair cookie 1 with every cookie after it. Then pair cookie 2 with every cookie after it, and so on. Only pairing with later numbers stops you from listing a pair twice.
Start with Pairs How many 1 1-2, 1-3, 1-4, 1-5, 1-6 5 2 2-3, 2-4, 2-5, 2-6 4 3 3-4, 3-5, 3-6 3 4 4-5, 4-6 2 5 5-6 1 Add up the pairs
Each row has one fewer pair than the row above it. That is because one fewer cookie comes after it. Add the last column of the table:
There are 15 different pairs.
Check with the pairs formula
Put n = 6 into the formula:
Watch out: 6 × 5 = 30 counts each pair twice, once for each order. Stopping there gives choice C. And 6 × 6 = 36, choice D, lets Aiden pick the same cookie twice. So the answer is B, 15.
Check your answer
Think of handshakes. Each of 6 people shakes hands with the 5 others. That looks like 30 handshakes, but each handshake has two people in it, so it was counted twice. 30 ÷ 2 = 15, which matches the list.
More questions like this
The original DOE question
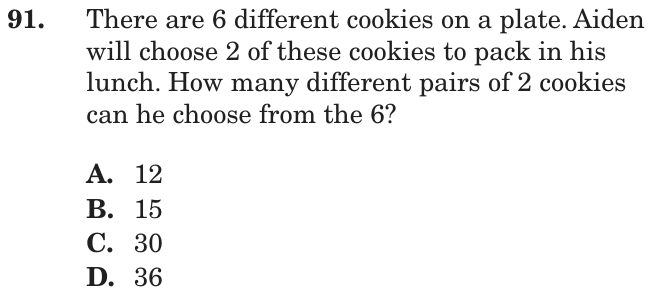
Question 41 of 45
2018 Test A Math, question 42Question
A box contains 5 strawberry candies, 3 banana candies, and 2 orange candies. If Braden selects 2 candies at random from this box, without replacement, what is the probability that both candies are not banana?
- A
- B
- C
- D
Show the answer
Correct answer: C
The total number of candies in the box is
5 + 3 + 2 = 10
The number of candies that are not banana is
5 + 2 = 7
The probability of the first candy not being banana is
Now, out of 9 candies, there are 6 candies left that are not banana. The probability of the second candy not being banana is
Multiply these two probabilities to get the solution:
Question analysis
This probability question has a box of strawberry, banana and orange candies and asks the chance that two candies drawn without replacement are both not banana. Students must count the non-banana candies, find the chance for each draw, and multiply. The second draw changes because one candy is already gone.
- NYS standards
- 7.SP.8a compound event as fraction of outcomes
- Grade level
- Grade 7 content, by NYS standard
- Compared with grade 7
- Above grade 7 Grade 7 compound probability usually uses lists or tree diagrams for independent events such as coins and number cubes. Here the draws are dependent, and students must also work with the complement, 'not banana'.
- Estimated difficulty
- Hard: combines ideas, needs a plan, and has more than one tempting wrong answer.
- Thinking it demands
- Depth of knowledge 2, skills and concepts · mainly apply
- What makes it hard
- Combines ideas moderate
- A very close wrong answer moderate
- Error-prone arithmetic minor
- Solution
- 3 steps
- Reading level
- Question and choices: about grade 9, 35 words.
- Corrected from the DOE handbook
- A stray punctuation mark in the explanation was removed.
- Students, last 30 days
- Not enough answers yet to show (it takes 10).
Why it is hard, traps and wrong answers (shows the answer)
Why it is hard
Two phrases in the stem change the calculation, "not" and "without replacement", and each has a choice for the student who misses it. The cleanest approach treats strawberry and orange together as one group of 7 and then works through the two draws in order. Students who know independent probability well are the most likely to square a fraction out of habit.
Combines ideas moderate Working it out
Two ideas meet: counting the 7 non-banana candies as the favorable group, and reducing both counts by one for the dependent second draw. (Embretson, 1998; Daniel & Embretson, 2010)
A very close wrong answer moderate Choosing the answer
The choices 49/100 and 7/15 are about 0.49 and 0.47, so estimating cannot separate them; only noticing that the second draw is 6 of 9, not 7 of 10, does. (Embretson & Wetzel, 1987; Gorin & Embretson, 2006; Ascalon et al., 2007)
Error-prone arithmetic minor Working it out
The product 7/10 × 6/9 = 42/90 must be simplified to 7/15 to match a choice, a reduction by 6 that is easy to stall on. (Brown & Burton, 1978; Junker & Sijtsma, 2001)
Strategy: Count the candies that are not banana, find the chance the first draw is one of them, reduce both counts by one for the second draw, and multiply.
Traps
- Without replacement: In a second pick there is one fewer item, which changes the probability.
- Misreads the question: Misses or misreads a condition or a word in the question: "at least", "each", "remaining", "not".
The wrong answers, classified
A Misreads the question (Hegarty, Mayer & Monk, 1995)
Misses the bold "not" and finds the chance that both candies are banana, 3/10 × 2/9 = 6/90 = 1/15.
B Without replacement (Fischbein & Schnarch, 1997)
Squares 3/10, finding two bananas as if the first candy were put back, which misses both "not" and "without replacement".
D Without replacement (Fischbein & Schnarch, 1997)
Squares 7/10 as if the first candy were returned, keeping 7 of 10 for the second draw instead of 6 of 9.
What was corrected from the DOE handbook, and why
- Explanation: The handbook reads “The probability of the second candy not being banana is. 6/9.” The period after “is” was removed.
Worked solution, step by step
Formulas used
- Probability
- P is the probability, the chance that something happens. f is the number of favorable outcomes, the ones you want. t is the total number of outcomes. It works when every outcome is equally likely, like picking one item at random.
- Two picks in a row
- To find the chance that two things both happen, multiply their chances. For the second chance, use what is left after the first pick. You multiply because you want a fraction of a fraction: the second pick must work in the share of times the first one did.
Sort out what you know
The box has 5 strawberry, 3 banana and 2 orange candies. Braden takes 2 candies. “Without replacement” means he keeps the first candy out. He does not put it back.
You need the chance that neither candy is banana. Watch out: the bold “not” matters. The chance that both are banana is , choice A.
Count the candies
There are 10 candies. The ones that are not banana are the strawberry and orange ones:
Find the chance for the first candy
7 of the 10 candies are not banana. Use the probability formula:
So the first candy is not banana 7 times out of 10.
Find the chance for the second candy
Say the first candy was not banana. Now 9 candies are left, and 6 of them are not banana:
Watch out: the first candy is not put back. Using again gives , choice D.
Multiply the two chances
Simplify by dividing the top and bottom by 6:
So the answer is C, .
Check your answer
Count pairs instead. From 10 candies there are 10 × 9 ÷ 2 = 45 different pairs. Pairs with no banana come from the 7 others: 7 × 6 ÷ 2 = 21. And 21 out of 45 is 7/15. It matches.
More questions like this
The original DOE question
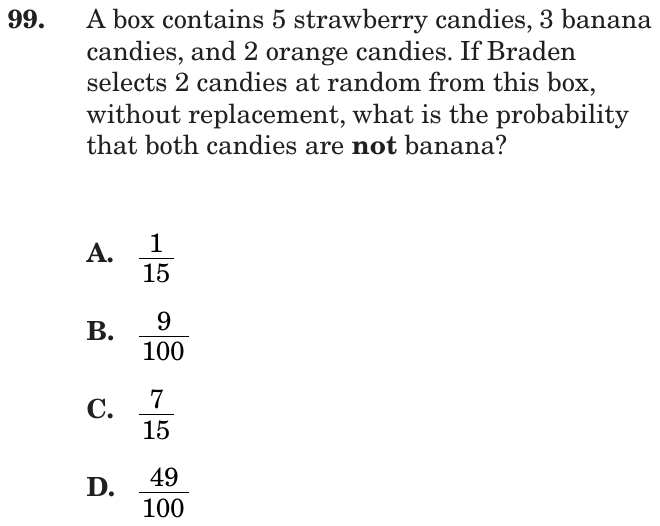
Question 42 of 45
2018 Test B Math, question 1Question
How many 5-digit numbers can be created using the digits 2, 3, 5, 7, and 8 without repeating any digits within that 5-digit number?
Grid-in question: work out the answer and enter it as a number.
Show the answer
Correct answer: 120
There are 5 choices for the first digit, 4 choices for the second digit, 3 choices for the third digit, 2 choices for the fourth digit, and 1 choice for the final digit.
The total number of possibilities is
5 × 4 × 3 × 2 × 1 = 120
Question analysis
This grid-in counting question asks how many different 5-digit numbers can be made from five given digits when no digit may repeat. It tests the counting principle for arrangements rather than arithmetic. The catch is the no-repeat rule: each place has one fewer digit to choose from, and ignoring that gives a far larger count.
- NYS standards
- 7.SP.8b sample spaces for compound events
- Grade level
- Grade 7 content, by NYS standard
- Compared with grade 7
- Above grade 7 Grade 7 probability work builds sample spaces with lists and tree diagrams for two or three stages. This needs the multiplication principle with a shrinking number of choices across five places, which listing cannot reach.
- Estimated difficulty
- Moderate: several steps, or a close reading with one strong distractor.
- Thinking it demands
- Depth of knowledge 2, skills and concepts · mainly apply
- What makes it hard
- Solution
- 2 steps
- Reading level
- Question and choices: about grade 11, 19 words.
- Students, last 30 days
- Not enough answers yet to show (it takes 10).
Why it is hard, traps and wrong answers (shows the answer)
Why it is hard
The arithmetic is tiny; the difficulty is knowing that arrangements are counted by multiplying, and that the no-repeat rule removes one digit for each later place. Students who have met the counting principle finish in seconds, while those who start listing numbers run out of time or guess a product they half remember. With no choices to check against, the 3,125 that comes from ignoring the rule looks as convincing as the right count.
Something you must already know moderate Working it out
Nothing in the stem names the counting principle: students must already know to multiply the digits left for each place, 5 × 4 × 3 × 2 × 1, because listing 5-digit numbers by hand cannot finish. (Anderson & Krathwohl, 2001)
An answer in an unexpected form minor Choosing the answer
As a grid-in there are no choices to compare with, so a count of 3,125 or 25 cannot be caught by noticing that it is missing from a list. (Enright, Morley & Sheehan, 2002)
Strategy: Fill the five places from left to right, write how many digits are still available for each place, and multiply those five counts together.
Traps
- Without replacement: In a second pick there is one fewer item, which changes the probability.
The wrong answers, classified
3125 Without replacement (Fischbein & Schnarch, 1997)
Uses the counting principle but lets digits repeat, multiplying 5 × 5 × 5 × 5 × 5 instead of using one fewer digit for each later place.
25 Numbers taken from the question (Hegarty, Mayer & Monk, 1995)
Multiplies the five digits by the five places, 5 × 5, as if each digit simply took each position once.
15 Wrong operation (Hegarty, Mayer & Monk, 1995; King et al., 2004)
Sees that the choices shrink from 5 to 1 but adds them, 5 + 4 + 3 + 2 + 1, instead of multiplying.
Worked solution, step by step
Formulas used
- Counting principle
- a is the number of choices for the first spot, b for the second, c for the third, and so on. Multiply them to get every possible way. It works because each choice for one spot can go with each choice for the next spot.
Sort out the question
You have five digits: 2, 3, 5, 7 and 8. A digit is one of the symbols 0 to 9. You build 5-digit numbers from them.
“Without repeating” means each digit is used only once in a number. So 23578 is allowed, but 22578 is not.
You need to find how many different numbers you can make.
Count the choices for each spot
Think of the number as five empty spots. Fill them from left to right.
- First spot: any of the 5 digits, so 5 choices.
- Second spot: one digit is used up, so 4 are left.
- Third spot: 3 are left.
- Fourth spot: 2 are left.
- Last spot: only 1 is left.
Multiply the choices together
Use the counting principle. Each choice for one spot works with every choice for the next spot. So you multiply. You do not add.
There are 120 different numbers.
Watch out: Adding 5 + 4 + 3 + 2 + 1 gives 15, which is far too small. Using 5 choices for every spot gives 3,125. That count lets digits repeat, which the question does not allow.
So you would grid 120.
Check your answer
Try a smaller case you can list. With the digits 2, 3 and 5, the rule gives numbers. The list is 235, 253, 325, 352, 523 and 532. That is 6, so the rule works.
More questions like this
The original DOE question
Question 43 of 45
2018 Test B Math, question 37Question
A pizza shop offers a choice of 3 sizes (small, medium, and large) and 7 different toppings. Different pizzas can be created by changing the size and/or the choice of toppings. If Cody wants to order a pizza with exactly 2 different toppings, how many different pizzas can he create?
- A6
- B21
- C63
- D126
Show the answer
Correct answer: C
First, figure out how many different topping pairs are possible. Use 1, 2, 3, 4, 5, 6, 7 to represent the toppings and create a list of possible pairs:
1,2; 1,3; 1,4; 1,5; 1,6; 1,7
2,3; 2,4; 2,5; 2,6; 2,7
3,4; 3,5; 3,6; 3,7
4,5; 4,6; 4,7
5,6; 5,7
6,7
So there are 21 different topping combinations for one pizza. Since there are 3 pizza sizes, multiply the total number of combinations by 3 to get the total number of different pizzas Cody can create:
3 × 21 = 63
Question analysis
A pizza shop offers 3 sizes and 7 toppings, and Cody wants exactly 2 different toppings; students count how many different pizzas he could order. It tests counting combinations, where the order of the toppings does not matter, together with the multiplication principle. The difficulty is counting each topping pair exactly once and including every way the pizzas can differ.
- NYS standards
- 7.SP.8b sample spaces for compound events
- Grade level
- Grade 7 content, by NYS standard
- Compared with grade 7
- Above grade 7 Grade 7 students list outcomes for compound events, usually ordered pairs like a coin and a die. Choosing an unordered pair from seven items and combining it with sizes goes beyond that, and two traps are well placed.
- Estimated difficulty
- Hard: combines ideas, needs a plan, and has more than one tempting wrong answer.
- Thinking it demands
- Depth of knowledge 2, skills and concepts · mainly apply
- What makes it hard
- Combines ideas moderate
- Something you must already know minor
- Solution
- 3 steps
- Reading level
- Question and choices: about grade 8, 48 words.
- Students, last 30 days
- Not enough answers yet to show (it takes 10).
Why it is hard, traps and wrong answers (shows the answer)
Why it is hard
The question hides two separate counts behind one sentence, and both carry traps: order does not matter among toppings, while size multiplies everything. Students who list pairs systematically are safe on the first count but often forget the second, and students who reach for 7 × 6 double the pairs. The phrase "size and/or the choice of toppings" is the cue that sizes count too.
Combines ideas moderate Working it out
Two counting ideas are joined: choosing an unordered pair from 7 toppings, then multiplying by the 3 sizes, and either part can go wrong on its own. (Embretson, 1998; Daniel & Embretson, 2010)
Something you must already know minor Working it out
Students must see that a pair of toppings is the same pizza in either order, so the product 7 × 6 counts every pair twice. (Anderson & Krathwohl, 2001)
Strategy: List the topping pairs systematically (topping 1 with each later topping, then topping 2 with each later one, and so on), count them, then multiply by the number of sizes.
Traps
- Stops one step early: A choice is a number from partway through the solution.
- Overlapping groups: Things in two groups at once are counted twice, or not subtracted.
The wrong answers, classified
A Numbers taken from the question (Hegarty, Mayer & Monk, 1995)
Multiplies the 3 sizes by the 2 toppings, using the number of toppings chosen instead of the number of ways to choose them.
B Stops one step early (King et al., 2004; Gierl et al., 2017)
Counts the 21 topping pairs correctly but stops without multiplying by the 3 sizes each pair can come in.
D Overlapping groups (King et al., 2004)
Counts ordered pairs, 7 × 6 = 42 for each size, so each pair of toppings is counted twice, then multiplies by 3 to get 126.
Worked solution, step by step
Formulas used
- Counting principle
- a is the number of ways to make the first choice. b is the number of ways to make the second choice. Each first choice can go with every second choice, so you multiply to count them all.
- Number of pairs from a group
- n is how many things you can pick from. n times (n − 1) counts a first pick times a second pick. But that counts each pair twice, once in each order. Dividing by 2 fixes that. Use it when order does not matter.
Sort out the question
There are 3 sizes and 7 toppings. Cody picks one size and exactly 2 different toppings. Order does not matter for the toppings. Ham and olives is the same pizza as olives and ham. You need the number of different pizzas.
List the topping pairs
Number the toppings 1 to 7. Pair topping 1 with each later topping. Then pair topping 2 with each later one, and so on.
- 1 with 2, 3, 4, 5, 6 or 7: 6 pairs
- 2 with 3 to 7: 5 pairs
- 3 with 4 to 7: 4 pairs
- Then 3, 2 and 1 more pairs
There are 21 topping pairs.
Check the pairs with the formula
Use the pairs formula with 7 toppings.
This matches the list.
Watch out: counts each pair twice. Forgetting to divide by 2 gives , choice D.
Multiply by the three sizes
Each topping pair can come in any of the 3 sizes. Use the counting principle.
Watch out: stopping at 21 forgets the sizes. That gives choice B.
Give the answer
There are 21 topping pairs and 3 sizes for each. So the answer is C, 63 different pizzas.
Check your answer
Test the pairs idea on a smaller case. With 3 toppings, the pairs are 1 and 2, 1 and 3, and 2 and 3. That is 3 pairs. The formula gives . It works, so 21 pairs and 63 pizzas are right.
More questions like this
The original DOE question
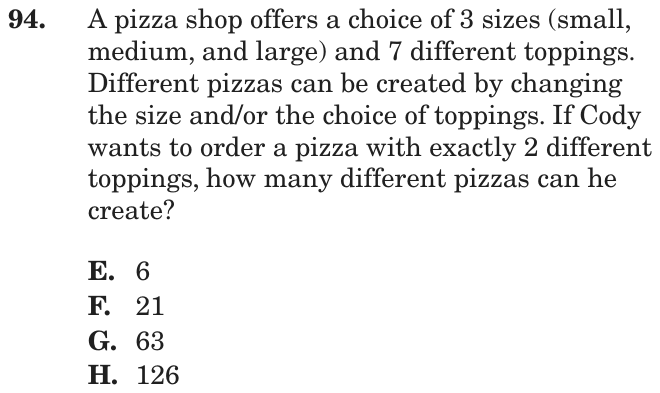
Question 44 of 45
2018 Test B Math, question 46Question
In a sample of 50 cars at a local dealership, there are 12 red cars and 10 cars with backup cameras. Of the 12 red cars, 4 have backup cameras. If a car is selected at random from the given sample, what is the probability that both of the following are true: the car is not red and does not have a backup camera?
- A
- B
- C
- D
Show the answer
Correct answer: B
Create a chart using the given information and use subtraction to figure out how many cars are not red and do not have a back-up camera:
| Red | Not Red | TOTAL | |
| Back-up Camera | 4 | 6 (10-4) |
10 |
| No back-up Camera | 32 (38-6) |
||
| TOTAL | 12 | 38 (50-12) |
50 |
The probability of selecting a car that meets both conditions from the total of 50 cars at the dealership is .
Question analysis
In a sample of 50 cars, 12 are red, 10 have backup cameras, and 4 of the red cars have cameras. Students find the probability that a randomly chosen car is neither red nor equipped with a camera. It tests compound probability with overlapping groups, and the overlap between red cars and camera cars is what makes it tricky.
- NYS standards
- Grade level
- Grade 7 content, by NYS standard
- Compared with grade 7
- Above grade 7 Grade 7 compound probability usually uses a ready-made table or tree. Here students must build the two-way table from words, handle an overlap, and use a "not this and not that" condition, several steps beyond typical work.
- Estimated difficulty
- Hard: combines ideas, needs a plan, and has more than one tempting wrong answer.
- Thinking it demands
- Depth of knowledge 2, skills and concepts · mainly apply
- What makes it hard
- Much to keep track of major
- Many steps moderate
- A very close wrong answer moderate
- Complex sentences minor
- Solution
- 4 steps
- Reading level
- Question and choices: about grade 6, 63 words.
- Corrected from the DOE handbook
- A grammar slip in the explanation was corrected.
- Students, last 30 days
- Not enough answers yet to show (it takes 10).
Why it is hard, traps and wrong answers (shows the answer)
Why it is hard
This is an overlap problem dressed as probability: the hard part is counting the cars that avoid both features, not the division by 50. A two-way table makes it routine, but students working in their heads often keep only one of the two conditions. The question rewards placing the 4 red cars with cameras in the table before doing any subtraction.
Much to keep track of major Working it out
Three overlapping counts, 12 red, 10 with cameras and 4 that are both, must be sorted into four groups before the wanted one, neither red nor with a camera, can be found. (Sweller, 1988; Carpenter, Just & Shell, 1990)
Many steps moderate Working it out
Find the non-red cars with cameras, 10 − 4 = 6, and the non-red cars, 50 − 12 = 38, subtract to get 32, then simplify 32/50. (Daniel & Embretson, 2010; Enright, Morley & Sheehan, 2002)
A very close wrong answer moderate Choosing the answer
19/25, or 38/50, has the same denominator as the right 16/25 and sits just above it; only removing the 6 non-red cars that have cameras from the 38 separates them. (Embretson & Wetzel, 1987; Gorin & Embretson, 2006; Ascalon et al., 2007)
Complex sentences minor Understanding the question
The last sentence stacks "both of the following are true", a colon and two negatives, "not red" and "does not have"; untangling it is reading work, not extra math. (Abedi & Lord, 2001; Freedle & Kostin, 1993; Messick, 1989)
Strategy: Draw a two-way table with red and not red across, camera and no camera down, fill in the given counts, and complete the missing cells by subtraction.
Traps
- Misreads the question: Misses or misreads a condition or a word in the question: "at least", "each", "remaining", "not".
- Answers a different question: A choice is right for another quantity: the other unknown, the rest instead of the part, the part instead of the whole.
The wrong answers, classified
A Answers a different question (King et al., 2004; Hegarty, Mayer & Monk, 1995)
Finds the 6 non-red cars with cameras and divides by the 10 camera cars, 6/10 = 3/5, a different probability from the one asked.
C Misreads the question (Hegarty, Mayer & Monk, 1995)
Uses only the 38 cars that are not red, 38/50, and ignores the second condition that the car also lacks a backup camera.
D Misreads the question (Hegarty, Mayer & Monk, 1995)
Counts only the 40 cars without backup cameras, 40/50, dropping the requirement that the car must not be red as well.
What was corrected from the DOE handbook, and why
- Explanation: The handbook says “a car that meet both conditions”; the site says “a car that meets both conditions.”
Worked solution, step by step
Formulas used
- Probability
- P is the probability, the chance that something happens. The top counts the results you want. The bottom counts every possible result. Use it when each result is equally likely, like picking one at random.
Sort out what you know
There are 50 cars. Of these, 12 are red and 10 have backup cameras. Of the red cars, 4 have cameras. You pick one car at random. You need the chance that “both of the following are true”: the car is not red, and it has no camera.
Set up a two-way table
A two-way table sorts each car by two things at once: its color and its camera. Put in the numbers you know.
Red Not red Total Camera 4 ? 10 No camera ? Total 12 ? 50 Fill in the missing numbers
Not red with a camera: cars.
All cars that are not red: cars.
Not red with no camera: cars.
Watch out: the 38 cars that are not red include 6 with cameras. Using 38 gives , choice C. Using all 40 cars with no camera gives , choice D.
Write the probability
Use the probability formula. There are 32 cars you want out of 50 cars in all.
Divide the top and bottom by 2.
So the answer is B, .
Check your answer
Finish the table. Red cars with no camera: . Now add the four inside boxes: . That is every car, so the numbers fit. Also, the cars with no camera are , and too.
More questions like this
The original DOE question
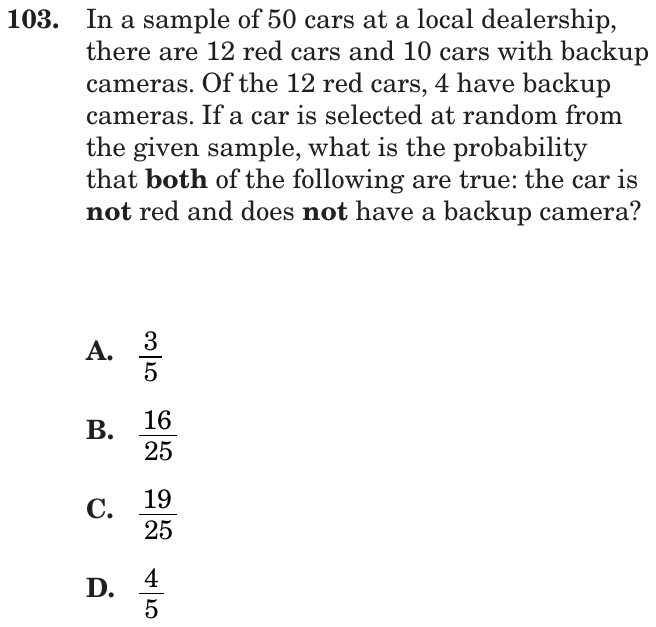
Question 45 of 45
2018 Test B Math, question 53Question
At North High School, a survey asked two questions, Question A and Question B. For each question, students could answer either “yes” or “no.” Of the 800 students who responded to the survey, 720 answered “yes” to Question A, and 640 answered “yes” to Question B. What is the least possible number of these students who could have answered “yes” to both questions?
- A80
- B160
- C560
- D640
Show the answer
Correct answer: C
None of the 80 students (800 − 720) who answered “no” to Question A could have answered “yes” to both questions.
Therefore, the least possible number of students who could have answered “yes” to both questions can be found by subtracting the 80 who answered “no” to Question A from the 640 who answered “yes” to Question B or 640 − 80 = 560.
Question analysis
In a survey of 800 students at North High School, 720 said yes to the first question and 640 said yes to the second. Students must find the smallest possible number who said yes to both. It tests reasoning about overlapping groups, and asking for the least possible overlap rather than an exact count makes it unusual.
- NYS standards
- Grade level
- Grade 7 content, by NYS standard
- Compared with grade 7
- Above grade 7 Grade 7 students work with Venn diagrams and two-way tables when all counts are given. Finding the smallest possible overlap requires reasoning about extremes rather than computing, which is rare in grade 7 and new to most students.
- Estimated difficulty
- Among the hardest on the SHSAT: a non-obvious approach, heavy reading, or a well-hidden trap.
- Thinking it demands
- Depth of knowledge 3, strategic thinking · mainly analyze
- What makes it hard
- No obvious method major
- Turning words into math moderate
- A very close wrong answer minor
- Solution
- 2 steps
- Reading level
- Question and choices: about grade 8, 60 words.
- Corrected from the DOE handbook
- A repeated phrase and a stray comma in the explanation were removed.
- Students, last 30 days
- Not enough answers yet to show (it takes 10).
Why it is hard, traps and wrong answers (shows the answer)
Why it is hard
Most students have never been asked for a smallest overlap, so they fall back on a picture of nested groups and give the largest one. The key move is to push the two yes groups apart as far as possible: only the 80 students who said no to Question A can absorb some of Question B's yes answers. Once that is seen, the arithmetic is one subtraction, so the question rewards reasoning far more than computation.
No obvious method major Working it out
Nothing in the wording points to the method: the smallest overlap appears only when all 80 students who said no to Question A are imagined saying yes to Question B. (Schoenfeld, 1985)
Turning words into math moderate Understanding the question
"The least possible number of these students who could have answered “yes” to both questions" asks for an extreme case, which has to be turned into an arrangement of the 800 students. (Hegarty, Mayer & Monk, 1995; Koedinger & Nathan, 2004)
A very close wrong answer minor Choosing the answer
640 is only 80 above the right 560, so a rough sense of size cannot choose between them; only asking whether the overlap is the least or the greatest separates them. (Embretson & Wetzel, 1987; Gorin & Embretson, 2006; Ascalon et al., 2007)
Strategy: Add the two yes counts and compare the sum with the number of students; any amount above the total must come from students counted in both groups.
Traps
- NOT, LEAST or EXCEPT: The question asks for the exception, the least, or what is not true.
- Stops one step early: A choice is a number from partway through the solution.
- Answers a different question: A choice is right for another quantity: the other unknown, the rest instead of the part, the part instead of the whole.
The wrong answers, classified
A Stops one step early (King et al., 2004; Gierl et al., 2017)
Finds the 80 students who said no to Question A, 800 − 720, and stops before subtracting them from the 640 who said yes to Question B.
B Answers a different question (King et al., 2004; Hegarty, Mayer & Monk, 1995)
Finds the 160 students who said no to Question B, 800 − 640, which bears on the count but is not the overlap asked about.
D Answers a different question (King et al., 2004; Hegarty, Mayer & Monk, 1995)
Assumes everyone who said yes to Question B also said yes to Question A, giving the greatest possible overlap instead of the least.
What was corrected from the DOE handbook, and why
- Explanation: The handbook prints “(800 − 720)” twice in its first sentence, after “80 students” and again after “Question A,” and puts a comma between subject and verb in “the least possible number of students who could have answered “yes” to both questions, can be found.” The site keeps the first “(800 − 720)” and drops the comma.
Worked solution, step by step
Formulas used
- Least overlap of two groups
- a is the size of the first group and b is the size of the second. t is the total number of people. If a + b is more than t, some people must be in both groups. The extra amount is the smallest number that can be in both.
Sort out what you know
There were 800 students. Of them, 720 said yes to Question A and 640 said yes to Question B. You need the least number who could have said yes to both. The overlap is the group in both yes groups. You want the smallest overlap.
Find who said no to A
Students who said no to Question A cannot be in the overlap.
So 80 students said no to Question A.
Watch out: 80 is not the answer. It is only a step, and it is choice A.
Keep the overlap small
To make the overlap as small as you can, put as many B yes answers outside it as possible. The only students outside it are the 80 who said no to A. So pretend all 80 of them said yes to B.
Count the rest of the yes group
The other yes answers to B must come from students who also said yes to A.
So at least 560 students said yes to both.
Watch out: 640 is the most that could say yes to both, not the least. That is choice D.
Give the answer
The fewest students who could say yes to both questions is 560. So the answer is C, 560.
Check your answer
Use the overlap formula: . There are 1,360 yes answers but only 800 students, so 560 students must be counted twice. You can also check the groups. 560 said yes to both, 160 to A only and 80 to B only. That makes .
More questions like this
The original DOE question