Question
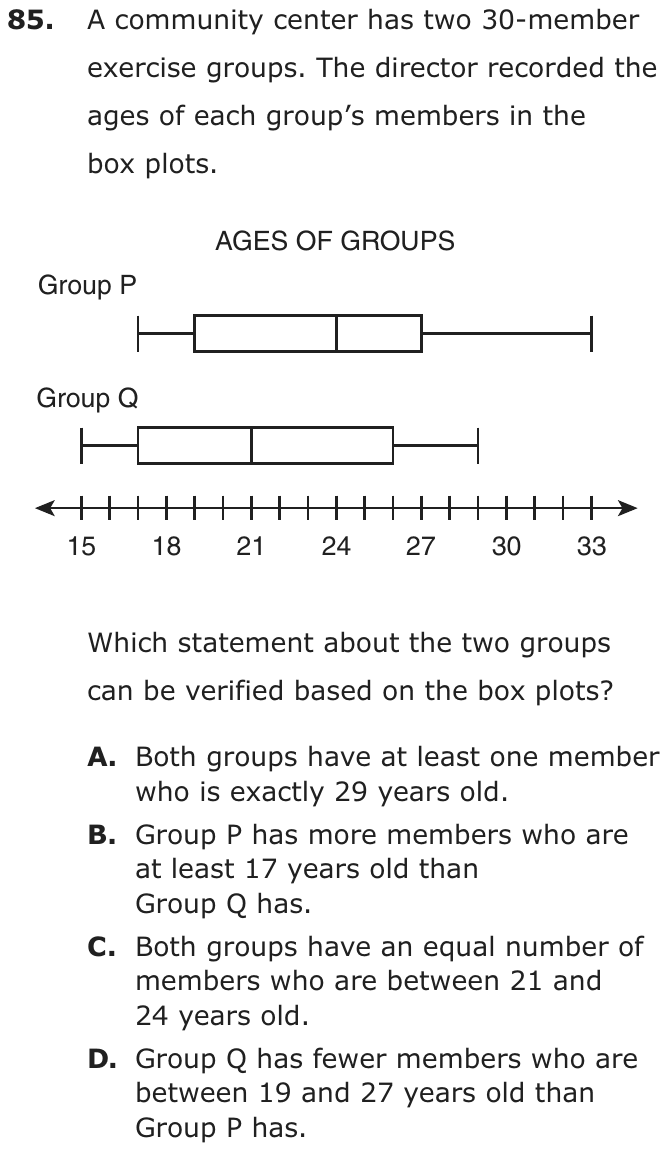
A community center has two 30-member exercise groups. The director recorded the ages of each group’s members in the box plots.
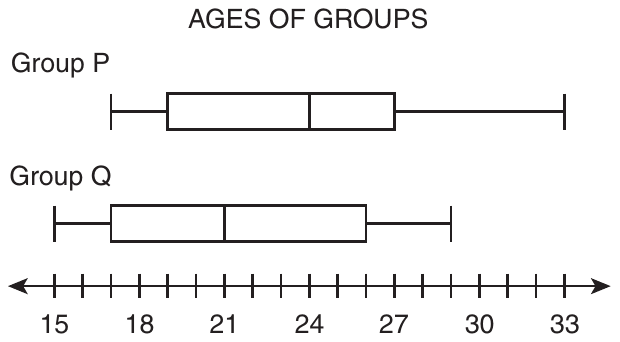
Which statement about the two groups can be verified based on the box plots?
- ABoth groups have at least one member who is exactly 29 years old.
- BGroup P has more members who are at least 17 years old than Group Q has.
- CBoth groups have an equal number of members who are between 21 and 24 years old.
- DGroup Q has fewer members who are between 19 and 27 years old than Group P has.
Show the answer
Correct answer: B
Groups P and Q have an equal number of members. All the members of Group P are 17 or older, but only about of the members of Group Q are 17 or older.
Question analysis
Box plots show the ages of the members of two 30-member exercise groups at a community center, Group P and Group Q. Students decide which statement comparing the groups can be verified from the plots alone. The challenge is knowing what a box plot guarantees about individual ages and counts, and what it leaves unknown.
- NYS standards
- Grade level
- Grade 7 content, by NYS standard
- Compared with grade 7
- Above grade 7 Grade 7 students read box plots and compare medians and spreads. Deciding which claims two box plots can prove, from what the five key values guarantee about counts, is a harder reasoning task than typical grade 7 work.
- Estimated difficulty
- Hard: combines ideas, needs a plan, and has more than one tempting wrong answer.
- Thinking it demands
- Depth of knowledge 3, strategic thinking · mainly evaluate
- What makes it hard
- Every choice must be checked major
- Something you must already know moderate
- Reading a figure, table or graph moderate
- Solution
- 3 steps
- Reading level
- Question and choices: about grade 5, 91 words.
- Students, last 30 days
- Not enough answers yet to show (it takes 10).
Why it is hard, traps and wrong answers (shows the answer)
Why it is hard
This is a question about evidence: the right statement is the only one the box plots guarantee, while the others may or may not be true. Students who treat the plots as pictures of every member, assuming ages fill each whisker or spread evenly through each box, find support for claims that cannot be checked. Asking what must hold for any 30 ages with these summaries separates the verifiable claim from the merely plausible ones.
Every choice must be checked major Choosing the answer
Three of the statements are not false but unverifiable, so each must be tested against what the five-number summaries guarantee, and none can be dismissed at a glance. (Embretson & Wetzel, 1987)
Something you must already know moderate Working it out
Students must know that the minimum and maximum are actual ages, that each quarter of a plot holds about a quarter of the 30 members, and that a whisker shows nothing in between. (Anderson & Krathwohl, 2001)
Reading a figure, table or graph moderate Understanding the question
The scale is labeled only every 3 years, so values such as 17, 19, 26 and 29 have to be read from unlabeled ticks on two separate plots. (Lesh, Post & Behr, 1987; Kirsch & Mosenthal, 1990)
Strategy: List each group's minimum, first quartile, median, third quartile and maximum, then test every statement against only what those five values guarantee about the 30 ages.
Traps
- Misunderstands the concept: A wrong belief about a concept: that percents can be added, that area grows like length, that averages can be averaged, that a bigger denominator means a bigger fraction.
- Numbers taken from the question: Combines the numbers in the question without a model of the situation, or is simply a number that appears in the question.
The wrong answers, classified
A Misunderstands the concept (Smith, diSessa & Roschelle, 1993; De Bock et al., 1998; Ni & Zhou, 2005)
Sees that Group Q's maximum is exactly 29 and that 29 also lies in Group P's upper whisker, assuming someone in Group P is that age.
C Numbers taken from the question (Hegarty, Mayer & Monk, 1995)
Matches the two medians, 21 and 24, and assumes the stretch between them holds the same number of members in both groups.
D Misunderstands the concept (Smith, diSessa & Roschelle, 1993; De Bock et al., 1998; Ni & Zhou, 2005)
Knows Group P's box from 19 to 27 holds half its members, then assumes ages spread evenly so Group Q has fewer there, which its plot cannot show.
Worked solution, step by step
Formulas used
- Members in each part of a box plot
- n is the number of members in a group, here 30. A box plot splits the data into four parts at the minimum, Q1, the median, Q3 and the maximum. Each part holds about one fourth of the data. It does not show how the ages spread out inside a part.
Read the two box plots
A box plot shows five numbers. The minimum is the youngest age, and the maximum is the oldest. Q1 is the left edge of the box, and Q3 is the right edge. The median is the line inside the box.
Group Min Q1 Median Q3 Max P 17 19 24 27 33 Q 15 17 21 26 29 Each group has 30 members.
Know what can be verified
To verify a statement means to know for sure that it is true. A box plot shows only five numbers, not every age. The minimum and maximum are real ages of real members. The other ages are hidden inside the box and whiskers.
Check choice B
In Group P, the youngest member is 17. So all 30 members are at least 17. In Group Q, the youngest member is 15, and 15 is under 17. So at most 29 members of Group Q are at least 17.
Group P has 30 such members, and Group Q has 29 or fewer. So choice B is true for sure.
Rule out choices A and C
A: Group Q’s oldest member is 29, so Group Q has a 29-year-old. But in Group P, 29 is inside the right whisker. A whisker does not show single ages. Watch out: 29 is in Group P’s range, but maybe no one in Group P is exactly 29.
C: The plots do not show how many members are between 21 and 24 in either group.
Rule out choice D and answer
Group P’s box, from 19 to 27, is two of its four parts.
So about 15 members of Group P are between 19 and 27. But 19 and 27 fall in the middle of Group Q’s parts, and ages inside a part can bunch up in any way. Group Q could have more or fewer. Watch out: D assumes the ages are spread out evenly, and a box plot never tells you that.
So the answer is B.
Check your answer
Choice B uses only the two minimums, which are real ages. Group P’s youngest member is 17, and Group Q’s is 15. That alone proves it. Each other choice needs ages inside a box or whisker, which a box plot does not show.
More questions like this
The original DOE question