Question
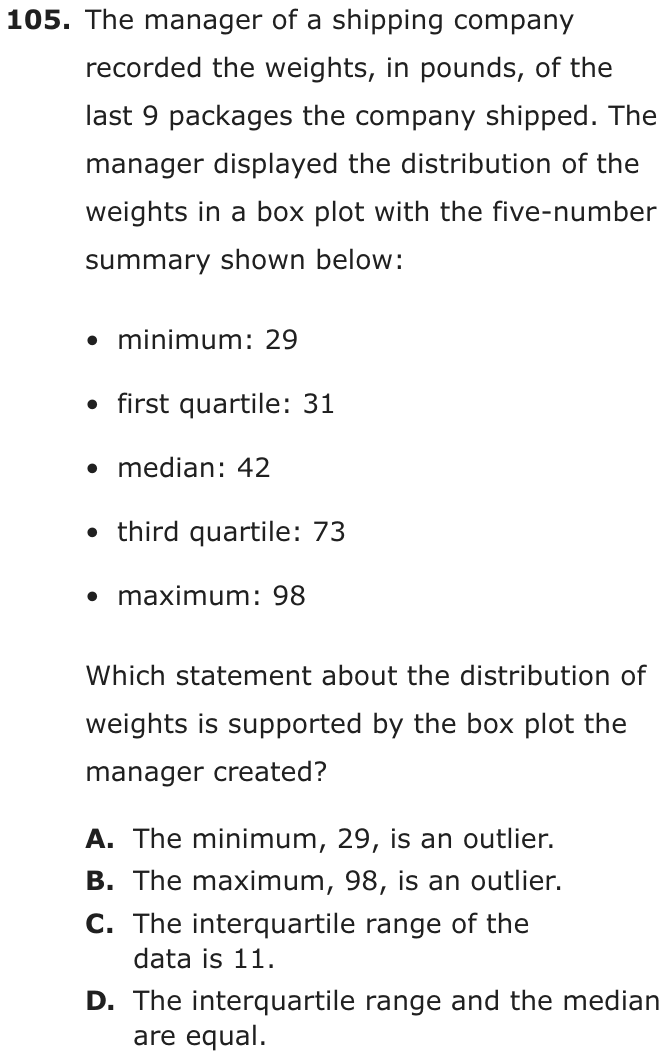
The manager of a shipping company recorded the weights, in pounds, of the last 9 packages the company shipped. The manager displayed the distribution of the weights in a box plot with the five-number summary shown below:
- minimum: 29
- first quartile: 31
- median: 42
- third quartile: 73
- maximum: 98
Which statement about the distribution of weights is supported by the box plot the manager created?
- AThe minimum, 29, is an outlier.
- BThe maximum, 98, is an outlier.
- CThe interquartile range of the data is 11.
- DThe interquartile range and the median are equal.
Show the answer
Correct answer: D
First, identify the first quartile and the third quartile:
- first quartile: 31
- third quartile: 73
Then, find the difference between the first quartile and the third quartile:
The median is given: 42.
So, the interquartile range and the median are equal.
Question analysis
This statistics question gives the five-number summary of nine package weights shown in a box plot and asks which statement about the distribution is supported. Students compute the interquartile range and decide whether the minimum or the maximum is an outlier. Judging outliers by eye, or subtracting the wrong pair of values for the IQR, makes wrong statements look true.
- NYS standards
- 7.SP.1 box plots and interquartile range
- Grade level
- Grade 7 content, by NYS standard
- Compared with grade 7
- At grade 7 Finding the interquartile range and testing for outliers are grade 7 standards in New York. There is no plot to read here, only five numbers, but every statement has to be checked by calculation, which makes it a careful grade 7 task.
- Estimated difficulty
- Moderate: several steps, or a close reading with one strong distractor.
- Thinking it demands
- Depth of knowledge 2, skills and concepts · mainly apply
- What makes it hard
- Something you must already know moderate
- Every choice must be checked moderate
- Solution
- 3 steps
- Reading level
- Question and choices: about grade 7, 84 words.
- Students, last 30 days
- Not enough answers yet to show (it takes 10).
Why it is hard, traps and wrong answers (shows the answer)
Why it is hard
The numbers are given outright, so the work is knowing what each statement claims and testing it. The outlier statements sound right because 98 looks far from 73 and 29 is the smallest value, but the 1.5 × IQR rule clears both. The true statement needs only one subtraction, 73 − 31, and a look at the median, which happens to have the same value.
Something you must already know moderate Working it out
Neither the interquartile range, the third quartile minus the first, nor the outlier rule, more than 1.5 × IQR beyond a quartile, is defined on the page. (Anderson & Krathwohl, 2001)
Every choice must be checked moderate Choosing the answer
The four statements test different ideas, two possible outliers, a value for the IQR and a comparison of the IQR with the median, so ruling out one says nothing about the next. (Embretson & Wetzel, 1987)
Strategy: Compute the interquartile range from the two quartiles, use it to set the outlier cutoffs 1.5 IQR beyond each quartile, and test every statement against those numbers.
Traps
- Misunderstands the concept: A wrong belief about a concept: that percents can be added, that area grows like length, that averages can be averaged, that a bigger denominator means a bigger fraction.
- Wrong formula: Uses a related but wrong formula: perimeter for area, diameter for radius, area for volume, or a misremembered one.
The wrong answers, classified
A Misunderstands the concept (Smith, diSessa & Roschelle, 1993; De Bock et al., 1998; Ni & Zhou, 2005)
Calls 29 an outlier just because it is the minimum, though it sits only 2 below the first quartile and far inside the cutoff 31 − 63 = −32.
B Misunderstands the concept (Smith, diSessa & Roschelle, 1993; De Bock et al., 1998; Ni & Zhou, 2005)
Judges 98 an outlier because it lies 25 above the third quartile, without testing it against the cutoff 73 + 1.5 × 42 = 136.
C Wrong formula (King et al., 2004)
Subtracts the first quartile from the median, 42 − 31 = 11, instead of from the third quartile, measuring only the lower half of the box.
Worked solution, step by step
Formulas used
- Interquartile range
- Q1, the first quartile, is the middle of the lower half of the data. Q3, the third quartile, is the middle of the upper half. The interquartile range, or IQR, is the distance between them. It is the width of the box in a box plot. It shows how spread out the middle half of the data is.
- Outlier rule
- An outlier is a value far away from the rest of the data. Q1 and Q3 are the quartiles, and IQR is the interquartile range. A value is an outlier if it lies more than 1.5 times the IQR below Q1 or above Q3.
Sort out the question
The manager’s box plot is drawn from the five numbers in the list, so you can work from the list. The weights, in pounds, are: minimum 29, first quartile 31, median 42, third quartile 73, maximum 98. You need the one statement that is true. So check each choice.
Find the interquartile range
The interquartile range is 42 pounds. That makes choice C, which says 11, false.
Compare the IQR with the median
The median is 42 pounds. The interquartile range is also 42 pounds. They are equal, so statement D is true.
Watch out: 42 − 31 = 11 subtracts Q1 from the median, not from Q3. That mistake makes choice C look right.
Test the ends for outliers
An outlier would be below −32 or above 136. The minimum, 29, is not below −32. The maximum, 98, is not above 136. So A and B are false. Watch out: 98 looks far away, but not far enough to be an outlier.
Choose the answer
Only statement D is supported by the five numbers. So the answer is D, the interquartile range and the median are equal.
Check your answer
Check the subtraction by adding back: , which is Q3. The median, 42, sits inside the box, between 31 and 73, as it must. The two measures mean different things, but here they happen to be the same number.
More questions like this
The original DOE question