Question
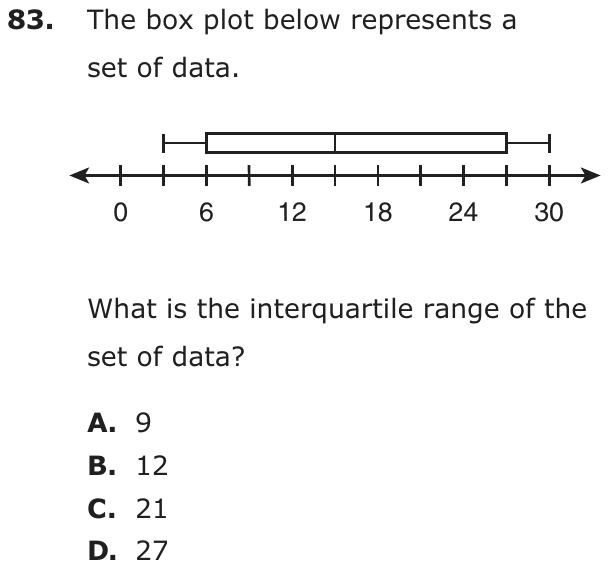
The box plot below represents a set of data.

What is the interquartile range of the set of data?
- A9
- B12
- C21
- D27
Show the answer
Correct answer: C
First, determine the values of the upper and lower quartiles of the set of data:
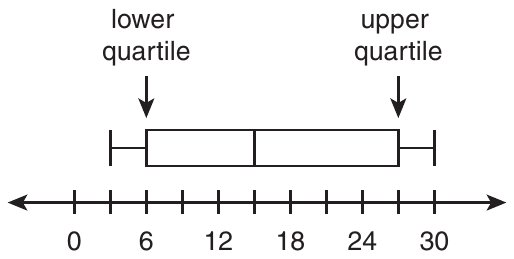
- The upper quartile value is indicated by the vertical line segment at the far right edge of the box plot above the hash mark representing 27.
- The lower quartile value is indicated by the vertical line segment at the far left edge of the box plot above the hash mark representing 6.
To determine the interquartile range, subtract the lower quartile value (6) from the upper quartile value (27):
Question analysis
A box plot on a number line marked every 3 units, with labels every 6, represents a set of data. Students find the interquartile range. They have to read the two ends of the box, one of which falls on an unlabeled tick, and remember exactly which part of the plot the interquartile range measures.
- NYS standards
- 7.SP.1 box plots and interquartile range
- Grade level
- Grade 7 content, by NYS standard
- Compared with grade 7
- At grade 7 Finding the interquartile range from a box plot is a grade 7 skill, and this is a typical example. Read two values and subtract; the only extra care is a box edge that falls on a tick with no label.
- Estimated difficulty
- Straightforward: two steps or one careful reading.
- Thinking it demands
- Depth of knowledge 1, recall and reproduction · mainly apply
- What makes it hard
- Solution
- 2 steps
- Reading level
- Question and choices: about grade 6, 19 words.
- Students, last 30 days
- Not enough answers yet to show (it takes 10).
Why it is hard, traps and wrong answers (shows the answer)
Why it is hard
Once the two edges of the box are read, one subtraction finishes the question, so the work is reading the scale and knowing which part of the plot is meant. The upper quartile falls on an unlabeled tick, which costs care. The wrong answers measure the whole spread or only half of the box, all common mix-ups of what the interquartile range covers.
Reading a figure, table or graph moderate Understanding the question
The axis is labeled only every 6 units but ticked every 3, and the box’s right edge sits on the unlabeled tick for 27, so it has to be counted from 24. (Lesh, Post & Behr, 1987; Kirsch & Mosenthal, 1990)
Something you must already know minor Working it out
Nothing defines the interquartile range; it is the width of the box, the upper quartile minus the lower, not the span of the whiskers. (Anderson & Krathwohl, 2001)
Strategy: Find the values at the left and right edges of the box, counting tick marks in steps of 3 where there is no label, and subtract the smaller from the larger.
Traps
- Wrong formula: Uses a related but wrong formula: perimeter for area, diameter for radius, area for volume, or a misremembered one.
The wrong answers, classified
A Wrong formula (King et al., 2004)
Gives the median minus the lower quartile, 15 − 6 = 9, as the interquartile range, measuring only the left part of the box.
B Wrong formula (King et al., 2004)
Gives the upper quartile minus the median, 27 − 15 = 12, as the interquartile range, measuring only the right part of the box.
D Wrong formula (King et al., 2004)
Subtracts the ends of the whiskers, 30 − 3 = 27, giving the range of the data instead of the interquartile range.
Worked solution, step by step
Formulas used
- Interquartile range
- IQR stands for interquartile range. Q3, the third quartile, is the right edge of a box plot’s box. Q1, the first quartile, is the left edge. Subtracting gives the width of the box, where the middle half of the data lies.
Sort out the question
You see a box plot and need the interquartile range, or IQR. That is the width of the box: the upper quartile minus the lower quartile. The whiskers don’t matter here.
Read the number line
The labels are 0, 6, 12, 18, 24 and 30. But there is a tick mark halfway between each pair of labels. So the ticks go up by 3: 0, 3, 6, 9 and so on. The tick between 24 and 30 stands for 27.
Find the edges of the box
The left edge of the box is at 6. That is the lower quartile, Q1. The right edge is at the unlabeled tick after 24, which is 27. That is the upper quartile, Q3.
Subtract to find the IQR
Watch out: uses the ends of the whiskers. That is the range, choice D. Also, the median line at 15 splits the box. and are each only part of the box. So the answer is C, 21.
Check your answer
Count the tick spaces across the box, from 6 to 27. There are 7 spaces, and each is worth 3. So the box is units wide. That matches.
More questions like this
The original DOE question