Question
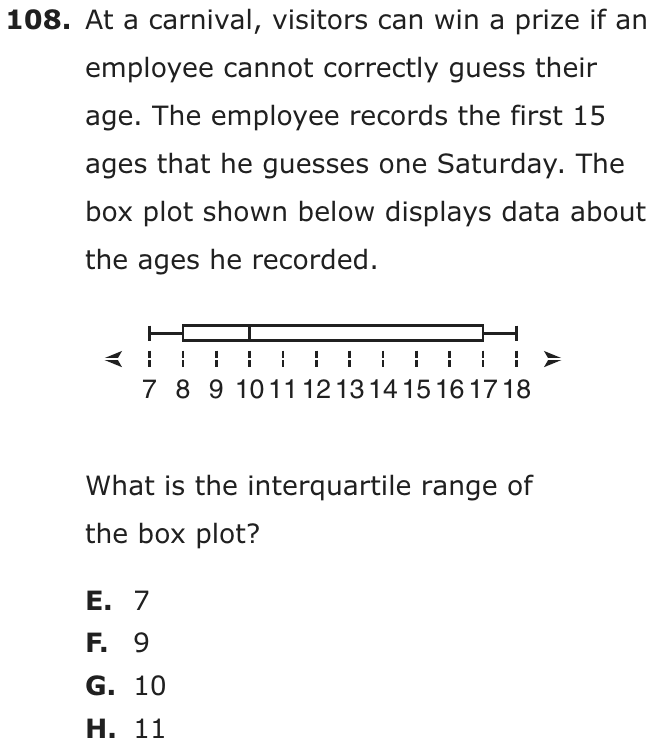
At a carnival, visitors can win a prize if an employee cannot correctly guess their age. The employee records the first 15 ages that he guesses one Saturday. The box plot shown below displays data about the ages he recorded.

What is the interquartile range of the box plot?
- A7
- B9
- C10
- D11
Show the answer
Correct answer: B
Quartile 1 is the median of the lower half of the data, 8.
Quartile 3 is the median of the upper half of the data, 17.
The interquartile range is 9.
Question analysis
This statistics question shows a box plot of 15 ages that a carnival employee guessed and asks for its interquartile range. Students read the quartiles from the edges of the box and subtract. Confusing the interquartile range with the full range, or using the median line in place of a quartile, gives the wrong choices.
- NYS standards
- 7.SP.1 box plots and interquartile range
- Grade level
- Grade 7 content, by NYS standard
- Compared with grade 7
- At grade 7 Reading a box plot and finding its interquartile range is a grade 7 standard in New York. The values sit on labeled whole-number ticks and one subtraction is needed, a routine grade 7 task once the box's edges are known as the quartiles.
- Estimated difficulty
- Straightforward: two steps or one careful reading.
- Thinking it demands
- Depth of knowledge 2, skills and concepts · mainly apply
- What makes it hard
- Solution
- 2 steps
- Reading level
- Question and choices: about grade 6, 48 words.
- Students, last 30 days
- Not enough answers yet to show (it takes 10).
Why it is hard, traps and wrong answers (shows the answer)
Why it is hard
The arithmetic is one subtraction, so the question tests whether students know which parts of a box plot to use. The whiskers' ends give the range, the line inside the box gives the median, and both are easy to grab in place of the quartiles. The story about the carnival and the 15 ages plays no part in the answer.
Something you must already know minor Working it out
The plot shows five values with no labels, so students must know that the box's ends mark the quartiles and that the interquartile range is the box's width, not the whiskers'. (Anderson & Krathwohl, 2001)
Reading a figure, table or graph minor Understanding the question
The values 7, 8, 10, 17 and 18 are read off a scale ticked at every whole number, with the box's ends at 8 and 17 and the median line at 10. (Lesh, Post & Behr, 1987; Kirsch & Mosenthal, 1990)
Strategy: Find the first and third quartiles on the plot by recalling which parts of a box plot mark them, then subtract the smaller quartile from the larger.
Traps
- Wrong formula: Uses a related but wrong formula: perimeter for area, diameter for radius, area for volume, or a misremembered one.
- Misunderstands the concept: A wrong belief about a concept: that percents can be added, that area grows like length, that averages can be averaged, that a bigger denominator means a bigger fraction.
- Information you don't need: The question gives numbers or facts that play no part in the answer.
The wrong answers, classified
A Wrong formula (King et al., 2004)
Subtracts the median from the third quartile, 17 − 10 = 7, measuring only the part of the box right of the middle line.
C Misunderstands the concept (Smith, diSessa & Roschelle, 1993; De Bock et al., 1998; Ni & Zhou, 2005)
Gives the median, 10, read off the line inside the box, taking a single value on the plot for the spread between the quartiles.
D Wrong formula (King et al., 2004)
Subtracts the minimum from the maximum, 18 − 7 = 11, which is the range shown by the whiskers, not the width of the box.
Worked solution, step by step
Formulas used
- Interquartile range
- Q1, the first quartile, is the middle of the lower half of the data. Q3, the third quartile, is the middle of the upper half. In a box plot, Q1 is the left end of the box and Q3 is the right end. So the IQR is the width of the box.
Sort out the question
A box plot shows five numbers. The whiskers, the lines sticking out, end at the smallest and largest values. The box covers the middle half of the data. The line inside the box is the median, the middle value. You need the interquartile range of the ages.
Read the five numbers
Read each one off the number line below the plot.
- Smallest age, the left whisker: 7
- Q1, the left end of the box: 8
- Median, the line inside the box: 10
- Q3, the right end of the box: 17
- Largest age, the right whisker: 18
Find the interquartile range
The interquartile range is 9 years. Watch out: 18 − 7 = 11 is the range, the whole spread from whisker to whisker. That is choice D. The median, 10, is choice C.
So the answer is B, 9.
Check your answer
Count the spaces across the box. From 8 to 17 there are 9 spaces of 1 year each, so the box is 9 years wide. The answer is also less than the whole range, 11, as it must be.
More questions like this
The original DOE question