Graph
Question 1 of 42
2026 Practice Test A Math, question 37Question
When a student buys 4 notebooks, the total cost is $12. Each notebook costs the same amount. Select each point on the graph that best represents y, the total cost of x notebooks.
Select all the correct answers.
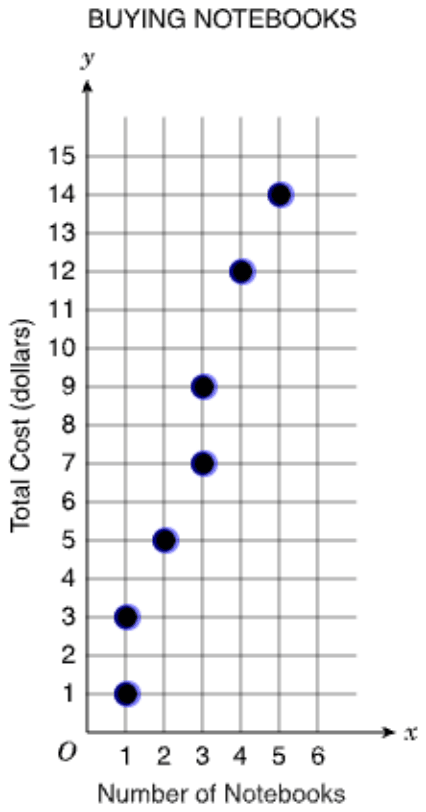
On the test you click the points in the figure; here, choose them below. The DOE has not published how answers with several parts are scored; this site counts one right only when every part is right.
- A(1, 1)
- B(1, 3)
- C(2, 5)
- D(3, 7)
- E(3, 9)
- F(4, 12)
- G(5, 14)
Show the answer
Correct answer: B, E, and F
Solution:
There are three correct points: (1, 3), (3, 9), and (4, 12).
Find the cost per notebook: .
The equation of the line is , where y is the total cost of x notebooks.
Check each point by plugging the x-value into the equation . If the y-value from the equation matches the y-value of the point, then the point is on the line .
Check all seven points:
(1, 1) y-values do not match; incorrect point
(1, 3) y-values match; CORRECT point
(2, 5) y-values do not match; incorrect point
(3, 7) y-values do not match; incorrect point
(3, 9) y-values match; CORRECT point
(4, 12) y-values match; CORRECT point
(5, 14) y-values do not match; incorrect point
Question analysis
A graph titled Buying Notebooks shows seven points, and students select every point that fits the total cost of buying notebooks, given the cost of a few notebooks and that each costs the same. It tests finding a unit rate and recognizing points of a proportional relationship. Some points line up in tempting patterns, and the item does not say how many to select.
- NYS standards
- Grade level
- Grade 7 content, by NYS standard
- Compared with grade 7
- At grade 7 Finding a unit rate and deciding which points fit a proportional relationship are grade 7 skills, and the arithmetic here is easy. What adds demand is testing all seven points with no count given, since one miss or extra pick loses the item.
- Estimated difficulty
- Straightforward: two steps or one careful reading.
- Thinking it demands
- Depth of knowledge 2, skills and concepts · mainly apply
- What makes it hard
- Solution
- 2 steps
- Reading level
- Question and choices: about grade 5, 36 words.
- Students, last 30 days
- Not enough answers yet to show (it takes 10).
Why it is hard, traps and wrong answers (shows the answer)
Why it is hard
Finding the price is one division, 12 ÷ 4 = 3, so the question is really about checking: each chosen dot must fit y = 3x exactly, and the item does not say how many do. The graph punishes judging by eye, since a straight row of dots climbs from (1, 3) at $2 a notebook and two dots sit a single gridline off the true line. Multiplying each x by 3 and reading each y from the axis, not from the pattern, settles all seven.
Every choice must be checked moderate Choosing the answer
Seven dots must each be tested against $3 a notebook, and the item never says how many fit; one missed point or one extra loses the whole item, so no dot can be skipped. (Embretson & Wetzel, 1987)
Reading a figure, table or graph minor Understanding the question
The graph stacks two dots above 1 notebook and two above 3, and each total cost has to be read off a grid ruled at every dollar up to 15. (Lesh, Post & Behr, 1987; Kirsch & Mosenthal, 1990)
A very close wrong answer minor Choosing the answer
(5, 14) sits one gridline below (5, 15), where 5 notebooks at $3 would be, and (2, 5) sits one below (2, 6), so judging by the line's direction cannot rule either out. (Embretson & Wetzel, 1987; Gorin & Embretson, 2006; Ascalon et al., 2007)
Strategy: Work out the cost of one notebook from the total given in the question, then multiply each point's x-coordinate by that price and keep only the points whose y-coordinate matches exactly.
Traps
- Misunderstands the concept: A wrong belief about a concept: that percents can be added, that area grows like length, that averages can be averaged, that a bigger denominator means a bigger fraction.
- Misreads the figure: Reads a value, label or tick spacing in a figure, table or graph wrongly.
The wrong answers, classified
A Little reason to choose it (Haladyna & Downing, 1993; Rodriguez, 2005)
No working from 4 notebooks for $12 makes one notebook cost $1, so this lowest dot mostly catches guesses, such as taking the dot nearest the origin as a start.
C Misunderstands the concept (Smith, diSessa & Roschelle, 1993; De Bock et al., 1998; Ni & Zhou, 2005)
Takes the straight row (1, 3), (2, 5), (3, 7) as the graph because its dots line up, though it climbs $2 a notebook and would meet the y-axis at $1, not the origin.
D Misunderstands the concept (Smith, diSessa & Roschelle, 1993; De Bock et al., 1998; Ni & Zhou, 2005)
Prefers the lower of the two dots above 3 notebooks because it continues the evenly spaced row from (1, 3) and (2, 5), instead of checking that 3 notebooks cost $9.
G Misreads the figure (Lesh, Post & Behr, 1987; Kirsch & Mosenthal, 1990)
Finds that 5 notebooks cost 5 × $3 = $15, then reads the dot above 5 as sitting on the top gridline, 15, when it is one line lower, at 14.
Worked solution, step by step
Formulas used
- Unit price
- The unit price is what one item costs. Divide the total cost by the number of items bought. This works because every notebook costs the same, so the total splits into equal parts.
- A proportional relationship
- y is the total cost in dollars, and x is the number of notebooks. k is the price of one notebook, the number you always multiply by. A point fits only if its y is exactly k times its x. The graph is a straight line through (0, 0).
Sort out the question
Four notebooks cost $12, and each one costs the same. On the graph, x is the number of notebooks, and y is the total cost in dollars. The graph shows seven points. You must select every point that fits. The question does not say how many fit, so test all seven.
Find the price of one notebook
Split the $12 equally among the 4 notebooks:
Each notebook costs $3. So the total cost is 3 times the number of notebooks:
Test each point
For each point, multiply its x by 3. Keep the point only if the result equals its y.
Choice Point 3 × x Fits? A (1, 1) 3 No B (1, 3) 3 Yes C (2, 5) 6 No D (3, 7) 9 No E (3, 9) 9 Yes F (4, 12) 12 Yes G (5, 14) 15 No Watch for look-alike points
Watch out: the dots (1, 3), (2, 5) and (3, 7) sit in a neat straight row. But that row climbs $2 per notebook, not $3. Lining up is not enough: (2, 5) and (3, 7), choices C and D, do not fit.
Watch out: 5 notebooks cost dollars. The dot above 5 sits one gridline lower, at 14. Read the y-axis carefully, and you will skip choice G.
Name the points
Three points fit: (1, 3), (3, 9) and (4, 12). On the test, you click each of these dots on the graph. On this site, you check their boxes. So the answers are B, E and F.
Check your answer
All three points fit : , and . They also line up with (0, 0), since 0 notebooks cost $0. And (4, 12) is the fact the question gave you.
More questions like this
The original DOE question
Question 2 of 42
2026 Practice Test A Math, question 43Question
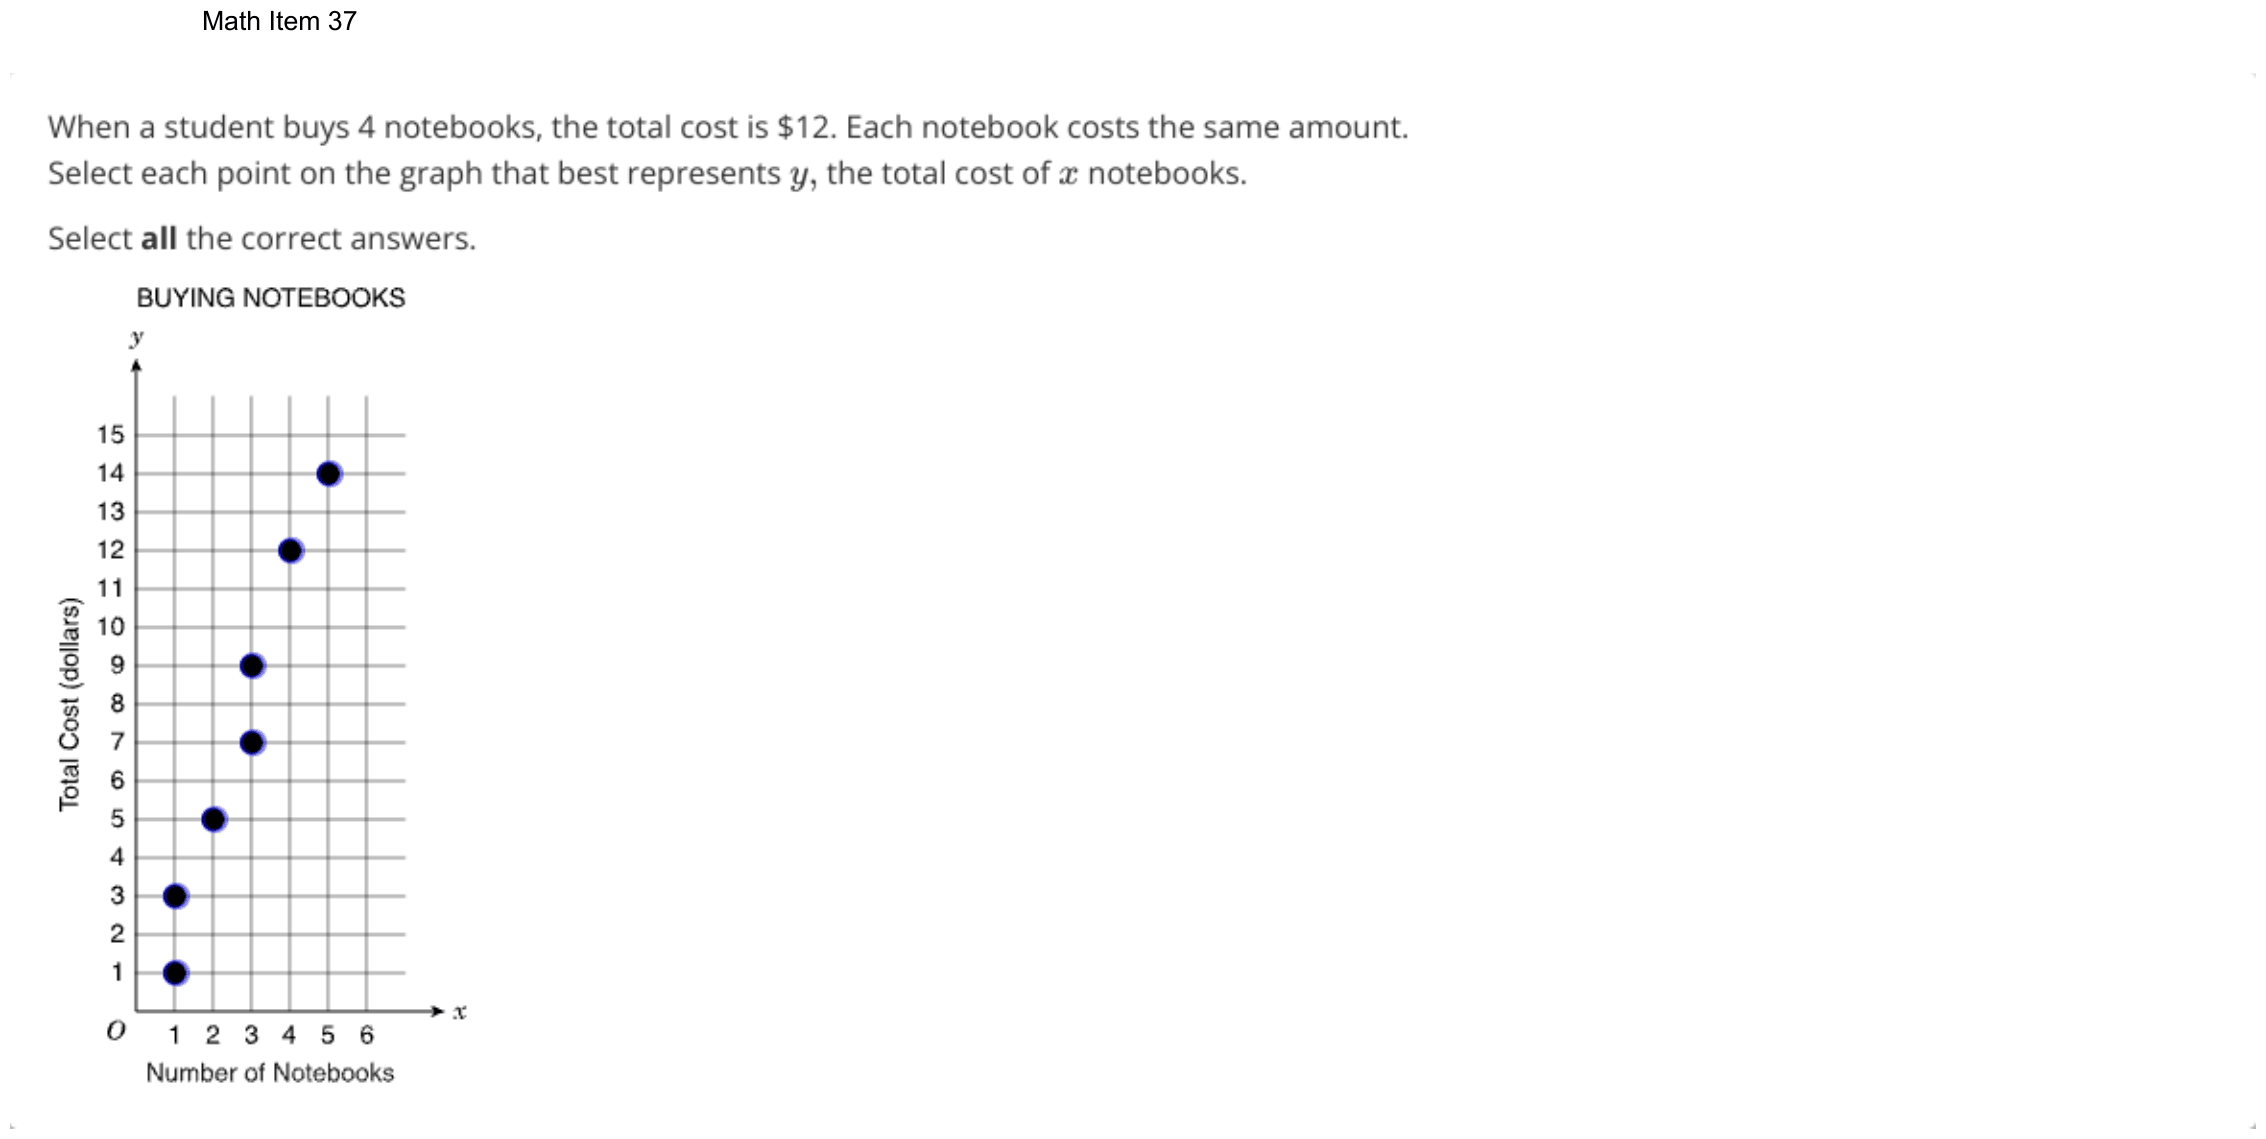
Graph the solution set for the inequality .
Select a ray. Then, move the endpoint of the ray to the correct position on the number line.
On the test you draw the ray on the number line; here, choose its endpoint, whether the endpoint is closed or open, and its direction. The DOE has not published how answers with several parts are scored; this site counts one right only when every part is right.
Show the answer
Correct answer: a ray with a closed endpoint at 1, pointing right
Solution:

Solve the inequality for x, then graph the solution on the number line:
Add 5 to both sides of the inequality:
Divide both sides by 2:
Rewrite the inequality with x on the left side:
The graph of is a closed ray (solid point) beginning at 1 and extending to the right on the number line.
Question analysis
Students graph the solution set of a two-step inequality on a number line by choosing a ray: where it starts, whether its endpoint is open or closed, and which way it points. It tests solving a linear inequality and reading its solution. The variable sits on the right of the inequality symbol, so reading the result the right way round is part of the challenge.
- Grade level
- Grade 7 content, by NYS standard
- Compared with grade 7
- At grade 7 Solving a two-step inequality and graphing its solution set is a named grade 7 skill. This one puts the variable on the right of the symbol and asks students to build the graph themselves rather than pick it from four.
- Estimated difficulty
- Moderate: several steps, or a close reading with one strong distractor.
- Thinking it demands
- Depth of knowledge 1, recall and reproduction · mainly apply
- What makes it hard
- Reading a figure, table or graph moderate
- Many steps minor
- An answer in an unexpected form minor
- Solution
- 3 steps
- Reading level
- Question and choices: about grade 6, 26 words.
- Students, last 30 days
- Not enough answers yet to show (it takes 10).
Why it is hard, traps and wrong answers (shows the answer)
Why it is hard
Solving takes two routine moves; the points are lost in turning 1 ≤ x into a picture. Because x sits on the right, the symbol seems to point left, and a student who shades the way it points draws the values below 1, which all fail. The dot must also be solid, since x = 1 makes both sides −3. Testing x = 2, where 2x − 5 = −1 and −3 ≤ −1 holds, confirms the direction.
Reading a figure, table or graph moderate Understanding the question
The solution comes out as 1 ≤ x, with x on the right, so the ≤ sign points away from the shaded side; it has to be read as x ≥ 1 before the ray is drawn. (Lesh, Post & Behr, 1987; Kirsch & Mosenthal, 1990)
Many steps minor Working it out
Two solving moves, adding 5 and then halving, come before three graph choices, the endpoint, a solid dot and a direction, and a mistake in any of the five loses the item. (Daniel & Embretson, 2010; Enright, Morley & Sheehan, 2002)
An answer in an unexpected form minor Choosing the answer
The ray is built, by picking one of four ray shapes and dragging its endpoint, rather than chosen from four finished graphs, so nothing on screen flags a ray that starts at the right number but points the wrong way. (Enright, Morley & Sheehan, 2002)
Strategy: Undo the subtraction and then the multiplication on both sides, rewrite the result with x first, decide whether the endpoint is included, and test one value on your ray in the original inequality.
Traps
- Negatives and direction: Arithmetic with negative numbers, the order of a subtraction, or direction on a number line. (Moving a term across the equals sign without changing its sign is a faulty procedure.)
- Counting the ends: Inclusive or exclusive ends, fence posts, consecutive numbers: an answer that is one too many or too few, or an endpoint drawn open where it belongs closed (or the reverse).
- A faulty procedure: A systematic but wrong procedure: adding fractions straight across, applying an exponent to each term of a sum, dropping a sign when moving a term.
The wrong answers, classified
1|closed|left Negatives and direction (Brown & Burton, 1978)
Solves to 1 ≤ x but shades the way the ≤ symbol points, a rule that holds only with x on the left, so the ray covers x ≤ 1.
1|open|right Counting the ends (Brown & Burton, 1978)
Finds the right endpoint and direction but draws an open dot, leaving out 1 itself, though the "or equal to" in ≤ includes it.
-4|closed|right A faulty procedure (Brown & Burton, 1978; Tatsuoka, 1983)
Moves the −5 to the left side without changing its sign, writing −3 − 5 = −8 ≤ 2x, so the ray starts at −4.
Worked solution, step by step
Formulas used
- Doing the same to both sides
- a and b are the two sides of an inequality, and c is any number. Adding the same number to both sides keeps the inequality true. So does dividing both sides by the same positive number. Dividing by a negative number would flip the symbol, but that does not happen here.
- Turning an inequality around
- a and b are any two numbers or terms. You may swap the two sides if you also turn the symbol around. The pointed end of the symbol always faces the smaller side. So 1 ≤ x and x ≥ 1 say the same thing.
Sort out the question
The symbol ≤ means is less than or equal to. The solution set is every value of x that makes true. You show it as a ray. A ray is a dot, called the endpoint, with an arrow going one way forever. You need three things: where the dot goes, whether it is closed or open, and which way the ray points.
Add 5 to both sides
The right side is 2x − 5. Adding 5 undoes subtracting 5, so add 5 to both sides:
Watch out: taking 5 away from −3 instead gives −8 ≤ 2x. That wrong move puts the dot at −4.
Divide both sides by 2
Now x is multiplied by 2, so divide both sides by 2. You divide by a positive number, so the symbol stays the same:
Read it with x first
says 1 is less than or equal to x. So x is 1 or any number bigger than 1. With x first, that is:
Bigger numbers are to the right on a number line, so the ray points right.
Watch out: in 1 ≤ x, the symbol seems to point left. Do not follow it. A ray pointing left from 1 shows numbers that do not work.
Choose a closed dot
The words or equal to mean 1 itself is a solution. Check it: , and −3 ≤ −3 is true. So the dot at 1 is closed, which means filled in. An open dot, an empty circle, leaves the endpoint out. Use it only for < or >.
Watch out: an open dot at 1 would leave out a number that works.
Draw the ray
On the test, choose the ray with a filled dot and an arrow pointing right. Then drag its dot to 1. On this site, choose 1 for the endpoint, then closed (filled dot) and pointing right.
So the answer is a closed dot at 1, with the ray pointing right.
Check your answer
Test a number on your ray, such as 3. , and −3 ≤ 1 is true. Now test a number off the ray, such as 0. , and −3 ≤ −5 is false. So the ray points the right way.
More questions like this
The original DOE question
Question 3 of 42
2026 Practice Test B Math, question 13Question
A basket contains 3 apples, 4 oranges, 5 bananas, and 8 pears.
If one piece of fruit is randomly pulled from the basket, what is the probability that it will be a pear?
Select the place on the number line to plot the point.
On the test you click a point on the number line; here, choose it from the menu.
Show the answer
Correct answer: the point 0.4
The total number of fruits is:
The probability of picking a pear is:
Question analysis
A basket holds apples, oranges, bananas and pears, and students find the probability that a piece of fruit pulled at random is a pear, then plot it as a point on a number line from 0 to 1. It tests simple probability as a part of a whole. With no choices to pick from, the fraction has to be turned into tenths to find its place.
- Grade level
- Grade 6 content, by NYS standard
- Compared with grade 7
- Below grade 7 Finding the probability of a simple event from counts is grade 6 work in New York. This one adds four whole numbers, forms one fraction and plots it among marked tenths, a shorter and more routine task than grade 7 probability.
- Estimated difficulty
- Routine: one familiar step, little to misread.
- Thinking it demands
- Depth of knowledge 1, recall and reproduction · mainly apply
- What makes it hard
- Solution
- 3 steps
- Reading level
- Question and choices: about grade 6, 40 words.
- Students, last 30 days
- Not enough answers yet to show (it takes 10).
Why it is hard, traps and wrong answers (shows the answer)
Why it is hard
Adding the four counts to 20 and writing 8 over 20 is routine, so most students succeed. The losses come from the number line: its decimal labels make it easy to read the 8 pears as 0.8, and a part-to-part fraction such as 8/12 falls between marks and has to be rounded, which should prompt a second look. Simplifying 8/20 to 2/5 and then to 4/10 makes the mark plain.
Something you must already know minor Working it out
The question does not say that a probability is the favorable count over the whole count, here the 8 pears over all 20 pieces of fruit rather than over the other 12. (Anderson & Krathwohl, 2001)
An answer in an unexpected form minor Choosing the answer
The number line is labeled only in tenths from 0 to 1, so 8/20 has to be rewritten as a decimal before the right mark can be chosen. (Enright, Morley & Sheehan, 2002)
Strategy: Add up all the fruit for the total, write the number of pears over that total, rewrite the fraction in tenths, and select that mark on the line.
Traps
- Answers a different question: A choice is right for another quantity: the other unknown, the rest instead of the part, the part instead of the whole.
- Misunderstands the concept: A wrong belief about a concept: that percents can be added, that area grows like length, that averages can be averaged, that a bigger denominator means a bigger fraction.
The wrong answers, classified
0.8 Numbers taken from the question (Hegarty, Mayer & Monk, 1995)
Takes the 8 pears straight to the mark labeled 0.8, never dividing by the 20 pieces of fruit in the basket.
0.7 Misunderstands the concept (Smith, diSessa & Roschelle, 1993; De Bock et al., 1998; Ni & Zhou, 2005)
Compares the 8 pears with the 12 other pieces of fruit, 8/12 or about 0.67, a part-to-part ratio, and plots the nearest tenth.
0.6 Answers a different question (King et al., 2004; Hegarty, Mayer & Monk, 1995)
Puts the 12 apples, oranges and bananas over the 20 pieces of fruit, plotting the chance of not getting a pear instead of getting one.
Worked solution, step by step
Formulas used
- Probability of an event
- P is the probability, the chance that something happens. It goes from 0 (never) to 1 (always). The top counts the results you want, here pears. The bottom counts every possible result, here every piece of fruit. It works when each result is equally likely, like grabbing fruit without looking.
- Equal fractions
- a is the top of a fraction, and b is the bottom. n is any number except 0. Dividing the top and the bottom by the same number gives an equal fraction. Use it to get 10 on the bottom, which is easy to write as a decimal.
Sort out the question
The basket has 3 apples, 4 oranges, 5 bananas and 8 pears. You pull out one piece without looking. You need the probability that it is a pear. Then you plot that number as a point. The number line runs from 0 to 1, with a mark at every tenth.
Count all the fruit
The bottom of the fraction is every piece of fruit you could pull out. Add all four kinds:
There are 20 pieces of fruit in all.
Write the probability as a fraction
Use the probability formula. There are 8 pears out of 20 pieces of fruit:
Watch out: the bottom is all the fruit, not just the other fruit. compares the pears with the 12 fruits that are not pears. It is about 0.67, and it leads you to the mark at 0.7. And 12 over 20 is the chance of not getting a pear.
Change it to tenths
The number line is marked in tenths. So rewrite the fraction with 10 on the bottom. Divide the top and the bottom by 2:
Four tenths is written 0.4.
Watch out: the 8 pears do not make 0.8. That skips dividing by the 20 pieces of fruit.
Plot the point
Start at 0 and count four marks to the right: 0.1, 0.2, 0.3, 0.4. On the test, you click the mark labeled 0.4. On this site, you choose 0.4 from the menu.
So the answer is the point at 0.4.
Check your answer
The chance of not getting a pear is . A pear and not a pear cover every result, so the two must add to 1: . Also, pears are less than half of the fruit, so the point should be left of 0.5. It is.
More questions like this
The original DOE question

Question 4 of 42
2026 Practice Test C Math, question 12Question
A spinner has 5 congruent sections labeled as shown. One side of a fair coin is heads, and the other side is tails.
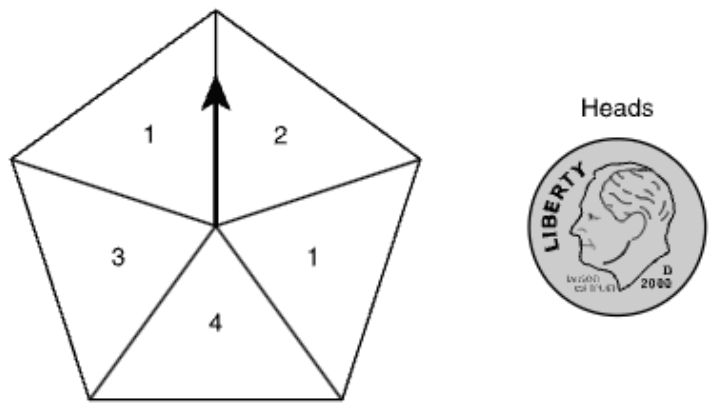
The spinner is spun one time, and the coin is flipped. What is the probability that the spinner lands on 1 and the coin lands on tails?
Select the place on the number line that represents the probability.
On the test you click a point on the number line; here, choose it from the menu.
Show the answer
Correct answer: the point 0.2
The spinner has five equal-sized sections. Two of the sections are labeled with a 1. So, the probability of landing on a 1 is two out of five, or 2/5.
A coin has two sides, one heads and one tails. So, the probability of landing on tails is one out of two, or 1/2.
The compound probability of the spinner landing on a 1 and the coin landing on tails can be calculated by multiplying 2/5 and 1/2 as shown:
Question analysis
A spinner with five equal sections is spun once and a fair coin is flipped. Students find the probability that the spinner lands on 1 and the coin shows tails, then select that point on a number line from 0 to 1. Counting the right sections and combining the two events correctly are the tricky parts.
- Grade level
- Grade 7 content, by NYS standard
- Compared with grade 7
- At grade 7 Finding the chance of two independent events together is grade 7 compound probability, here with one spinner and one coin. Counting sections from the picture and placing the result on a number line add two small steps.
- Estimated difficulty
- Moderate: several steps, or a close reading with one strong distractor.
- Thinking it demands
- Depth of knowledge 2, skills and concepts · mainly apply
- What makes it hard
- Solution
- 3 steps
- Reading level
- Question and choices: about grade 5, 59 words.
- Students, last 30 days
- Not enough answers yet to show (it takes 10).
Why it is hard, traps and wrong answers (shows the answer)
Why it is hard
The probability itself takes one multiplication of two simple fractions; the losses come before and after it. Before, the spinner has to be searched for every section labeled 1, and the coin's chance brought in as well. After, 1/5 has to be rewritten as 2/10 to find its point, since only 0, 1/2 and 1 are labeled. Checking that the result is smaller than both separate chances catches an addition.
Reading a figure, table or graph moderate Understanding the question
The two sections labeled 1, upper left and right, are not side by side, and the number line labels only 0, 1/2 and 1, so its nine points must be read as tenths. (Lesh, Post & Behr, 1987; Kirsch & Mosenthal, 1990)
Something you must already know minor Working it out
Nothing says that the chance of two independent events both happening is the product of their chances, 2/5 × 1/2, rather than their sum. (Anderson & Krathwohl, 2001)
Strategy: Count the sections labeled 1 to get the spinner's chance, take the coin's chance of tails, multiply the two because both must happen, and write the result in tenths.
Traps
- Stops one step early: A choice is a number from partway through the solution.
- Wrong operation: Adds instead of multiplying, divides the wrong way round, turns a ratio or rate upside down, or undoes a step in the wrong direction (subtracts what should be added back).
- Misreads the figure: Reads a value, label or tick spacing in a figure, table or graph wrongly.
The wrong answers, classified
0.4 Stops one step early (King et al., 2004; Gierl et al., 2017)
Finds the spinner's chance of landing on 1, two sections out of five, and plots 2/5 without multiplying by the coin's chance of tails.
0.9 Wrong operation (Hegarty, Mayer & Monk, 1995; King et al., 2004)
Adds the two chances, 2/5 + 1/2 = 9/10, instead of multiplying them, though both events must happen together.
0.1 Misreads the figure (Lesh, Post & Behr, 1987; Kirsch & Mosenthal, 1990)
Counts only one section labeled 1, so multiplies 1/5 by 1/2 and plots 1/10, missing the second 1 on the spinner.
Worked solution, step by step
Formulas used
- Probability of an event
- P is the probability, the chance that something happens. It goes from 0 (never) to 1 (always). The top counts the results you want. The bottom counts all possible results. It works when every result is equally likely, like equal sections of a spinner.
- Probability that two things both happen
- A and B are two events that do not affect each other, like a spin and a coin flip. P(A) and P(B) are their chances. Multiply them to get the chance that both happen. Needing both makes the chance smaller, never bigger.
Sort out the question
The spinner has 5 congruent sections. Congruent means the same size and shape, so each is equally likely. The coin has a heads side and a tails side. You need the chance that the spinner lands on 1 and the coin lands on tails.
Find the spinner’s chance
Two sections show 1: the upper left one and the one on the right. So 2 of the 5 equal sections give a 1:
Watch out: the two 1s are not next to each other. Counting only one gives 1/5 here, and 0.1 at the end.
Find the coin’s chance
A fair coin is equally likely to land on either side. Tails is 1 of its 2 sides:
Multiply the two chances
The spin and the flip do not affect each other, and both must happen. So multiply:
Watch out: stopping at 2/5 gives 0.4. Adding gives , or 0.9. Both are wrong.
Select the point
On the test, the number line labels only 0, 1/2 and 1. Between 0 and 1 are 9 targets, one at each tenth. 0.2 is the second target to the right of 0. On this site, choose 0.2 from the Point menu.
So the answer is the point at 0.2.
Check your answer
List every result. The spinner has 5 sections and the coin has 2 sides, so there are results, all equally likely. Just 2 of them are a 1 with tails, one for each section labeled 1. That is 2 out of 10, or 0.2.
More questions like this
The original DOE question
Question 5 of 42
2026 Practice Test C Math, question 17Question

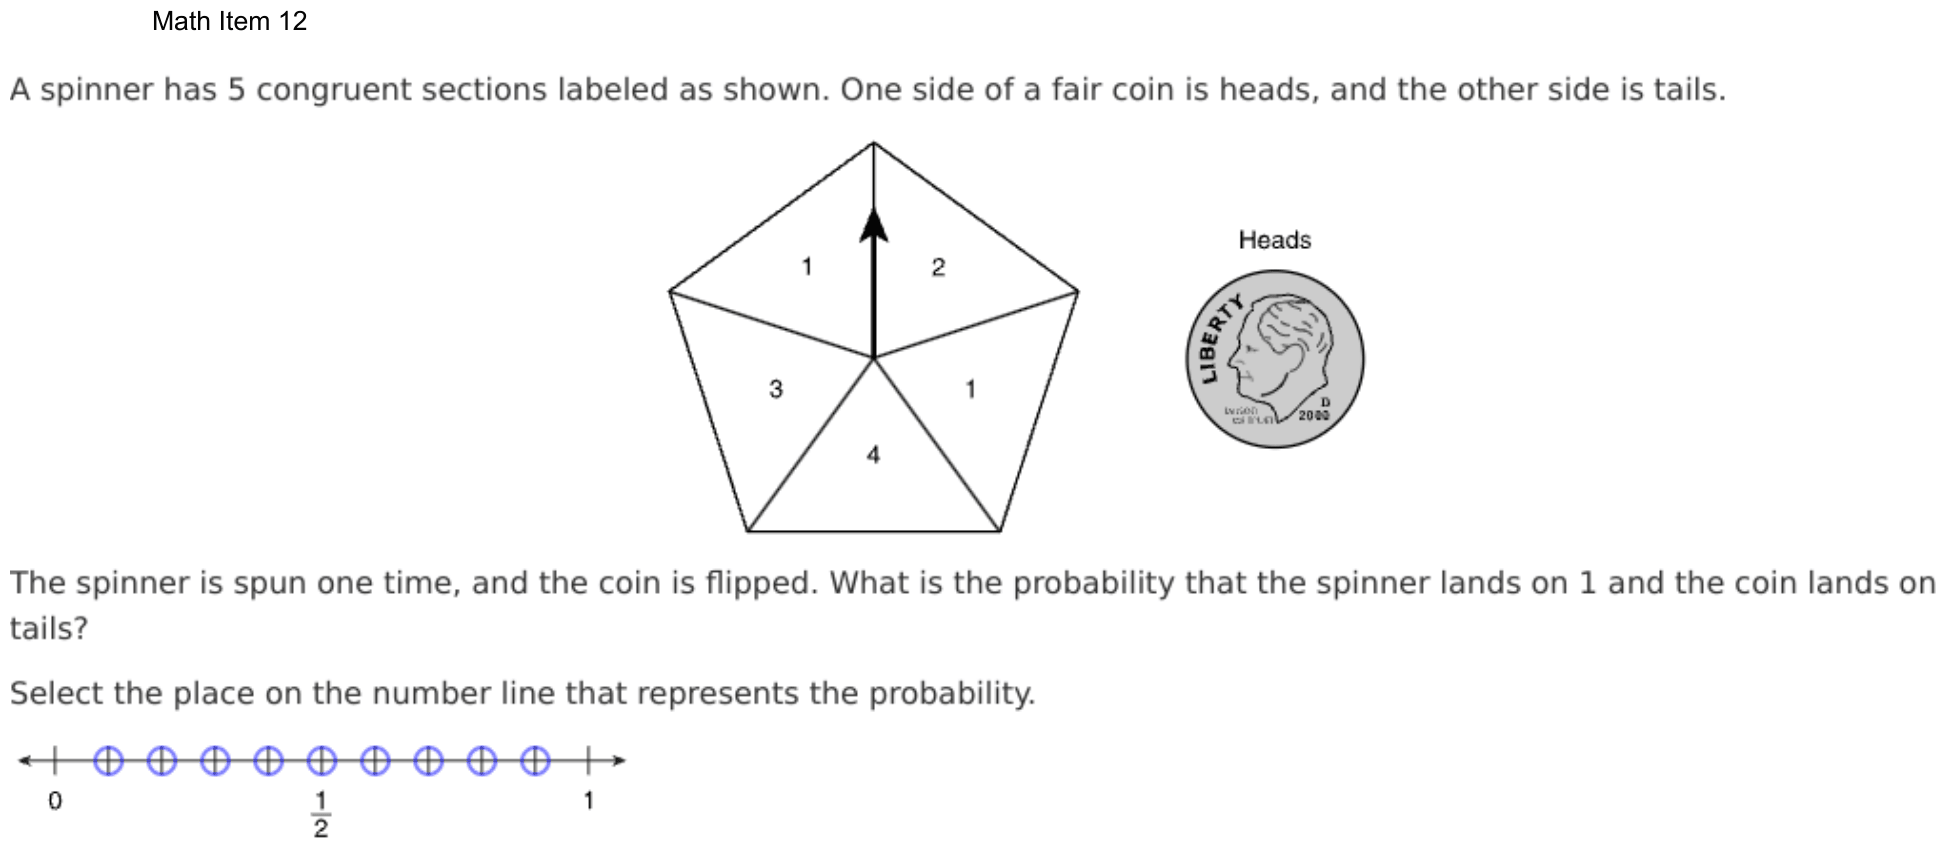
What is the distance between the midpoints of and ?
- A unit
- B1 unit
- C units
- D2 units
Show the answer
Correct answer: A
begins at 1 and ends at 7. Determine the length of :
The midpoint of a line segment is located exactly halfway between the two endpoints. Since is 6 units in length, the two endpoints are 6 units apart. Determine the location of the midpoint, in relation to each endpoint, by dividing 6 by 2:
The location of the midpoint of is 3 units from either endpoint. Find the midpoint by either adding 3 to the location of M (1) or subtracting 3 from the location of N (7):
The midpoint of is located at 4.
begins at 3 and ends at 6. Determine the length of :
Since is 3 units in length, the two endpoints are 3 units apart. Determine the location of the midpoint, in relation to each endpoint, by dividing 3 by 2:
The location of the midpoint of is 1.5 units from either endpoint. Find the midpoint by either adding 1.5 to the location of R (3) or subtracting 1.5 from the location of S (6):
The midpoint of is located at 4.5.
Determine the distance between the two midpoints by subtracting:
0.5 is equivalent to , making the distance between the two midpoints unit.
Question analysis
A number line from 0 to 8 shows points M, R, S and N, and students find the distance between the midpoint of segment MN and the midpoint of segment RS. It tests locating points and finding distances on a number line. One segment sits inside the other, and several lengths in the figure can be mistaken for the distance wanted.
- Grade level
- Grade 7 content, by NYS standard
- Compared with grade 7
- At grade 7 Finding distances between points on a number line is grade 7 work, here with whole-number positions. Two midpoints must be located before their distance can be found, so the task takes three short steps rather than one.
- Estimated difficulty
- Straightforward: two steps or one careful reading.
- Thinking it demands
- Depth of knowledge 2, skills and concepts · mainly apply
- What makes it hard
- Reading a figure, table or graph minor
- Many steps minor
- Solution
- 3 steps
- Reading level
- Question and choices: about grade 8, 17 words.
- Students, last 30 days
- Not enough answers yet to show (it takes 10).
Why it is hard, traps and wrong answers (shows the answer)
Why it is hard
The positions are whole numbers, so the midpoints come from simple averages, (1 + 7) ÷ 2 and (3 + 6) ÷ 2. The difficulty is keeping several lengths apart: the half-lengths of the two segments, the gaps at their ends, and the distance actually asked for, half a unit. Marking both midpoints on the number line before subtracting makes the small gap visible.
Reading a figure, table or graph minor Understanding the question
Segment RS lies inside MN, from 3 to 6, and its midpoint, 4 1/2, falls between two ticks of the number line rather than on a labeled point. (Lesh, Post & Behr, 1987; Kirsch & Mosenthal, 1990)
Many steps minor Working it out
Two midpoints have to be found, at 4 and 4 1/2, before their distance is taken, and the half-length of RS met on the way, 1 1/2, is among the choices. (Daniel & Embretson, 2010; Enright, Morley & Sheehan, 2002)
Strategy: Find each midpoint as the average of its segment's two endpoints, then subtract the smaller midpoint from the larger one.
Traps
- Stops one step early: A choice is a number from partway through the solution.
- Answers a different question: A choice is right for another quantity: the other unknown, the rest instead of the part, the part instead of the whole.
The wrong answers, classified
B Stops one step early (King et al., 2004; Gierl et al., 2017)
Sees that RS starts 2 units in from M and ends 1 unit in from N, and takes the difference of those gaps, 1, without halving it.
C Answers a different question (King et al., 2004; Hegarty, Mayer & Monk, 1995)
Halves each segment, 3 units for MN and 1 1/2 for RS, and subtracts the half-lengths instead of comparing the midpoints' positions.
D Answers a different question (King et al., 2004; Hegarty, Mayer & Monk, 1995)
Gives the distance from M to R, 2 units, the gap between the left ends of the two segments, without locating any midpoint.
Worked solution, step by step
Formulas used
- Midpoint on a number line
- a and b are the numbers at the two ends of a segment. The midpoint is the point exactly halfway between them. Adding the ends and dividing by 2 finds their average, which is the middle.
- Distance on a number line
- The distance between two points on a number line is how many units apart they are. Subtract the smaller number from the larger one, so the distance is never negative.
Sort out the question
The number line shows M at 1, R at 3, S at 6 and N at 7. Segment MN goes from 1 to 7. Segment RS goes from 3 to 6. A midpoint is the point exactly halfway along a segment. You need the distance between the two midpoints.
Find the midpoint of MN
Use the midpoint formula with the ends 1 and 7:
The midpoint of MN is at 4, which is 3 units from each end.
Find the midpoint of RS
Use the same formula with the ends 3 and 6:
The midpoint of RS is at 4.5. That is halfway between the marks for 4 and 5, where no point is labeled.
Subtract the two midpoints
Use the distance formula:
0.5 is one half, so the midpoints are 1/2 unit apart.
Watch out: half of MN is 3, and half of RS is 1 1/2. Subtracting those gives 1 1/2, choice C. But they are half-lengths, not positions. And 2, choice D, is only the distance from M to R.
Choose the answer
The midpoints, 4 and 4.5, are close together because RS sits near the middle of MN. So the answer is A, 1/2 unit.
Check your answer
Find each midpoint another way: walk half the length from the left end. MN is units long, and . RS is units long, and . Same midpoints, 1/2 unit apart.
More questions like this
The original DOE question
Question 6 of 42
2026 Practice Test C Math, question 26Question
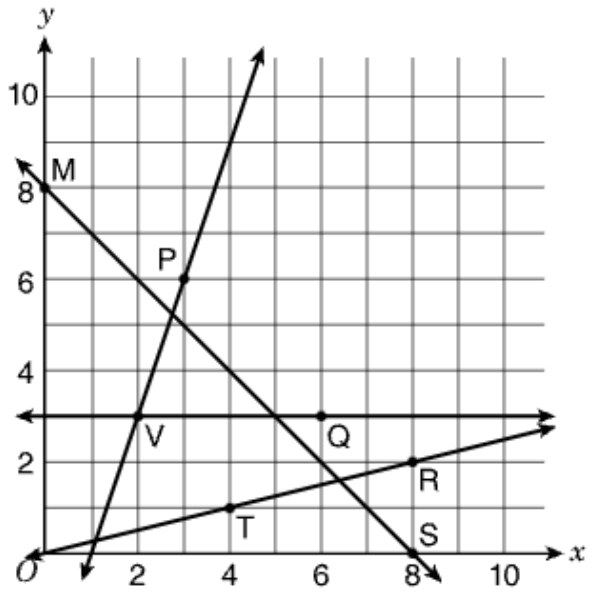
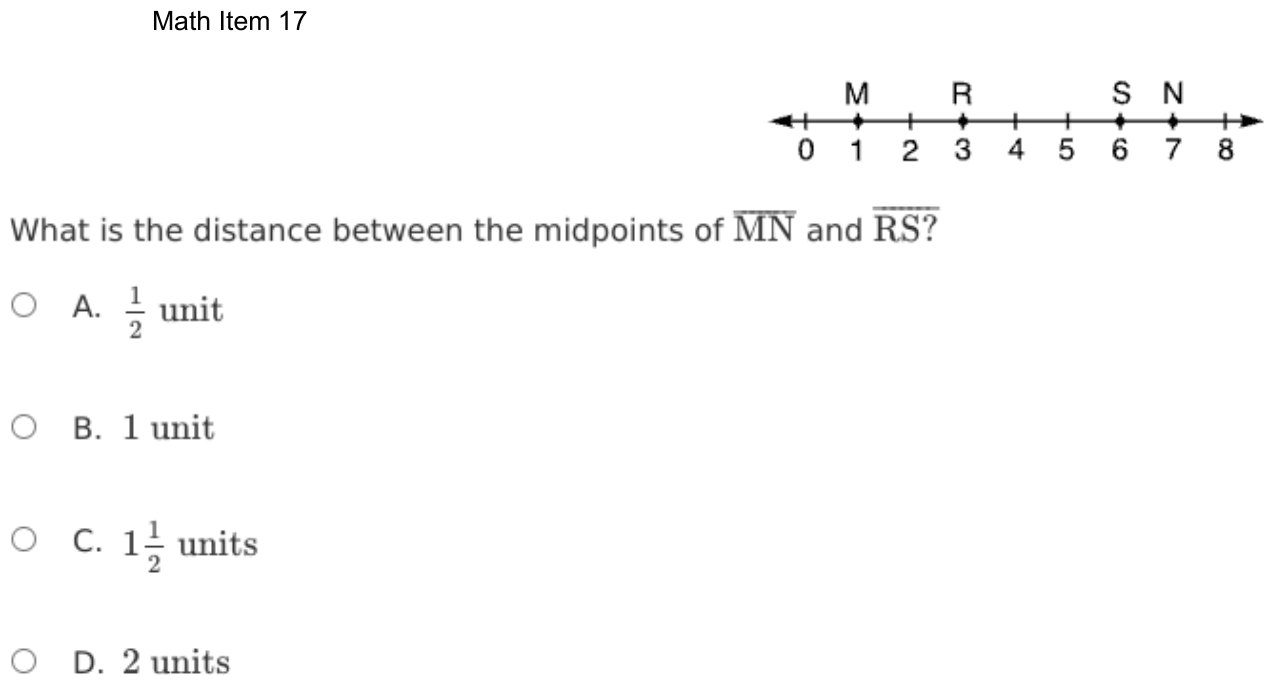
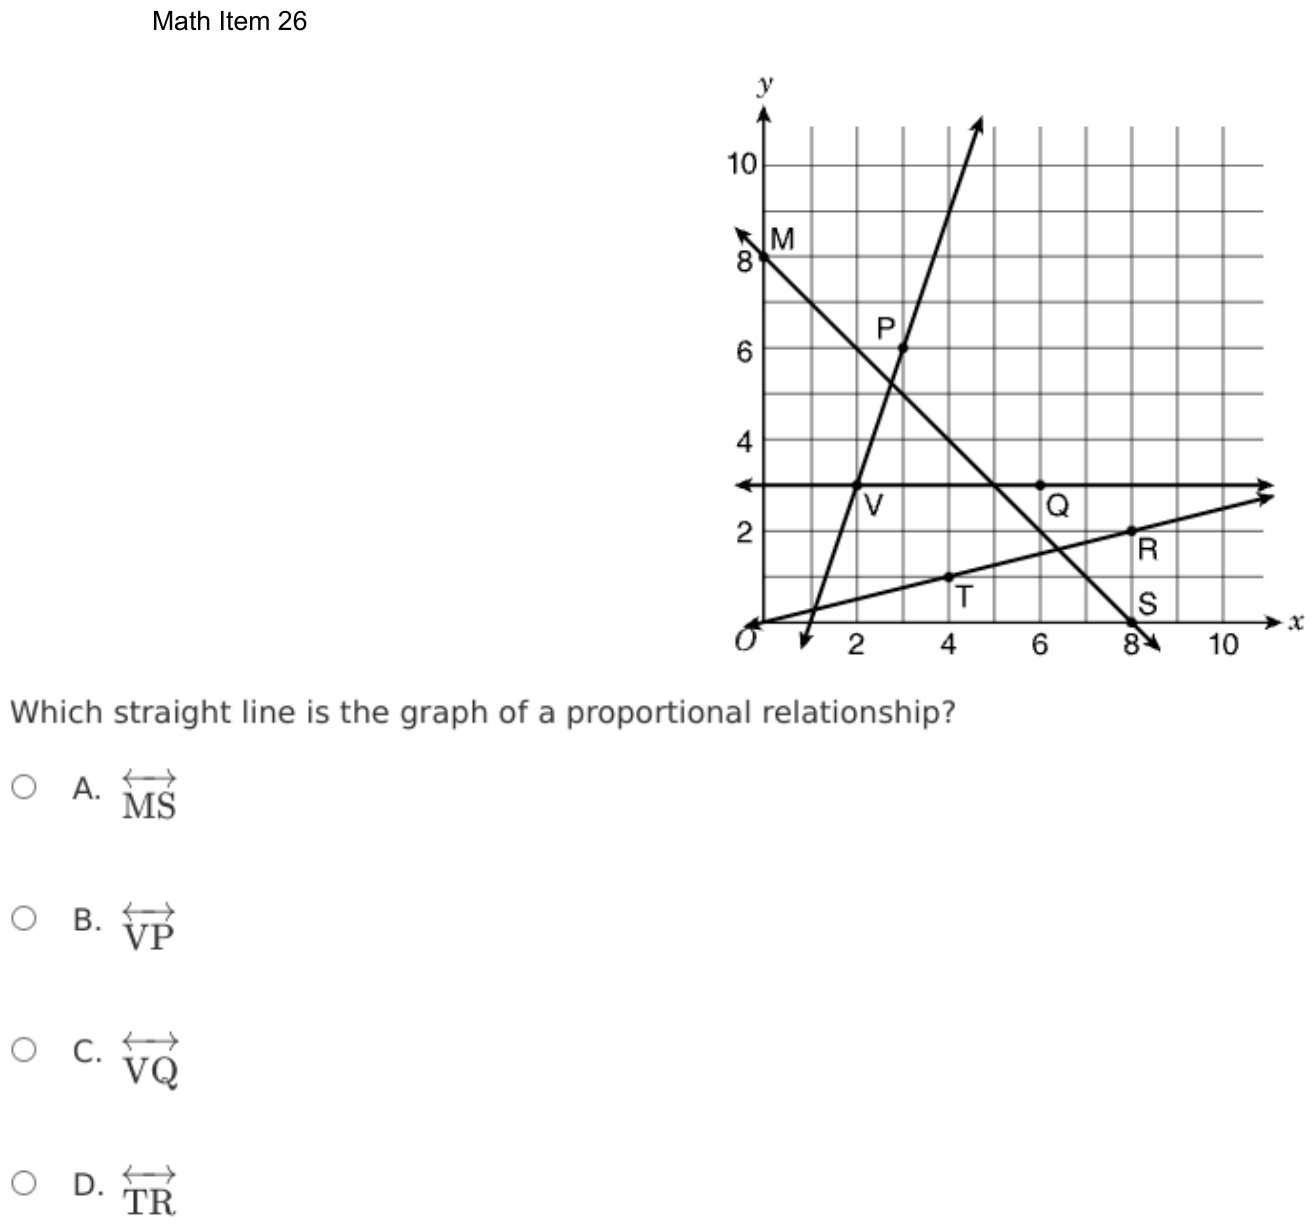
Which straight line is the graph of a proportional relationship?
- A
- B
- C
- D
Show the answer
Correct answer: D
The graph of any proportional line must intersect the origin, .
The only line on the coordinate plane that contains is .
Both point and point have a y-value that is of the x-value, and every point on the line fits the proportional equation .
When . So the line contains the origin, .
Question analysis
A coordinate grid shows four straight lines, each named by two labeled points such as M and S or V and Q, and students choose the one that is the graph of a proportional relationship. It tests recognizing proportional relationships on a graph. Every line is straight, so being straight is not enough, and the lines must be told apart by what defines proportionality.
- NYS standards
- 7.RP.2a testing for proportionality
- Grade level
- Grade 7 content, by NYS standard
- Compared with grade 7
- At grade 7 Deciding from a graph whether a relationship is proportional is a named grade 7 skill, and this is a typical case: four lines on a clean grid, each checked against the same rule, with no calculation needed.
- Estimated difficulty
- Routine: one familiar step, little to misread.
- Thinking it demands
- Depth of knowledge 1, recall and reproduction · mainly understand
- What makes it hard
- Solution
- 1 step
- Reading level
- Question and choices: about grade 9, 14 words.
- Corrected from the DOE handbook
- Coordinates and an equation in the explanation were corrected to match the graph.
- Students, last 30 days
- Not enough answers yet to show (it takes 10).
Why it is hard, traps and wrong answers (shows the answer)
Why it is hard
Once the origin rule is recalled, the graph answers the question at a glance: only the line from O through T and R starts at (0, 0). Students who think of proportional as any steady pattern have three other candidates, from the falling line through M and S to the flat line at height 3. The steep line through V and P is the closest call, because its lower end disappears near the corner where the axes meet.
Something you must already know minor Working it out
The rule that a proportional graph is a straight line through the origin is not printed, and all four lines are straight, so straightness alone rules none of them out. (Anderson & Krathwohl, 2001)
Reading a figure, table or graph minor Understanding the question
Line VP runs off the grid just right of O, crossing the x-axis at (1, 0), so whether it passes through the origin has to be read from the gridlines, not from its general direction. (Lesh, Post & Behr, 1987; Kirsch & Mosenthal, 1990)
Strategy: Recall what every proportional graph must look like, then test each line: see where it would be when x is 0, and whether y divided by x stays the same at both labeled points.
Traps
- Misunderstands the concept: A wrong belief about a concept: that percents can be added, that area grows like length, that averages can be averaged, that a bigger denominator means a bigger fraction.
- Misreads the figure: Reads a value, label or tick spacing in a figure, table or graph wrongly.
The wrong answers, classified
A Misunderstands the concept (Smith, diSessa & Roschelle, 1993; De Bock et al., 1998; Ni & Zhou, 2005)
Takes MS as proportional because it is straight and meets both axes, though it starts at (0, 8) and its y-values fall as x rises.
B Misreads the figure (Lesh, Post & Behr, 1987; Kirsch & Mosenthal, 1990)
Sees the steep line’s lower end vanish near O and assumes it passes through the origin, though VP crosses the x-axis at (1, 0).
C Misunderstands the concept (Smith, diSessa & Roschelle, 1993; De Bock et al., 1998; Ni & Zhou, 2005)
Mistakes the steady y-value of 3 along VQ for a constant of proportionality, though y ÷ x falls from 3/2 at V to 1/2 at Q.
What was corrected from the DOE handbook, and why
- Explanation: The DOE’s explanation says “Both point T (1, 4) and point R (2, 8) have a y-value that is 4 times the x-value, and every point on the line fits the proportional equation y = 4x”, and then “When x = 0, y = 4(0).” On the graph, T is at (4, 1) and R at (8, 2): each y-value is 1/4 of its x-value, and the line through the origin, T and R is y = (1/4)x. (The line y = 4x would pass through (1, 4) and (2, 8), which are not marked.) The 2022–23 guide, which first printed this question with the same graph, has the same slip. The site now gives T (4, 1) and R (8, 2), “a y-value that is 1/4 of the x-value”, y = (1/4)x, and y = (1/4)(0) at x = 0. The answer is unchanged: TR is still the only line through the origin.
Worked solution, step by step
Formulas used
- Proportional relationship
- y and x are two amounts that change together. k is the constant of proportionality: the number you always multiply x by to get y. When x is 0, y is k times 0, which is 0. So the graph is a straight line through the origin, the point (0, 0) where the axes meet.
Sort out the question
The grid shows four straight lines. Each one is named by two labeled points on it: line MS, line VP, line VQ and line TR.
You need the line that shows a proportional relationship. In that kind of relationship, y is always the same number times x. For example, y might always be 3 times x.
Recall what a proportional graph looks like
Use the rule . Put in 0 for x:
So every proportional graph goes through the origin. That is the corner point (0, 0), labeled O, where the two axes meet. The graph must also be a straight line.
All four lines here are straight. So being straight does not settle it. Look for the line through O.
Check where each line starts
- Line MS meets the y-axis at M (0, 8). When x is 0, y is 8, not 0.
- Line VP is steep. Its lower end crosses the x-axis at (1, 0), one unit to the right of O.
- Line VQ is flat at a height of 3. It never comes down to 0.
- Line TR starts at O and runs up through T and R.
Watch out: the lower end of line VP looks close to O. Follow it along the grid lines. It misses O by one unit, so choice B is wrong.
Test the ratio on line TR
In a proportional relationship, the ratio y ÷ x is the same at every point. T is at (4, 1) and R is at (8, 2):
Both give . So each y-value is of its x-value, and the line is .
Watch out: line VQ keeps the same y-value, 3, but not the same ratio. At V it is , and at Q it is . So choice C is wrong.
Give the answer
Line MS starts at 8 on the y-axis, so choice A is out too. Only line TR goes through the origin and keeps y ÷ x the same.
So the answer is D, line TR.
Check your answer
Put the origin into the rule for line TR: . So (0, 0) is on the line. Then test R: , which matches R (8, 2). The rule fits every labeled point on the line.
More questions like this
The original DOE question
Question 7 of 42
2026 Practice Test C Math, question 27Question
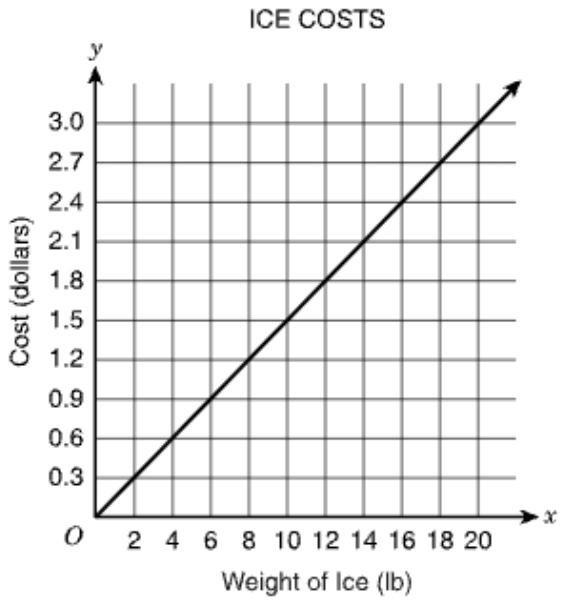
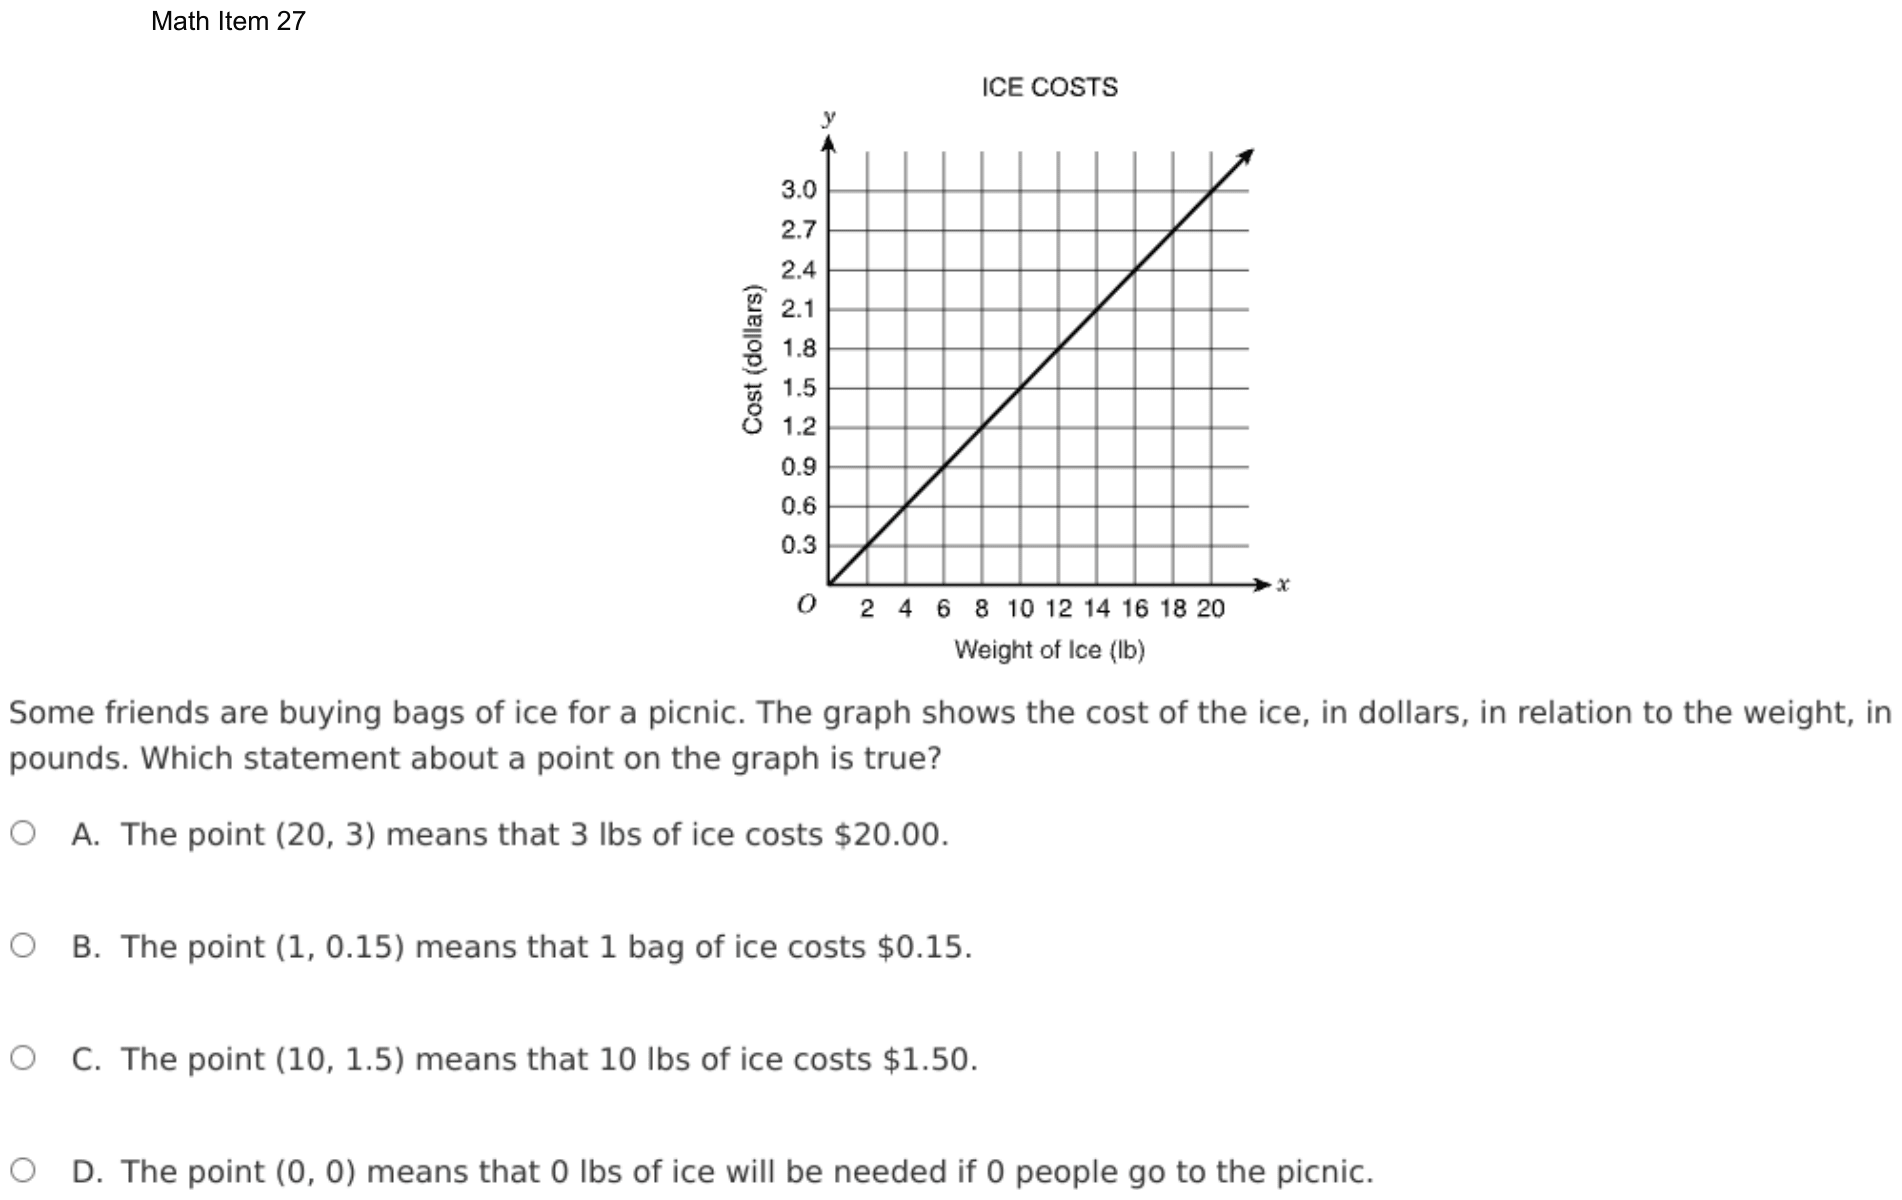
Some friends are buying bags of ice for a picnic. The graph shows the cost of the ice, in dollars, in relation to the weight, in pounds. Which statement about a point on the graph is true?
- AThe point (20, 3) means that 3 lbs of ice costs $20.00.
- BThe point (1, 0.15) means that 1 bag of ice costs $0.15.
- CThe point (10, 1.5) means that 10 lbs of ice costs $1.50.
- DThe point (0, 0) means that 0 lbs of ice will be needed if 0 people go to the picnic.
Show the answer
Correct answer: C
The x-axis represents the weight, in pounds (lbs), of ice purchased, and the y-axis represents the cost of the ice, in dollars.
The x-value in the point (10, 1.5) represents 10 lbs of ice, and the y-value represents 1.5 dollars, or $1.50. Therefore, the cost of 10 lbs of ice is $1.50.
Question analysis
Some friends buying ice for a picnic use a graph of the ice's cost in dollars against its weight in pounds, a straight line from the origin. Students pick the statement that correctly explains what a point on the graph means. Each statement names a point that really is on the line, so the units and the order of the coordinates decide.
- Grade level
- Grade 7 content, by NYS standard
- Compared with grade 7
- At grade 7 Explaining what a point on a proportional graph means in its situation is a named grade 7 skill. The graph is clear and starts at the origin, but each statement has to be read closely against the axis labels.
- Estimated difficulty
- Straightforward: two steps or one careful reading.
- Thinking it demands
- Depth of knowledge 2, skills and concepts · mainly understand
- What makes it hard
- Reading a figure, table or graph moderate
- Every choice must be checked minor
- Solution
- 2 steps
- Reading level
- Question and choices: about grade 2, 77 words.
- Students, last 30 days
- Not enough answers yet to show (it takes 10).
Why it is hard, traps and wrong answers (shows the answer)
Why it is hard
Nothing needs computing, but each statement attaches words to two numbers, and three of them attach the wrong words. The point (1, 0.15) is the unit rate students are trained to look for, and the “bags” in the stem’s story make its statement sound right, though the graph measures pounds. Saying each point aloud as so many pounds for so many dollars exposes the swapped coordinates and the extra people as well.
Reading a figure, table or graph moderate Understanding the question
Each statement must be checked against the axis labels: x is the weight of ice in pounds and y the cost in dollars, on a grid ruled every 2 pounds and every $0.30. (Lesh, Post & Behr, 1987; Kirsch & Mosenthal, 1990)
Every choice must be checked minor Choosing the answer
All four statements name a point that really lies on the line, (1, 0.15) included, so being on the graph rules nothing out; only the meaning given to each coordinate does. (Embretson & Wetzel, 1987)
Strategy: Read both axis labels and their units first, then for each choice say in words what its x-coordinate and its y-coordinate stand for, and compare that with the statement.
Traps
- Misreads the figure: Reads a value, label or tick spacing in a figure, table or graph wrongly.
- Units or scale: The answer is wanted in other units, or a rate or scale must be converted first.
- Misunderstands the concept: A wrong belief about a concept: that percents can be added, that area grows like length, that averages can be averaged, that a bigger denominator means a bigger fraction.
The wrong answers, classified
A Misreads the figure (Lesh, Post & Behr, 1987; Kirsch & Mosenthal, 1990)
Reads the point (20, 3) backward, taking 20 as the price and 3 as the weight, though x counts pounds of ice and y counts dollars.
B Units or scale (King et al., 2004)
Confirms that (1, 0.15) is on the line, the cost of 1 pound, but accepts “1 bag” because the friends buy bags, though the x-axis measures pounds.
D Misunderstands the concept (Smith, diSessa & Roschelle, 1993; De Bock et al., 1998; Ni & Zhou, 2005)
Knows (0, 0) is on every proportional graph and accepts a true-sounding story about people, though the graph never counts people; the point means 0 pounds cost $0.
Worked solution, step by step
Formulas used
- Unit rate
- The cost is in dollars, and the weight is in pounds. The unit rate is the cost of just 1 pound. On a straight line through the origin, it is the same at every point. So you can find it from any point you can read.
Sort out the question
The graph is called ICE COSTS. Read both axes first:
- The x-axis, across the bottom, is the weight of the ice in pounds (lb).
- The y-axis, up the side, is the cost in dollars.
A point is written (x, y), weight first and cost second. So a point means: x pounds of ice cost y dollars. You need the statement that says this correctly.
Find the cost of one pound
The line reaches $3.00 at 20 pounds. Use the unit rate formula:
So 1 pound of ice costs $0.15. This helps you test each point.
Test the point in choice C
Find 10 on the weight axis and go straight up to the line. The line crosses there at 1.5 on the cost axis. The unit rate agrees:
So the point (10, 1.5) means 10 pounds of ice cost $1.50. That is exactly what choice C says.
Check the other statements
Each one names a real point on the line. The problem is the meaning it gives the numbers.
Watch out: choice A reads (20, 3) backward. It means 20 pounds cost $3, not 3 pounds cost $20.
Watch out: choice B is tricky. The point (1, 0.15) is on the line, but the x-axis counts pounds, not bags. So it means 1 pound costs $0.15.
Choice D talks about people, but the graph never counts people. The point (0, 0) means 0 pounds cost $0.
Give the answer
Only choice C gives the right meaning to both numbers.
So the answer is C, 10 lbs of ice costs $1.50.
Check your answer
Use halves. The point (20, 3) says 20 pounds cost $3.00. Half as much ice, 10 pounds, should cost half as much. Half of $3.00 is $1.50. That matches choice C.
More questions like this
The original DOE question
Question 8 of 42
2026 Practice Test C Math, question 32Question
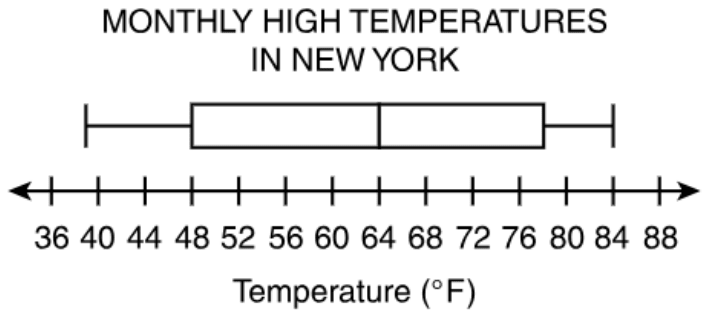
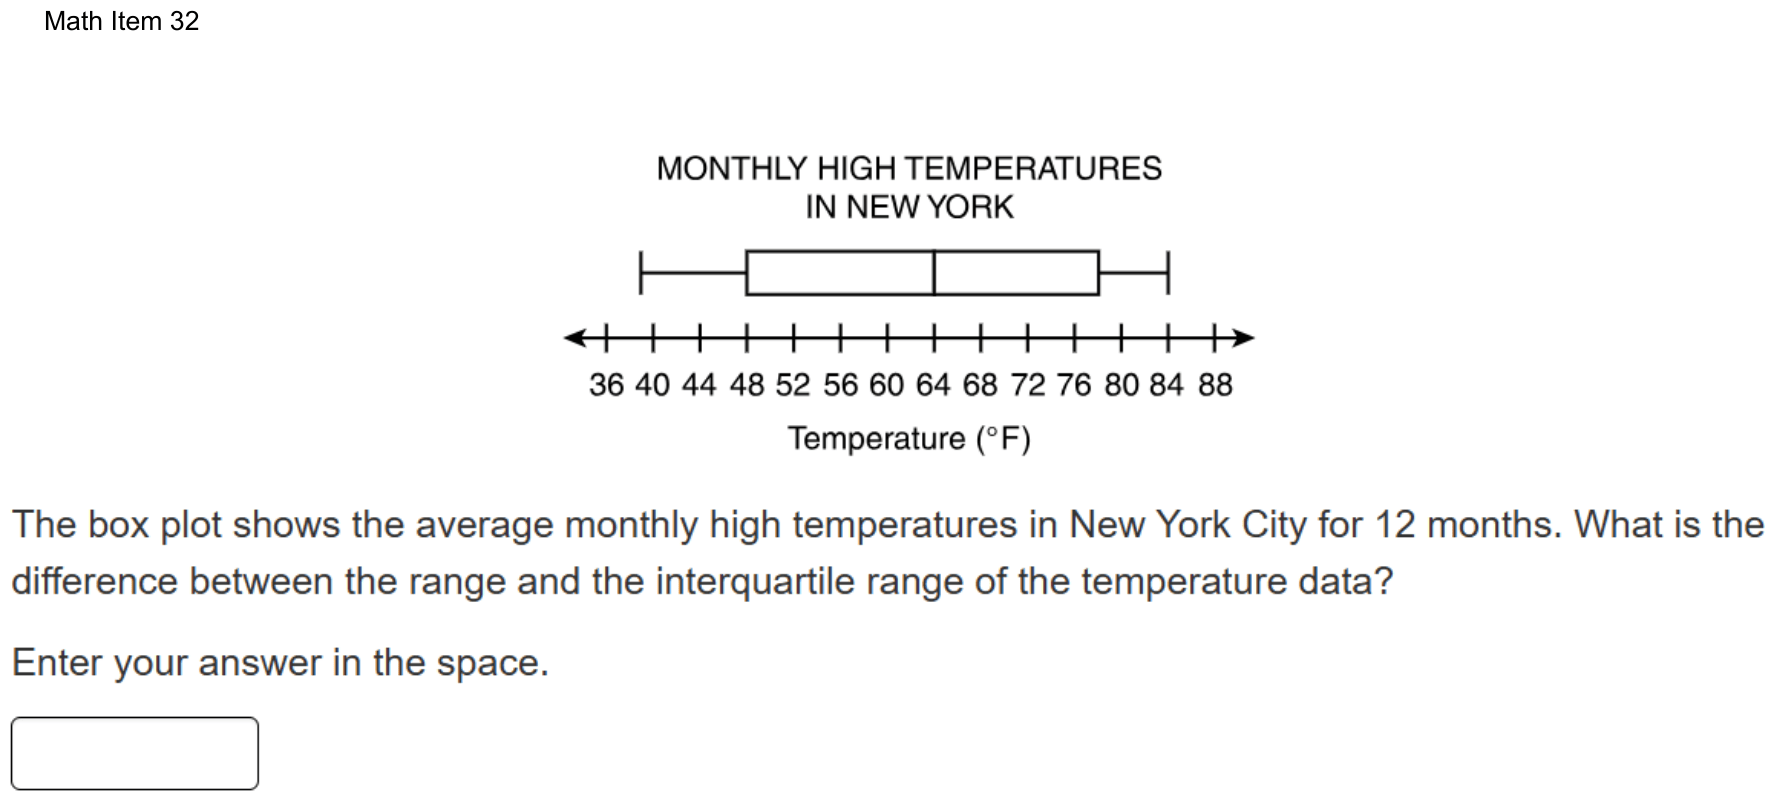
The box plot shows the average monthly high temperatures in New York City for 12 months. What is the difference between the range and the interquartile range of the temperature data?
Enter your answer in the space.
Fill-in question: work out the answer and type it as a number.
Show the answer
Correct answer: 15
Determine the range by subtracting the minimum value on the box plot from the maximum value on the box plot:
Maximum value , Minimum value
Determine the interquartile range by subtracting the lower quartile value on the box plot from the upper quartile value on the box plot:
Upper Quartile Value , Lower Quartile Value
Determine the difference between the range (45° F) and the interquartile range (30° F):
Question analysis
A box plot of New York City's average monthly high temperatures for 12 months sits above a number line labeled every 4 degrees. Students type the difference between the range and the interquartile range of the data. Two of the plot's values fall between labeled ticks, so careful reading of the scale decides the answer.
- Grade level
- Grade 7 content, by NYS standard
- Compared with grade 7
- Above grade 7 Reading a box plot and finding its interquartile range are grade 7 skills. Here two of the five values fall between ticks spaced 4 apart, and the range, the IQR and their difference must all be found and typed with no choices.
- Estimated difficulty
- Hard: combines ideas, needs a plan, and has more than one tempting wrong answer.
- Thinking it demands
- Depth of knowledge 2, skills and concepts · mainly apply
- What makes it hard
- Solution
- 3 steps
- Reading level
- Question and choices: about grade 7, 36 words.
- Students, last 30 days
- Not enough answers yet to show (it takes 10).
Why it is hard, traps and wrong answers (shows the answer)
Why it is hard
The method is standard, but the key rests on reading the scale between its labels. The axis is ticked only every 4 degrees, and the minimum and the upper quartile land off the ticks, so rounding either one to the nearest label moves the result by a degree or two with nothing to flag it. Students who find the range correctly can also stop there, entering 45, the larger of the two spreads, instead of the difference the question asks for.
Reading a figure, table or graph major Understanding the question
Two of the five values fall between ticks spaced 4 degrees apart: the left whisker ends just short of the 40 tick, at 39, and the box’s right edge sits midway between 76 and 80, at 78. (Lesh, Post & Behr, 1987; Kirsch & Mosenthal, 1990)
Many steps minor Working it out
Four values are read and combined in three subtractions, the range, the interquartile range and then their difference, so one misread value changes the final entry. (Daniel & Embretson, 2010; Enright, Morley & Sheehan, 2002)
Something you must already know minor Working it out
Neither measure is defined on the page: the range spans the whiskers, and the interquartile range is the width of the box, the upper quartile minus the lower. (Anderson & Krathwohl, 2001)
An answer in an unexpected form minor Choosing the answer
The result is typed with no choices to compare, so an entry one or two degrees off, from rounding a value to the nearest tick, looks just as finished as the right one. (Enright, Morley & Sheehan, 2002)
Strategy: Read the minimum, both quartiles and the maximum, judging where each mark falls between the ticks, then subtract for the range and for the IQR, and subtract those two results.
Traps
- Misreads the figure: Reads a value, label or tick spacing in a figure, table or graph wrongly.
- Stops one step early: A choice is a number from partway through the solution.
The wrong answers, classified
14 Misreads the figure (Lesh, Post & Behr, 1987; Kirsch & Mosenthal, 1990)
Reads the left whisker’s end as 40, the nearest labeled tick, instead of 39, so the range becomes 84 − 40 = 44 and 44 − 30 = 14.
45 Stops one step early (King et al., 2004; Gierl et al., 2017)
Finds the range, 84 − 39 = 45 degrees, and enters it, stopping before the interquartile range of 30 is subtracted from it.
17 Misreads the figure (Lesh, Post & Behr, 1987; Kirsch & Mosenthal, 1990)
Reads the box’s right edge as 76, the tick just left of it, instead of 78, so the IQR becomes 76 − 48 = 28 and 45 − 28 = 17.
Worked solution, step by step
Formulas used
- Range
- The maximum is the greatest value, at the right end of the right whisker. The minimum is the least value, at the left end of the left whisker. The range tells how far the whole set of data spreads.
- Interquartile range (IQR)
- Q3 is the upper quartile, the right edge of the box. Q1 is the lower quartile, the left edge of the box. The IQR is the width of the box. It tells how far the middle half of the data spreads.
Sort out the question
A box plot shows data with five numbers. The two whiskers are the lines on each side of the box. Their ends are the minimum, the least value, and the maximum, the greatest. The box runs from the lower quartile to the upper quartile. These are the middles of the lower half and the upper half of the data. The line inside the box is the median, the middle value.
You need the range minus the interquartile range (IQR), in degrees.
Read the values between the ticks
The ticks on the number line are 4 degrees apart. So each degree is one quarter of the space between two ticks. Three values sit right on ticks: the box’s left edge at 48, the median at 64, and the right whisker’s end at 84.
- The left whisker starts just left of the 40 tick. It sits about one quarter of the way back toward 36. So the minimum is degrees.
- The box’s right edge is halfway between 76 and 80. Halfway is 78 degrees.
Find the range
Use the range formula:
The data spread over 45 degrees.
Watch out: rounding the minimum to the 40 tick gives a range of 44. Then the final answer comes out 14, which is wrong.
Find the IQR
Use the IQR formula with the two edges of the box:
The middle half of the data spreads over 30 degrees.
Watch out: reading the box’s right edge as 76 gives an IQR of 28. Then the final answer comes out 17.
Subtract the IQR from the range
The question asks for the difference between the two:
Watch out: 45 is only the range. Do not stop there. Type only the number, with no degree sign.
So you would enter 15.
Check your answer
The range covers the whole plot, and the IQR covers only the box. So their difference is the two whiskers added together. The left whisker is degrees long. The right whisker is degrees long. , which matches.
More questions like this
The original DOE question
Question 9 of 42
2026 Practice Test C Math, question 49Question
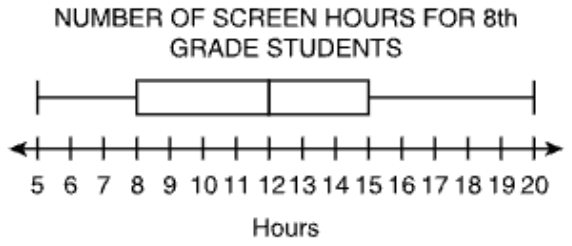
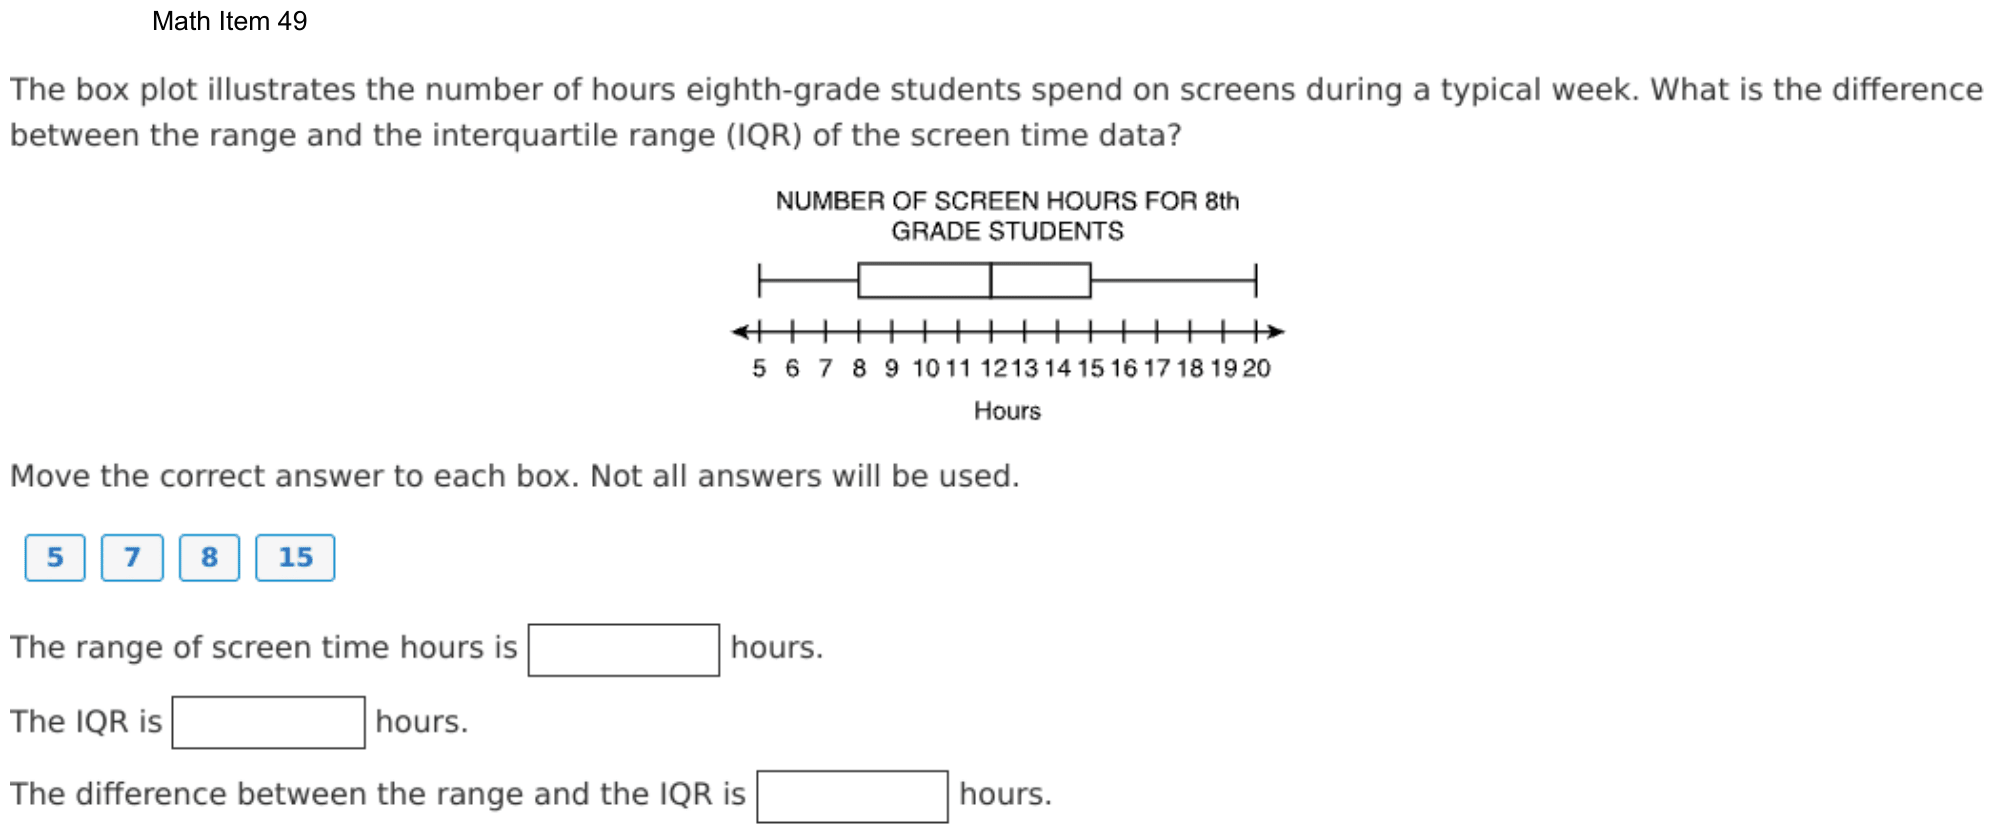
The box plot illustrates the number of hours eighth-grade students spend on screens during a typical week. What is the difference between the range and the interquartile range (IQR) of the screen time data?
Move the correct answer to each box. Not all answers will be used.
The range of screen time hours is hours.
The IQR is hours.
The difference between the range and the IQR is hours.
On the test you drag tiles into the boxes; here, choose each box’s tile from its menu. Each tile can be used once. The DOE has not published how answers with several parts are scored; this site counts one right only when every part is right.
Show the answer
Correct answer: blank 1: 15; blank 2: 7; blank 3: 8
Determine the range by subtracting the minimum value on the box plot from the maximum value on the box plot:
Maximum value , Minimum value
Determine the interquartile range by subtracting the lower quartile value on the box plot from the upper quartile value on the box plot:
Upper Quartile Value , Lower Quartile Value
Determine the difference between the range (15 hr) and the interquartile range (7 hr):
Question analysis
A box plot shows how many hours a week eighth-grade students spend on screens, on a number line marked every hour. Students move number tiles to complete three sentences: the range, the interquartile range, and the difference between them. Each tile can be used only once, and keeping the range and the interquartile range apart is the tricky part.
- Grade level
- Grade 7 content, by NYS standard
- Compared with grade 7
- At grade 7 Reading a box plot and finding its range and interquartile range are grade 7 statistics skills. The values sit on labeled whole-number ticks and the three sentences lead through the steps, a typical grade 7 task.
- Estimated difficulty
- Straightforward: two steps or one careful reading.
- Thinking it demands
- Depth of knowledge 2, skills and concepts · mainly apply
- What makes it hard
- Something you must already know minor
- Many steps minor
- Solution
- 3 steps
- Reading level
- Question and choices: about grade 4, 69 words.
- Corrected from the DOE handbook
- A missing comma in the explanation was restored.
- Students, last 30 days
- Not enough answers yet to show (it takes 10).
Why it is hard, traps and wrong answers (shows the answer)
Why it is hard
The plot is drawn on whole-hour ticks, and the three sentences lay out the steps, so this is a direct check of two definitions. The main risk is taking a value off the plot, such as the lower quartile of 8, for a spread between two values. Because the four tiles allow only one use each, a student who confuses the measures can still fill every box, which hides the error.
Something you must already know minor Working it out
The sentences name the range and the IQR but never define them; students must know the range spans the whiskers and the IQR spans only the box. (Anderson & Krathwohl, 2001)
Many steps minor Working it out
Three boxes must all be right, the third depends on the first two, and each tile can be used once, so one mix-up spreads to a second box. (Daniel & Embretson, 2010; Enright, Morley & Sheehan, 2002)
Strategy: Read the five key values off the plot, subtract the least from the greatest for the range, subtract the lower quartile from the upper for the IQR, then subtract those results.
Traps
- Misunderstands the concept: A wrong belief about a concept: that percents can be added, that area grows like length, that averages can be averaged, that a bigger denominator means a bigger fraction.
- Wrong formula: Uses a related but wrong formula: perimeter for area, diameter for radius, area for volume, or a misremembered one.
The wrong answers, classified
DCB Misunderstands the concept (Smith, diSessa & Roschelle, 1993; De Bock et al., 1998; Ni & Zhou, 2005)
Takes the lower quartile, 8, as the interquartile range, reading a value off the box instead of its width, so the difference becomes 15 − 8 = 7.
BDC Wrong formula (King et al., 2004)
Swaps the two measures, giving the box’s width, 7, as the range and the whiskers’ spread, 15, as the IQR, while the difference stays 8.
What was corrected from the DOE handbook, and why
- Explanation: The DOE’s explanation runs two values together: “Maximum value = 20 hr Minimum value = 5 hr”. Its next line is “Upper Quartile Value = 15 hr, Lower Quartile Value = 8 hr”, and Question 32’s explanation has “Maximum value = 84° F, Minimum value = 39° F”. The site adds the comma.
Worked solution, step by step
Formulas used
- Range
- The maximum is the greatest value, at the right end of the right whisker. The minimum is the least value, at the left end of the left whisker. The range tells how far the whole set of data spreads.
- Interquartile range (IQR)
- Q3 is the upper quartile, the right edge of the box. Q1 is the lower quartile, the left edge of the box. The IQR is the width of the box. It tells how far the middle half of the data spreads.
Sort out the question
The box plot shows the hours of screen time for eighth graders in a week. You need three numbers: the range, the IQR, and the difference between them.
There are four tiles: 5, 7, 8 and 15. Each tile is used at most once, and one tile is left over.
Read the five values
The number line has a tick at every hour, and every value sits on a tick:
- The left whisker starts at 5. This is the minimum.
- The box starts at 8. This is the lower quartile, the middle of the lower half of the data.
- The line inside the box is at 12. This is the median, the middle value.
- The box ends at 15. This is the upper quartile, the middle of the upper half.
- The right whisker ends at 20. This is the maximum.
Find the range
Use the range formula with the two ends of the whiskers:
The screen times spread over 15 hours, from the least to the most.
Find the IQR
Use the IQR formula with the two edges of the box:
The middle half of the students spend between 8 and 15 hours, a spread of 7 hours.
Watch out: the IQR is a width, not a point on the plot. The tile 8 is the lower quartile. Putting it in the IQR box also makes the last box 7, which is wrong.
Find the difference
Subtract the IQR from the range:
Watch out: do not swap the two measures. The range uses the whiskers’ ends, and the IQR uses only the box.
Fill in the three boxes
On the test, you drag a tile into each box. On this site, you choose each tile from its box’s menu. The range box gets 15, the IQR box gets 7, and the difference box gets 8. The tile 5 is not used.
So the boxes get 15, 7 and 8.
Check your answer
The difference is just the two whiskers added together. The left whisker is hours long. The right whisker is hours long. , which matches the third box.
More questions like this
The original DOE question
Question 10 of 42
2024 Test A English, question 57Passage Excerpt from “It’s Time to Stop Thinking That All Non-Native Species Are Evil”
Excerpt from “It’s Time to Stop Thinking That All Non-Native Species Are Evil”
by Emma Marris
The author of this opinion article attended a symposium, or conference, in Missoula, Montana, at which biologists and other scientists discussed species of plants and animals that are not native to the areas in which they live.
Invasive species are scary. It was ecologist Charles Elton, back in the 1950s, who introduced the militaristic “invasion” metaphor to describe exotic plants and animals—but there’s no question some can be extremely destructive.
The brown tree snake has eaten a dozen kinds of forest birds in Guam to extinction; zebra mussels clog pipes around the Great Lakes; the common house cat turns out to be, in Australia, a mercilessly effective killer of cute, fluffy marsupials like the bilby and the numbat.
As scientists have sounded the alarm about these pests, the public has gotten the message. Citizen groups rip out non-native plants. Native gardens have become increasingly popular, both as ways to celebrate the unique flora of each region and as tiny hot spots of diversity. Native trees provide food for native bugs, which feed native birds. Food chains developed over thousands of years of co-evolution unfold in our backyards. . . .
So we’ve learned, scientists and laypeople alike, that native species are good and non-natives are bad.
Julian Olden, a biologist at the University of Washington, Seattle, who co-organized the symposium, recently polled nearly 2,000 ecologists. Among his findings: a substantial number of them said they would immediately eradicate a hypothetical non-native forest plant, even if it were shown to have no effect on the forest. Olden calls this the “guilty even when proven innocent” approach.
That kind of approach is not very useful on a rapidly changing planet.
Exotics Are Everywhere
Climate change is making it harder even to decide who the invaders are.
How, scientists at the symposium wondered, do you define “native” on a warming planet, when plants and animals are already moving toward the poles or up mountainsides in search of climate conditions they can tolerate? Should we consider them “invasive” in their new homes? Regardless of what we label them, conservationists will be reluctant to remove them from their new environs—to do so would stymie1 their chances of adapting to the warmer future we’re creating.
And then there are the non-natives that we actually like. Most domestic crops are exotic in most of the places they’re grown, but there are even wild exotics that “do good,” forming useful relationships with native species.
Edwin Grosholz of the University of California, Davis, told the recent symposium about one such relationship. On beaches in his state, non-native spartina grass has become important habitat for the endangered California clapper rail, a plump shorebird with a downward curving bill more at home on land than in the air. A project to rip out and poison the spartina—which grows in dense swaths that exclude many other shorebirds—saw clapper rail numbers go tumbling downward.
There are other examples like that. The endangered southwestern willow flycatcher nests in “invasive” tamarisk shrubs. Many native (and beautiful) Hawaiian flowers are now pollinated by the Japanese white-eye bird—because the native pollinators have been driven extinct by other non-native species.
Should we impose further risk on already endangered natives by severing these relationships? Or should we admire the resilience of nature and let such “well-behaved” exotics stay? . . .
Leave them alone, more and more conservationists are arguing, and stop focusing obsessively on categorizing species as native or non-native. Mark Davis, an ecologist at Macalester College in St. Paul, Minnesota, once considered himself an “invasion biologist”—but not anymore. “I am actively trying to get the field to retire the invader narrative,” he said in Missoula.
A Good Thing, Not the Only Thing
After all, nativeness is just one environmental value, and arguably not as important as preventing extinctions and preserving biodiversity. In some cases we can best serve biodiversity by leaving the non-natives alone or even—brace yourself, now—introducing them on purpose.
This is the thinking behind, for example, installing the Aldabra tortoise on the islands of Mauritius. The islands lost their own large tortoises, and the fruiting plants that formerly had their seeds moved around by these fruit-loving reptiles have been on the decline. A tortoise that’s related to the island’s large tortoises—a non-native from the Seychelles in the Indian Ocean that was intentionally introduced in 2004—is now handling some of that work.
Most of the time, for the time being, conserving species still means focusing on supporting them in their historical habitats, planting natives and removing non-natives. We can and should do that in places where it is feasible and important to us.
From “It’s Time to Stop Thinking That All Non-Native Species Are Evil” by Emma Marris from NATIONAL GEOGRAPHIC MAGAZINE, July 24, 2014. Copyright © 2014 by National Geographic Society.
1stymie: hinder or interfere with
Question
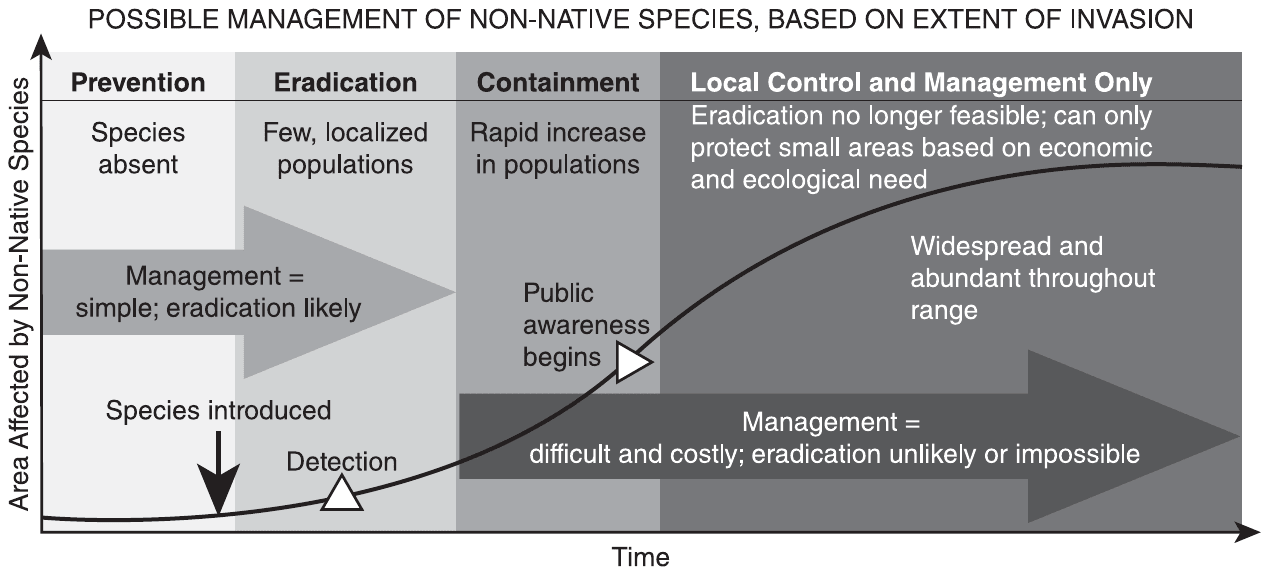
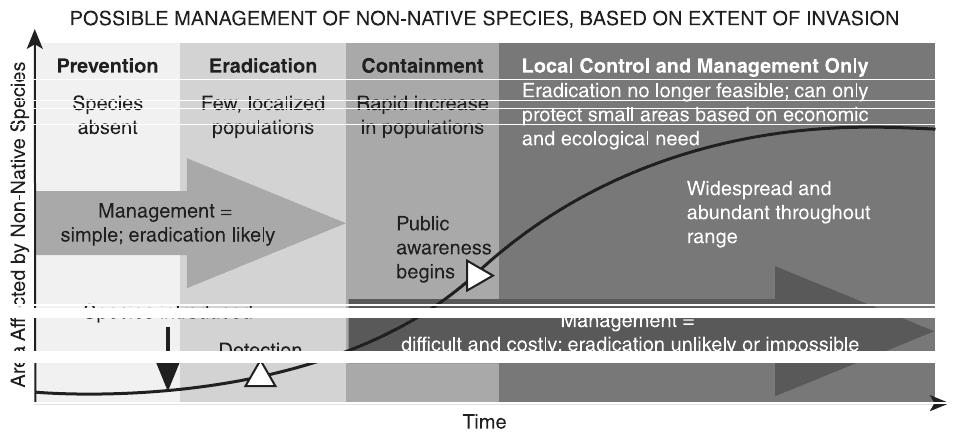
How does the chart provide additional support for a central idea of the excerpt?
- Aby implying that the public becomes aware of non-native species only after removal is impossible
- Bby showing that the complete removal of non-native species is usually not achievable after a certain period of time
- Cby demonstrating why non-native species can be destructive if they are not removed from an area immediately
- Dby explaining how some conservation groups have approached the removal of non-native species
Show the answer
Correct answer: B
The question asks how the chart provides additional support for a central idea of the excerpt.
A. Incorrect. The chart indicates that the public tends to become aware of non-native species once eradication is “unlikely or impossible,” not strictly impossible. Furthermore, this idea is not a central idea of the excerpt.
B. CORRECT. The chart strongly suggests that once “rapid increase in populations” of non-native species has occurred, eradication will be “unlikely or impossible.”
C. Incorrect. While the chart does show that non-native species can eventually be impossible to eradicate, it never addresses the issue of how the non-native species might be destructive to their new environments.
D. Incorrect. The chart shows how non-native species become harder and harder to remove as their population grows but does not explain how any conservation groups have approached their removal.
Question analysis
This question asks how a chart titled “Possible Management of Non-Native Species, Based on Extent of Invasion” supports a central idea of an article arguing that not all non-native species are harmful. Students must read the chart's stages, labels and curve, then decide which statement the chart actually shows and which also fits the article's argument.
- Grade level
- Grade 8 reading and task
- Compared with grade 7
- At grade 7 Grade 7 students connect graphics to a text, but this chart packs four stages, two arrows, a curve and several labels into one figure, and its pattern must be linked to an argument made in words, demanding but within upper grade 7.
- Estimated difficulty
- Moderate: several steps, or a close reading with one strong distractor.
- Thinking it demands
- Depth of knowledge 2, skills and concepts · mainly analyze
- What makes it hard
- Reading a figure, table or graph moderate
- A very close wrong answer moderate
- Combines ideas minor
- Evidence
- Answered from the whole text
- Reading level
- Passage: about grade 11, 815 words; question and choices: about grade 12, 78 words.
- Students, last 30 days
- Not enough answers yet to show (it takes 10).
Why it is hard, traps and wrong answers (shows the answer)
Why it is hard
The chart is easy to read in outline, simple management on the left and costly, likely failed eradication on the right, and the right choice restates that contrast. The pull comes from the “Public awareness begins” marker, placed at the border of the stage where eradication is no longer feasible, which makes a statement about public awareness look like a faithful reading. It is nearly faithful, but it describes one marker, not a central idea the article develops.
Reading a figure, table or graph moderate Understanding the question
The chart packs four shaded stages, two arrows, an S-shaped curve and three markers into one figure, and its message lies in the arrows: eradication “likely” early, “unlikely or impossible” later. (Lesh, Post & Behr, 1987; Kirsch & Mosenthal, 1990)
A very close wrong answer moderate Choosing the answer
The right choice and the public-awareness choice both read the late stages where removal fails; the awareness marker even sits on the border of “Eradication no longer feasible”, so only centrality separates them. (Embretson & Wetzel, 1987; Gorin & Embretson, 2006; Ascalon et al., 2007)
Combines ideas minor Working it out
The chart's pattern has to be matched to the article's argument that nativeness is one value among several and that removal makes sense only where “feasible and important to us”. (Embretson, 1998; Daniel & Embretson, 2010)
Strategy: Read the chart's title, axes and stage labels, say in one sentence what it shows happening over time, then ask which part of the article's argument that pattern supports.
Traps
- Too narrow: A single detail offered as the central idea or a summary, or a summary that keeps minor details and leaves out an essential part.
- Reads too much in: A reasonable-sounding conclusion that goes further than the text allows.
- Wrong part of the text: A choice is true of another paragraph, stanza or speaker than the one asked about.
The wrong answers, classified
A Too narrow (King et al., 2004)
Reads the “Public awareness begins” marker, which sits where eradication becomes unlikely or impossible, as the chart's point, though it is one label and public awareness is not a central idea.
C Reads too much in (Graesser, Singer & Trabasso, 1994)
Takes the rising curve of area affected as proof of damage, but the chart tracks spread and the difficulty of removal, never harm, and the article questions removing non-natives on reflex.
D Wrong part of the text (Kirsch & Mosenthal, 1990)
Credits the chart with the citizen groups of paragraph 3 and the spartina project of paragraph 10, but it shows general stages of possible management, not any group's actual approach.
Working it out, step by step
Know what the question asks
This asks how the chart supports a central idea, a main point of the article. First read the chart and say in your own words what it shows. Then link that to the article’s argument.
Read the chart from left to right
Time moves from left to right. The curve shows how much area a non-native species covers. Eradication means wiping a species out completely. Early on, the arrow says management is “simple” and eradication is “likely.” Then the species spreads fast. From there on, management is “difficult and costly,” and eradication is “unlikely or impossible.” In the last stage it is “no longer feasible,” or no longer possible.
Link the chart to the article
The article argues that we shouldn’t treat every non-native species the same way. Paragraph 16 says we should remove non-natives “in places where it is feasible and important to us.” The chart shows when removal is possible: mostly early, before the species spreads. After that, wiping it out usually can’t be done.
Check each choice
- B fits: complete removal is usually not possible after a certain time, which is the chart’s main message.
- A is wrong because the “Public awareness begins” marker is one small label, and the article never discusses when the public notices.
- C is wrong because the chart shows how far a species spreads, not how much damage it does.
- D is wrong because the chart shows general stages, not what any real group has done.
Watch out: A reads the marker correctly, since it does sit late, where removal is already hard. But it picks a detail, not the chart’s main point.
Choose the answer
The chart shows that removal works only early, which backs up the article’s argument. So the answer is B.
Why this answer and not the closest wrong one
A comes closest, since the chart does place “Public awareness begins” late, when removal is already hard. But that is one small marker, and the article never says when the public first notices a species. B states the chart’s main message, that removal works only early. That backs up the article’s point that removing non-natives isn’t always possible.
More questions like this
The original DOE question
The passage “Excerpt from “It’s Time to Stop Thinking That All Non-Native Species Are Evil”” as printed (pages 68–70)
Question 11 of 42
2024 Test A Math, question 21Question
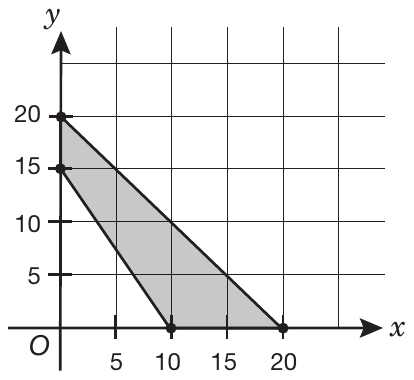
What is the area, in square units, of the shaded region shown in the figure above?
- A75
- B125
- C150
- D200
Show the answer
Correct answer: B
The area of the shaded region, in square units, is the area of the triangle created by the shaded and unshaded regions minus the area of the triangle created by the unshaded region.
The area of the triangle created by the shaded and unshaded regions is 200 square units.
The area of the triangle created by the unshaded region is 75 square units.
Subtract to find the area of the shaded region.
Question analysis
A coordinate geometry question: two line segments cross a grid, one from (0, 20) to (20, 0) and one from (0, 15) to (10, 0), and the region between them is shaded. Students find the shaded area. The shape is not a standard figure, so they need to see it as one triangle with another removed.
- Grade level
- Grade 6 content, by NYS standard
- Compared with grade 7
- At grade 7 Area of triangles is grade 6 content; finding a composite area by subtraction is the kind of task grade 7 students meet regularly. Points on the axes make every length easy to read.
- Estimated difficulty
- Straightforward: two steps or one careful reading.
- Thinking it demands
- Depth of knowledge 2, skills and concepts · mainly apply
- What makes it hard
- Reading a figure, table or graph moderate
- No obvious method minor
- Something you must already know minor
- Solution
- 3 steps
- Reading level
- Question and choices: about grade 6, 16 words.
- Students, last 30 days
- Not enough answers yet to show (it takes 10).
Why it is hard, traps and wrong answers (shows the answer)
Why it is hard
The shaded shape has no name, so the question is about seeing it as a difference of two right triangles whose legs lie on the axes. Once that is seen, both areas are one-line calculations. The wrong choices come from stopping after either triangle or from pairing a base from one segment with a height from the other.
Reading a figure, table or graph moderate Understanding the question
All four lengths come from where the two segments meet the axes, at 20 and 15 on the y-axis and at 10 and 20 on the x-axis, read against grid lines 5 units apart. (Lesh, Post & Behr, 1987; Kirsch & Mosenthal, 1990)
No obvious method minor Working it out
The shaded region is a four-sided shape with no formula of its own; it has to be seen as the large triangle with the small one removed. (Schoenfeld, 1985)
Something you must already know minor Working it out
The area of a triangle, one half of base times height, is assumed and not given. (Anderson & Krathwohl, 2001)
Strategy: Find the area of the large right triangle under the outer segment and subtract the area of the smaller triangle under the inner segment, reading the legs from the axes.
Traps
- Stops one step early: A choice is a number from partway through the solution.
- Answers a different question: A choice is right for another quantity: the other unknown, the rest instead of the part, the part instead of the whole.
- Misreads the figure: Reads a value, label or tick spacing in a figure, table or graph wrongly.
The wrong answers, classified
A Answers a different question (King et al., 2004; Hegarty, Mayer & Monk, 1995)
Finds the area of the small unshaded triangle, 1/2 × 10 × 15 = 75, and gives that region instead of the shaded one.
C Misreads the figure (Lesh, Post & Behr, 1987; Kirsch & Mosenthal, 1990)
Pairs the outer segment's x-intercept, 20, with the inner segment's y-intercept, 15, as if they bounded one triangle: 1/2 × 20 × 15 = 150.
D Stops one step early (King et al., 2004; Gierl et al., 2017)
Finds the area of the large triangle, 1/2 × 20 × 20 = 200, and stops before subtracting the unshaded triangle inside it.
Worked solution, step by step
Formulas used
- Area of a triangle
- A is the area. b is the base, the side the triangle sits on. h is the height: the straight-up distance from the base to the top corner, at a right angle to the base. You take half because a triangle is half of a rectangle with the same base and height.
Sort out the figure
The grid lines are 5 units apart. Two slanted segments run from the y-axis down to the x-axis. The outer one goes from 20 on the y-axis to 20 on the x-axis. The inner one goes from 15 on the y-axis to 10 on the x-axis. The shaded region is the strip between them. You need its area, in square units.
See the shape as two triangles
The shaded region has four sides, and it has no simple formula. But look at the big triangle under the outer segment, with its corner at O. It is the shaded strip plus the small white triangle. So the shaded area is the big triangle minus the small one.
Find the area of the big triangle
The big triangle has a right angle at O. Its base runs along the x-axis from 0 to 20, so it is 20 units. Its height runs up the y-axis from 0 to 20, so it is 20 units.
Watch out: this is the whole big triangle. Stopping here gives 200, choice D.
Find the area of the small triangle
The small triangle also has its right angle at O. Its base is 10 units, from 0 to 10 on the x-axis. Its height is 15 units, from 0 to 15 on the y-axis.
Watch out: 75 is the white triangle, choice A, not the shaded part. Also, pair the base and height of the same triangle. Mixing 20 and 15 gives 150, choice C.
Subtract to find the shaded area
Take the small white triangle away from the big triangle.
The shaded area is 125 square units. So the answer is B, 125.
Check your answer
In the figure, the shaded strip looks bigger than the white triangle. So the shaded area should be more than half of the big triangle, which is . 125 is more than 100. And , the whole big triangle.
More questions like this
The original DOE question
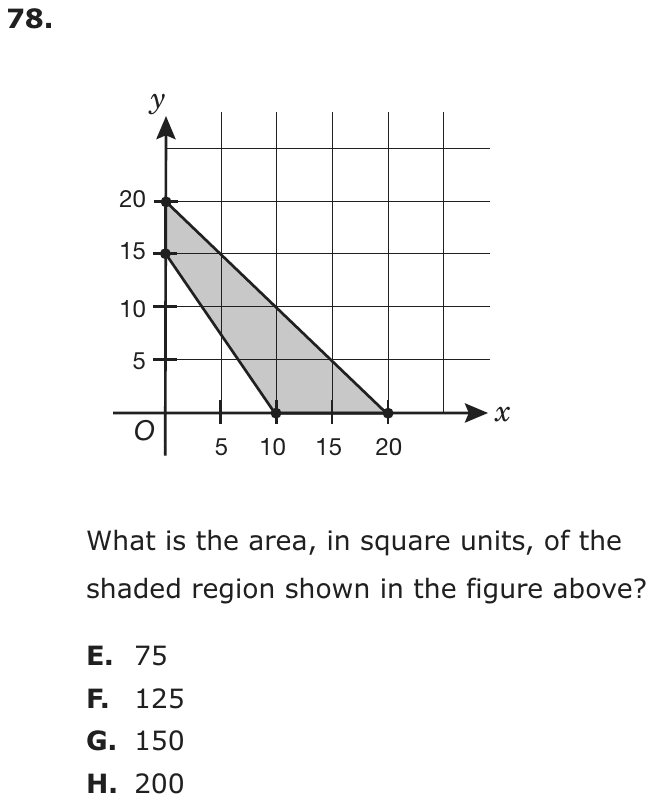
Question 12 of 42
2024 Test A Math, question 29Question
Which graph represents the solution to the inequality ?
- A

- B

- C

- D

Show the answer
Correct answer: A
Use the properties of equations to solve the inequality for x.
Subtract 4 from both sides of the inequality.
The graph of will have a point at −1 and will include all values that are greater than, or to the right of, −1. The greater than or equal sign is used, which indicates that the solution includes −1. So the point at −1 will be solid. Option A is the correct answer.
Question analysis
This inequality question asks which number line graph shows the solution set of x + 4 ≥ 3. Students solve a one-step inequality by undoing the addition, then match the result to a graph. All four graphs use a solid dot and an arrow pointing right, so the whole question rests on where the shaded ray begins.
- Grade level
- Grade 7 content, by NYS standard
- Compared with grade 7
- Below grade 7 Grade 7 inequality work is usually two-step, such as 3x − 5 ≥ 10, and asks students to choose an open or closed dot and a direction. This one needs a single subtraction, and all four graphs share a closed dot and a rightward arrow.
- Estimated difficulty
- Routine: one familiar step, little to misread.
- Thinking it demands
- Depth of knowledge 1, recall and reproduction · mainly apply
- What makes it hard
- Solution
- 2 steps
- Reading level
- Question and choices: about grade 13, 9 words.
- Students, last 30 days
- Not enough answers yet to show (it takes 10).
Why it is hard, traps and wrong answers (shows the answer)
Why it is hard
Solving takes a single subtraction, and the graphs differ only in where the solid dot sits, so the question comes down to 3 − 4. Students who lose the negative sign land on the graph that starts at 1, while those who never isolate x pick a graph that starts at a number printed in the inequality. Testing 0, which satisfies 0 + 4 ≥ 3, shows that the shading must include 0.
Reading a figure, table or graph minor Understanding the question
All four graphs share a closed dot and a rightward arrow, so the only thing to read is where the dot sits, against tick labels printed with raised minus signs. (Lesh, Post & Behr, 1987; Kirsch & Mosenthal, 1990)
Error-prone arithmetic minor Working it out
Undoing the + 4 means computing 3 − 4, the one step that crosses zero; a dropped minus sign moves the dot from −1 to 1. (Brown & Burton, 1978; Junker & Sijtsma, 2001)
Strategy: Subtract 4 from both sides to get x alone, then find the graph whose solid dot sits at that number; test one shaded value in the original inequality to confirm.
Traps
- Negatives and direction: Arithmetic with negative numbers, the order of a subtraction, or direction on a number line. (Moving a term across the equals sign without changing its sign is a faulty procedure.)
- Numbers taken from the question: Combines the numbers in the question without a model of the situation, or is simply a number that appears in the question.
The wrong answers, classified
B Negatives and direction (Brown & Burton, 1978)
Computes 4 − 3 instead of 3 − 4, or drops the minus sign of −1, and starts the shaded ray at positive 1.
C Numbers taken from the question (Hegarty, Mayer & Monk, 1995)
Starts the ray at 3, the number on the right side of the inequality, as if x ≥ 3, without subtracting the 4.
D Numbers taken from the question (Hegarty, Mayer & Monk, 1995)
Starts the ray at 4, the number added to x, reading it off the inequality instead of solving for x.
Worked solution, step by step
Formulas used
- Keeping an inequality balanced
- a and b are the two sides of an inequality, and c is any number. The sign ≥ stands for greater than or equal to. Taking the same number away from both sides keeps the comparison true, like taking the same weight off both pans of a scale. Use it to get x by itself.
Sort out the question
An inequality is a math sentence that compares two amounts. The sign means is greater than or equal to. So says that x plus 4 is 3 or more.
You need the graph that shows every number x that makes this true. All four graphs have a solid dot and an arrow to the right. Only the place where the dot sits is different.
Get x by itself
Right now 4 is added to x. To undo adding 4, subtract 4 from both sides.
So x is −1 or any number greater than −1. Watch out: 3 − 4 is −1, not 1. Dropping the minus sign puts the dot at 1, choice B. Putting the dot at 3 or 4 means you read a number off the inequality without solving. That leads to C or D.
Match the solution to a graph
On a number line, greater numbers are to the right. So the shading starts at −1 and goes right. The arrow shows that it keeps going.
The dot is solid, or filled in, because of the or equal to part. A solid dot means −1 itself is a solution, a number that makes the inequality true.
Graph A has a solid dot at −1 and is shaded to the right. So the answer is A, the graph with a solid dot at −1.
Check your answer
Test a number from the shaded part, such as 0. , and 4 is more than 3. Now test the dot: , and 3 is equal to 3, so −1 works. A number left of the dot, −2, gives . That is less than 3, so −2 should not be shaded, and it isn’t.
More questions like this
The original DOE question
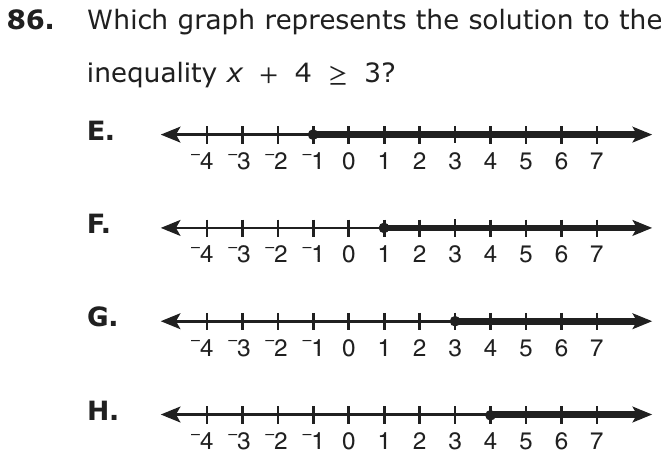
Question 13 of 42
2024 Test A Math, question 37Question
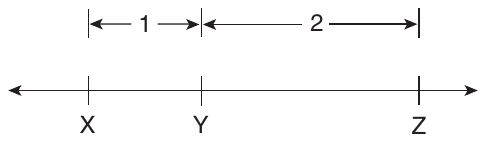
On the number line above, the distance between X and Y is 1 unit, and the distance between Y and Z is 2 units. What is the distance, in units, between Y and the midpoint of X and Z?
- A
- B1
- C
- D3
Show the answer
Correct answer: A
First, find the distance between X and Z by adding the distance between X and Y to the distance between Y and Z.
Since the distance between X and Z is 3, the midpoint between X and Z is units from X.
The midpoint between X and Z is units from X, and the distance between X and Y is 1. The distance between Y and the midpoint of X and Z is .
Question analysis
This number line question shows points X, Y and Z, with 1 unit from X to Y and 2 units from Y to Z, and asks how far Y is from the midpoint of X and Z. Students find the length of XZ, locate its midpoint, and compare it with Y. Each step produces a tempting number, so stopping early is the usual mistake.
- Grade level
- Grade 7 content, by NYS standard
- Compared with grade 7
- Below grade 7 Grade 7 number line problems usually involve negative numbers and fractions as coordinates. This one has no coordinates, only two whole-number distances, and needs three short steps: a total length, a midpoint and a difference.
- Estimated difficulty
- Straightforward: two steps or one careful reading.
- Thinking it demands
- Depth of knowledge 2, skills and concepts · mainly apply
- What makes it hard
- Reading a figure, table or graph minor
- Many steps minor
- Solution
- 3 steps
- Reading level
- Question and choices: about grade 5, 39 words.
- Corrected from the DOE handbook
- An imprecise statement about the midpoint in the explanation was corrected.
- Students, last 30 days
- Not enough answers yet to show (it takes 10).
Why it is hard, traps and wrong answers (shows the answer)
Why it is hard
The arithmetic is light, but every intermediate result is waiting among the choices, so the risk is stopping before the last subtraction. Students also have to keep two midpoints apart: the one asked about lies between X and Z, not halfway along the 2-unit stretch from Y. Marking X at 0 and the midpoint at 1.5 on the drawing makes the half-unit gap visible.
Reading a figure, table or graph minor Understanding the question
The number line has no coordinates, only dimension arrows labeled 1 and 2, so students must assign positions themselves, such as X at 0, Y at 1 and Z at 3. (Lesh, Post & Behr, 1987; Kirsch & Mosenthal, 1990)
Many steps minor Working it out
Three short results come in sequence, the length XZ, the midpoint's distance from X, then its distance from Y, and each is also a listed choice. (Daniel & Embretson, 2010; Enright, Morley & Sheehan, 2002)
Strategy: Place X at 0 so that Y and Z get positions from the given distances, find the midpoint of X and Z as half their distance, then compare it with Y's position.
Traps
- Stops one step early: A choice is a number from partway through the solution.
- Answers a different question: A choice is right for another quantity: the other unknown, the rest instead of the part, the part instead of the whole.
The wrong answers, classified
B Answers a different question (King et al., 2004; Hegarty, Mayer & Monk, 1995)
Halves the 2-unit segment from Y to Z, the midpoint of the wrong pair of points, which is 1 unit from Y; it also matches the labeled XY.
C Stops one step early (King et al., 2004; Gierl et al., 2017)
Finds that the midpoint is 1 1/2 units from X and stops before subtracting the 1 unit between X and Y.
D Answers a different question (King et al., 2004; Hegarty, Mayer & Monk, 1995)
Adds the two labeled distances, 1 + 2 = 3, and gives the whole length XZ rather than any distance to the midpoint.
What was corrected from the DOE handbook, and why
- Explanation: The handbook says “the midpoint between X and Z is 1½” (twice). A midpoint is a point, and this number line has no numbers on it, so the 1½ is the midpoint’s distance from X (half of XZ = 3). Both sentences now say the midpoint is “1½ units from X.” The rest is unchanged: Y is 1 unit from X, so the distance between Y and the midpoint is 1½ − 1 = ½.
Worked solution, step by step
Formulas used
- Adding lengths on a line
- X, Y and Z are points on one line, with Y between X and Z. XY and YZ are the lengths of the two short pieces. XZ is the length of the whole. The two pieces join end to end to make the whole.
- Midpoint of a segment
- A segment is the straight piece of a line between two points, its ends. The midpoint is the point exactly halfway between the ends. It splits the segment into two equal halves. So it is half the length away from each end.
Sort out the picture
The points go X, then Y, then Z, from left to right. X to Y is 1 unit, and Y to Z is 2 units. You need the midpoint of X and Z, the point halfway between them. Then you need how far Y is from that midpoint. The line has no numbers, so measure everything from X.
Find the length from X to Z
X to Z is 3 units. Watch out: 3 is the whole length, choice D. It is not a distance to the midpoint.
Place the midpoint
The midpoint of X and Z is half of 3 units from X.
So the midpoint is units to the right of X. Watch out: this is its distance from X, not from Y. Stopping here gives choice C.
Measure from Y to the midpoint
Y is 1 unit to the right of X. The midpoint is units to the right of X. Subtract to find the gap between them.
Watch out: use the midpoint of X and Z, not of Y and Z. Halving the 2 units from Y to Z gives 1, choice B.So the answer is A, unit.
Check your answer
Give each point a number, with X at 0. Then Y is at 1 and Z is at 3. Halfway between 0 and 3 is . From Y at 1 to is . This fits the picture too: Y sits a little left of the middle of XZ.
More questions like this
The original DOE question
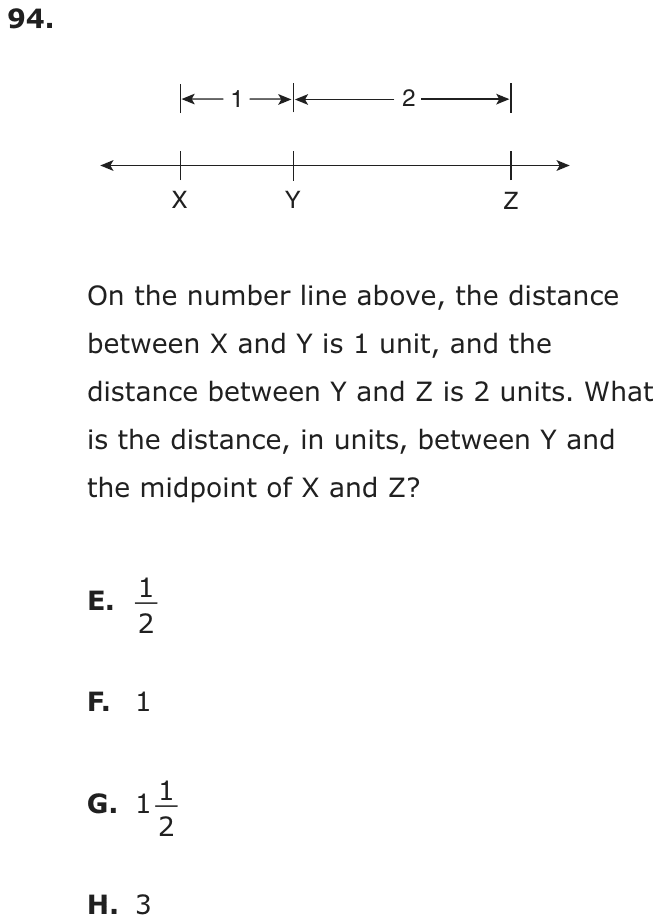
Question 14 of 42
2024 Test A Math, question 56Question

On the number line above, what is the distance, in units, between the midpoint of and the midpoint of ?
- A3
- B4
- C5
- D6
Show the answer
Correct answer: C
To find the midpoint of a segment, subtract the value on the left from the value on the right and then divide by 2. Then add the result to the value on the left of the segment.
Find the midpoint of :
Find the midpoint of :
The distance between −1 and 4 on the number line is 5 units.
Question analysis
A number line marks points P, Q and R at labeled integer positions, with P to the left of zero. This midpoint and distance question asks how far apart the midpoints of segments PQ and QR are. Students locate both midpoints and then measure the distance between them, which takes care with negative positions.
- Grade level
- Grade 7 content, by NYS standard
- Compared with grade 7
- At grade 7 Grade 7 students measure distances on a number line as the difference of two positions, including across zero. Here two midpoints must be located first, but all three points sit on labeled integers, which keeps it at grade 7 level.
- Estimated difficulty
- Straightforward: two steps or one careful reading.
- Thinking it demands
- Depth of knowledge 2, skills and concepts · mainly apply
- What makes it hard
- Error-prone arithmetic minor
- Many steps minor
- Solution
- 3 steps
- Reading level
- Question and choices: about grade 11, 21 words.
- Corrected from the DOE handbook
- A reversed instruction in the explanation was corrected.
- Students, last 30 days
- Not enough answers yet to show (it takes 10).
Why it is hard, traps and wrong answers (shows the answer)
Why it is hard
The points sit on labeled integers, so the midpoints can be found by counting, and the question is mostly about finishing carefully. Dropping the negative in 4 − (−1), stopping at the second midpoint, and counting tick marks instead of spaces each give a listed choice. Marking −1 and 4 on the figure and counting the unit spaces between them confirms the distance.
Error-prone arithmetic minor Working it out
P sits at −3, so the midpoint of PQ is (−3 + 1) ÷ 2 = −1, and the final distance, 4 − (−1), subtracts a negative number. (Brown & Burton, 1978; Junker & Sijtsma, 2001)
Many steps minor Working it out
Three results come in sequence, the midpoint of PQ, the midpoint of QR, then the gap between them, and the second of them, 4, is itself a listed choice. (Daniel & Embretson, 2010; Enright, Morley & Sheehan, 2002)
Strategy: Read the positions of P, Q and R, average each pair of endpoints to place the two midpoints, then subtract the left midpoint from the right one.
Traps
- Negatives and direction: Arithmetic with negative numbers, the order of a subtraction, or direction on a number line. (Moving a term across the equals sign without changing its sign is a faulty procedure.)
- Stops one step early: A choice is a number from partway through the solution.
- Counting the ends: Inclusive or exclusive ends, fence posts, consecutive numbers: an answer that is one too many or too few, or an endpoint drawn open where it belongs closed (or the reverse).
The wrong answers, classified
A Negatives and direction (Brown & Burton, 1978)
Finds the midpoints −1 and 4 but computes the gap as 4 − 1 = 3, dropping the negative sign instead of finding 4 − (−1).
B Stops one step early (King et al., 2004; Gierl et al., 2017)
Finds the midpoint of QR at 4 and gives its position as the answer, stopping before measuring from the other midpoint at −1.
D Counting the ends (Brown & Burton, 1978)
Counts the six tick marks from −1 to 4 inclusive rather than the five unit spaces between them.
What was corrected from the DOE handbook, and why
- Explanation: The handbook’s rule says to “subtract the value on the right from the value on the left and then divide by 2,” but its own working does the opposite: 1 − (−3) = 4 for PQ and 7 − 1 = 6 for QR, the right value minus the left. Following the rule as printed gives (−3 − 1) ÷ 2 = −2 and (1 − 7) ÷ 2 = −3, which would put the midpoints at −5 and −2, outside the segments, and lead to a distance of 3, a wrong choice. The site now says “subtract the value on the left from the value on the right.” The midpoints, −1 and 4, and the distance between them, 5 units, are unchanged.
Worked solution, step by step
Formulas used
- Midpoint on a number line
- The left end and right end are the numbers at the two ends of a segment. Right end minus left end is the segment’s length. The midpoint is halfway, so it is half the length to the right of the left end.
- Distance on a number line
- On a number line, numbers grow as you move right. The distance between two points is the larger number minus the smaller one. That is the right point minus the left point, so a distance is never negative.
Read the number line
P is at −3, Q is at 1 and R is at 7. A bar over two letters, such as , means the segment between them. A segment is the straight piece of line between two points. You need the midpoint of each segment, the point exactly halfway between its ends. Then you need the distance between those two midpoints.
Find the midpoint of PQ
The left end is −3 and the right end is 1.
So the midpoint of PQ is at −1. Note that is , which is 4.
Find the midpoint of QR
The left end is 1 and the right end is 7.
So the midpoint of QR is at 4. Watch out: 4 is where a midpoint is, not the answer. Stopping here gives choice B.
Measure between the midpoints
Watch out: keep the minus sign on −1. Using gives choice A. Also count the spaces, not the tick marks. From −1 to 4 there are 5 spaces but 6 marks, and 6 is choice D.So the answer is C, 5 units.
Check your answer
Each midpoint should sit in the middle of its segment. −1 is 2 units from both −3 and 1. 4 is 3 units from both 1 and 7. There is also a shortcut. The gap between the midpoints is half of PR: .
More questions like this
The original DOE question
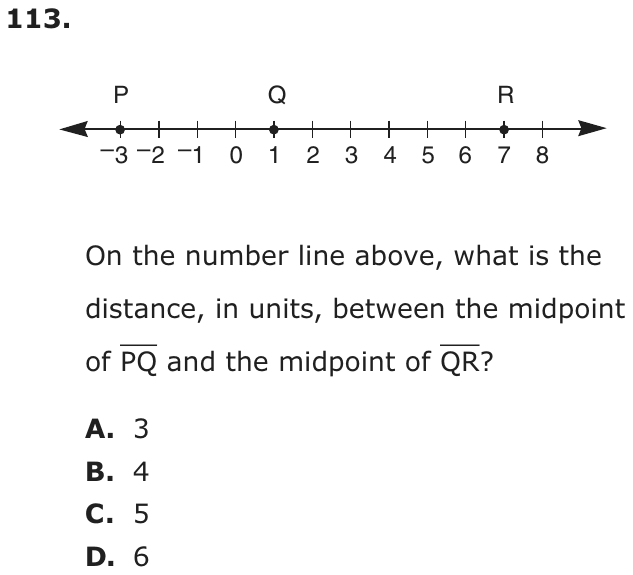
Question 15 of 42
2024 Test B Math, question 6Question
This graph shows y, the weight of a pole of length x.
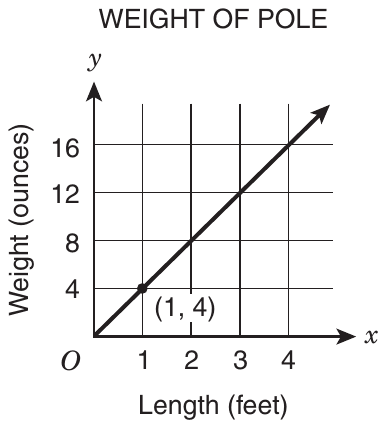
What is represented by the point with coordinates (1, 4)?
- AThe unit rate is 4 ounces per foot.
- BThe y-intercept is 4.
- CA pole 4 feet long weighs 1 ounce.
- DThe length increases 4 feet for each 1 ounce of weight.
Show the answer
Correct answer: A
The x-axis represents the length of the pole, in feet, and the y-axis represents the weight of the pole, in ounces.
The point (1, 4) means that a 1-foot pole would weigh 4 ounces.
Since the graph is linear, the pole weighs 4 ounces for every additional 1 foot of length.
So the unit rate is 4 ounces per foot.
Question analysis
A graph of a pole's weight in ounces against its length in feet is a straight line through the origin, with the point (1, 4) marked. Students decide what that point says about poles, choosing among statements about rates, intercepts and particular poles, so the meaning of each coordinate has to be pinned down.
- Grade level
- Grade 7 content, by NYS standard
- Compared with grade 7
- At grade 7 Explaining what a point on a proportional graph means in the situation is a named grade 7 skill. This is a direct, one-step example with a clear graph, typical of grade 7 classwork.
- Estimated difficulty
- Straightforward: two steps or one careful reading.
- Thinking it demands
- Depth of knowledge 2, skills and concepts · mainly understand
- What makes it hard
- Solution
- 1 step
- Reading level
- Question and choices: about grade 2, 45 words.
- Students, last 30 days
- Not enough answers yet to show (it takes 10).
Why it is hard, traps and wrong answers (shows the answer)
Why it is hard
Nothing needs computing; the question tests whether a point on a graph can be put into words. Each wrong statement misuses the same two numbers, as an intercept, with the coordinates swapped, or as a rate turned upside down. Saying the point aloud with its units, a 1-foot pole weighs 4 ounces, and comparing that sentence with each statement settles it quickly.
Reading a figure, table or graph moderate Understanding the question
The axes carry the meaning: length in feet runs along x and weight in ounces up y, so (1, 4) describes a 1-foot pole, and the line through O makes that a rate. (Lesh, Post & Behr, 1987; Kirsch & Mosenthal, 1990)
A very close wrong answer minor Choosing the answer
Both rate statements pair 4 with 1, one as ounces per foot and the other as feet per ounce; only the axis labels say which way the rate runs. (Embretson & Wetzel, 1987; Gorin & Embretson, 2006; Ascalon et al., 2007)
Something you must already know minor Working it out
The choices use the terms unit rate and y-intercept, which the question does not define, and two statements hang on knowing what each one means. (Anderson & Krathwohl, 2001)
Strategy: Note which quantity each axis measures, say in words what the x-coordinate and the y-coordinate of the marked point stand for, then compare that sentence with each choice.
Traps
- Wrong operation: Adds instead of multiplying, divides the wrong way round, turns a ratio or rate upside down, or undoes a step in the wrong direction (subtracts what should be added back).
- Misreads the figure: Reads a value, label or tick spacing in a figure, table or graph wrongly.
- Misunderstands the concept: A wrong belief about a concept: that percents can be added, that area grows like length, that averages can be averaged, that a bigger denominator means a bigger fraction.
The wrong answers, classified
B Misunderstands the concept (Smith, diSessa & Roschelle, 1993; De Bock et al., 1998; Ni & Zhou, 2005)
Takes the 4 in the point's label for the y-intercept, though the line starts at the origin, where a pole of no length weighs 0 ounces.
C Misreads the figure (Lesh, Post & Behr, 1987; Kirsch & Mosenthal, 1990)
Reads the coordinates the wrong way round, taking 1 as the weight in ounces and 4 as the length in feet.
D Wrong operation (Hegarty, Mayer & Monk, 1995; King et al., 2004)
Turns the rate upside down, describing feet of length per ounce of weight instead of ounces of weight per foot of length.
Worked solution, step by step
Formulas used
- Unit rate
- For a point on the line, y is the weight in ounces and x is the length in feet. The unit rate is the weight of 1 foot of pole. This works for a straight line that starts at the origin, the point (0, 0).
Read the axes
The graph has two axes (number lines). The x-axis, across the bottom, shows length in feet. The y-axis, going up, shows weight in ounces.
A point is written (x, y). The across number comes first, then the up number. So in (1, 4), x is 1 and y is 4.
Say what the point means
x = 1 means a length of 1 foot. y = 4 means a weight of 4 ounces. So a pole 1 foot long weighs 4 ounces.
Watch out: do not swap the numbers. “A pole 4 feet long weighs 1 ounce” reads them the wrong way round. That is choice C.See that this is a unit rate
A unit rate is an amount for 1 unit, here the ounces in 1 foot. The line starts at O, the origin (0, 0), and it is straight. So each extra foot adds the same weight.
The unit rate is 4 ounces per foot. Watch out: choice D turns this upside down. It gives feet for each ounce, not ounces for each foot.
Rule out the y-intercept
The y-intercept is where the line crosses the y-axis. This line crosses it at O, where y is 0. So the y-intercept is 0, not 4, and choice B is wrong.
So the answer is A, the unit rate is 4 ounces per foot.
Check your answer
Try another point on the line, such as (3, 12). A pole 3 feet long weighs 12 ounces. , so it is still 4 ounces per foot. The rate stays the same all along the line.
More questions like this
The original DOE question
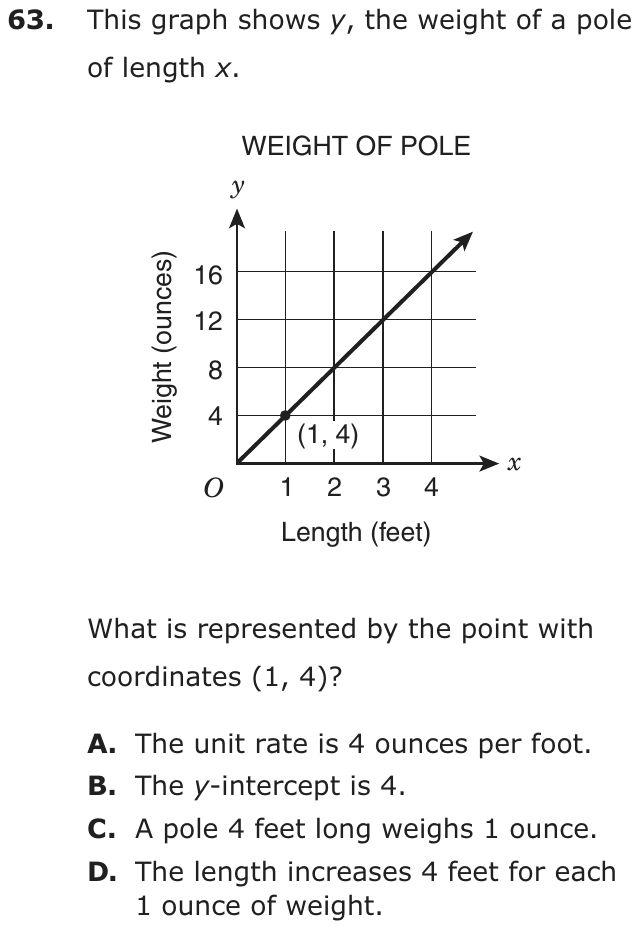
Question 16 of 42
2024 Test B Math, question 7Question
The number line shows points E, F, G, and H.
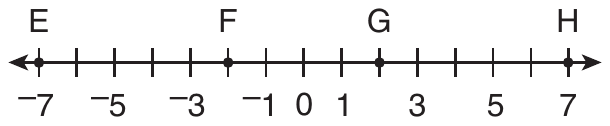
Which point represents the sum of ?
- Apoint E
- Bpoint F
- Cpoint G
- Dpoint H
Show the answer
Correct answer: B
Find the sum of :
Point F is located at −2.
Question analysis
A number line question with points E, F, G and H marked on a line labeled from −7 to 7. Students add 2.5 and negative 4.5 and find which point shows the sum. It tests adding a positive and a negative decimal, then reading positions on a line whose labels skip some integers.
- Grade level
- Grade 7 content, by NYS standard
- Compared with grade 7
- At grade 7 Adding rational numbers with different signs and showing the sum on a number line is exactly the grade 7 standard. This is one routine sum with simple decimals, a typical classroom exercise.
- Estimated difficulty
- Routine: one familiar step, little to misread.
- Thinking it demands
- Depth of knowledge 1, recall and reproduction · mainly apply
- What makes it hard
- Solution
- 2 steps
- Reading level
- Question and choices: about grade 1, 25 words.
- Students, last 30 days
- Not enough answers yet to show (it takes 10).
Why it is hard, traps and wrong answers (shows the answer)
Why it is hard
This is a one-line sum followed by a lookup, and most students finish quickly. The four points are placed so that each common sign mistake lands on one of them: −7, 2 and 7 all come from mishandling the negative. Picturing the sum as a move of 4.5 units to the left from 2.5 shows both the size and the direction at once.
Error-prone arithmetic minor Working it out
Adding −4.5 to 2.5 means taking 4.5 away from 2.5, and the larger size of −4.5 makes the sum negative, a sign rule that is easy to apply backwards. (Brown & Burton, 1978; Junker & Sijtsma, 2001)
Reading a figure, table or graph minor Understanding the question
Only 0 and the odd numbers are labeled, so point F sits at an unlabeled tick between −3 and −1 and must be found by counting. (Lesh, Post & Behr, 1987; Kirsch & Mosenthal, 1990)
Strategy: Rewrite adding −4.5 as subtracting 4.5, work out the sum, then find it on the line by counting tick marks from a labeled number, one tick per integer.
Traps
- Negatives and direction: Arithmetic with negative numbers, the order of a subtraction, or direction on a number line. (Moving a term across the equals sign without changing its sign is a faulty procedure.)
The wrong answers, classified
A Negatives and direction (Brown & Burton, 1978)
Adds the sizes 2.5 and 4.5 and makes the total negative, treating both numbers as negative, which lands on −7 at point E.
C Negatives and direction (Brown & Burton, 1978)
Subtracts 2.5 from 4.5 to get the right size, 2, but keeps it positive, missing that the negative number has the larger size.
D Negatives and direction (Brown & Burton, 1978)
Ignores the negative sign on 4.5 and adds the two numbers, 2.5 + 4.5 = 7, landing on point H at the far right.
Worked solution, step by step
Formulas used
- Adding a negative number
- a is any number, and −b is a negative number. Adding a negative number is the same as subtracting its size. On a number line, it means moving b steps to the left.
Sort out the question
You need to find . Then find that sum (the answer to the addition) on the number line.
The number line has a tick at every whole number from −7 to 7. Only 0 and the odd numbers have labels.
Turn the addition into subtraction
You are taking 4.5 away from 2.5. You take away more than you have, so the answer will be negative.
Do the subtraction
The two sizes differ by 2, because . The larger size, 4.5, belongs to the negative number. So the sum is negative.
Watch out: the answer is −2, not 2. Point G is at 2.Find −2 on the line
−2 has no label. It is the tick between −3 and −1. Point F sits on that tick.
Watch out: adding 2.5 + 4.5 = 7 lands on point H. Making both numbers negative gives −7, point E.So the answer is B, point F.
Check your answer
Start at 2.5 on the number line and move 4.5 steps to the left. The first 2.5 steps take you to 0. You still have 2 steps to go. Two more steps left of 0 lands on −2, which is point F.
More questions like this
The original DOE question
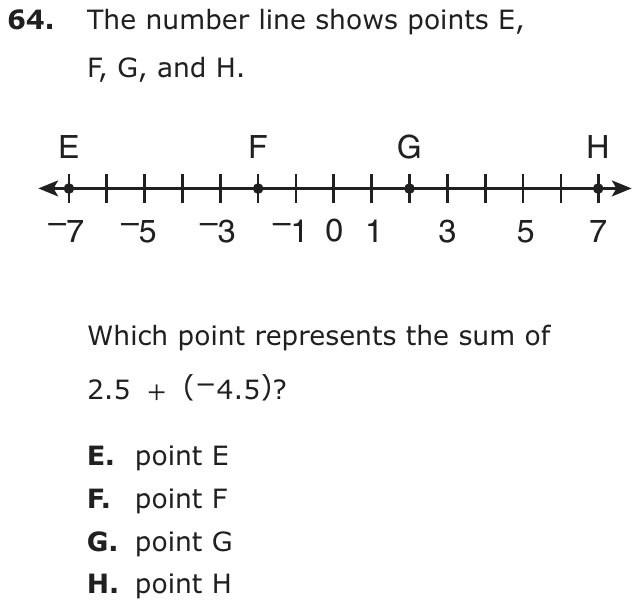
Question 17 of 42
2024 Test B Math, question 18Question
A taxi driver recorded the number of fares each day for one month. The box plot displays the data.
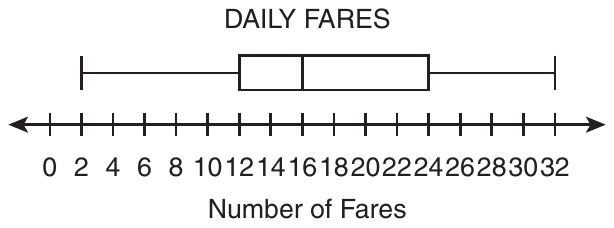
Based on the box plot, which statement is a correct interpretation of the data?
- AThe data point 2 is an outlier.
- BThe mean of the data is 16.
- CThe interquartile range (IQR) of the data is 30.
- DOn about 25% of the days, there were between 12 and 16 fares.
Show the answer
Correct answer: D
The amount of data in a box plot is broken into 4 parts, or quartiles, which each represent 25% of the data. So the amount of data represented between Quartile 1 (12) and the median (16) is about 25% of the data.
Question analysis
A statistics question on a box plot of the number of fares a taxi driver recorded each day for one month. Students decide which of four statements is a correct interpretation of the data, using what a box plot does and does not show. The statements draw on several different box plot ideas, so each one must be checked.
- NYS standards
- 7.SP.1 box plots and interquartile range
- Grade level
- Grade 7 content, by NYS standard
- Compared with grade 7
- At grade 7 Reading box plots, finding the interquartile range and testing for outliers are all grade 7 standards in New York. This item gathers several of them in one question, but each check is short, typical of grade 7 work.
- Estimated difficulty
- Moderate: several steps, or a close reading with one strong distractor.
- Thinking it demands
- Depth of knowledge 2, skills and concepts · mainly understand
- What makes it hard
- Something you must already know moderate
- Every choice must be checked moderate
- Reading a figure, table or graph minor
- Solution
- 3 steps
- Reading level
- Question and choices: about grade 4, 63 words.
- Students, last 30 days
- Not enough answers yet to show (it takes 10).
Why it is hard, traps and wrong answers (shows the answer)
Why it is hard
No calculation here is long; the challenge is knowing what a box plot does and does not show. Two of the wrong statements sound reasonable because they borrow real features of the plot, its long left whisker and its middle line, and give them the wrong meaning. Remembering that the plot splits the days into four groups of about equal size makes the true statement easy to confirm.
Something you must already know moderate Working it out
Each statement draws on a box plot fact the test does not supply: what the middle line marks, how the IQR is found, and when a value counts as an outlier. (Anderson & Krathwohl, 2001)
Every choice must be checked moderate Choosing the answer
The four statements test four separate ideas, an outlier, the mean, the IQR and a quartile's share, so ruling out one says nothing about the next. (Embretson & Wetzel, 1987)
Reading a figure, table or graph minor Understanding the question
The scale is labeled every 2 fares with the numbers crowded together, so the five values 2, 12, 16, 24 and 32 must be read off with care. (Lesh, Post & Behr, 1987; Kirsch & Mosenthal, 1990)
Strategy: Read the minimum, quartiles, median and maximum off the plot, then test each statement in turn, computing the IQR and the outlier cutoffs rather than judging by eye.
Traps
- Misunderstands the concept: A wrong belief about a concept: that percents can be added, that area grows like length, that averages can be averaged, that a bigger denominator means a bigger fraction.
- Wrong formula: Uses a related but wrong formula: perimeter for area, diameter for radius, area for volume, or a misremembered one.
The wrong answers, classified
A Misunderstands the concept (Smith, diSessa & Roschelle, 1993; De Bock et al., 1998; Ni & Zhou, 2005)
Takes the long left whisker as a sign that 2 is an outlier, but that whisker holds a quarter of the days, and 2 is above the cutoff 12 − 1.5 × 12 = −6.
B Misunderstands the concept (Smith, diSessa & Roschelle, 1993; De Bock et al., 1998; Ni & Zhou, 2005)
Takes the median line at 16 for the mean, though a box plot shows the median and quartiles and cannot show the mean.
C Wrong formula (King et al., 2004)
Subtracts the minimum from the maximum, 32 − 2 = 30, which is the range, not the interquartile range of 24 − 12 = 12.
Worked solution, step by step
Formulas used
- Interquartile range (IQR)
- Q1 is the first quartile, the left edge of the box. Q3 is the third quartile, the right edge. The IQR is the length of the box. It tells how spread out the middle half of the data is.
- Low cutoff for an outlier
- Q1 and the IQR are found from the box. An outlier is a value far away from the rest. A value below this cutoff counts as an outlier on the low side. A value at or above it does not.
Read the five numbers
A box plot sums up a set of data with five numbers. Here each piece of data is the number of fares on one day.
- Minimum, the smallest value: 2
- First quartile, Q1, the left edge of the box: 12
- Median, the middle value, the line inside the box: 16
- Third quartile, Q3, the right edge of the box: 24
- Maximum, the largest value: 32
Learn what each part holds
These five numbers split the days into four parts. Each part holds about one fourth of the days, or about 25%. For example, about 25% of the days fall between the minimum and Q1. Another 25% fall between Q1 and the median.
Check choice D
Choice D talks about days with between 12 and 16 fares. 12 is Q1, and 16 is the median. That stretch is one of the four parts. So on about 25% of the days, there were between 12 and 16 fares. Choice D is correct.
Rule out choices B and C
Choice B: a box plot shows the median, 16, not the mean (the average). You cannot find the mean from it. Watch out: do not mix up the median and the mean.
Choice C says the IQR is 30. But 30 is the range, . Watch out: the IQR uses the edges of the box, not the ends of the whiskers.
Rule out choice A and answer
A long whisker does not make 2 an outlier. Use the cutoff rule.
2 is above −6, so 2 is not an outlier. The long whisker just shows that the lowest fourth of the days is spread out.
So the answer is D.
Check your answer
Go back over the four choices. Only D uses what a box plot really shows: four parts of about 25% each. Choice B needs the mean, which the plot does not show. Choice C gives the range, not the IQR. And 2 is not far enough out to be an outlier, so A is wrong.
More questions like this
The original DOE question
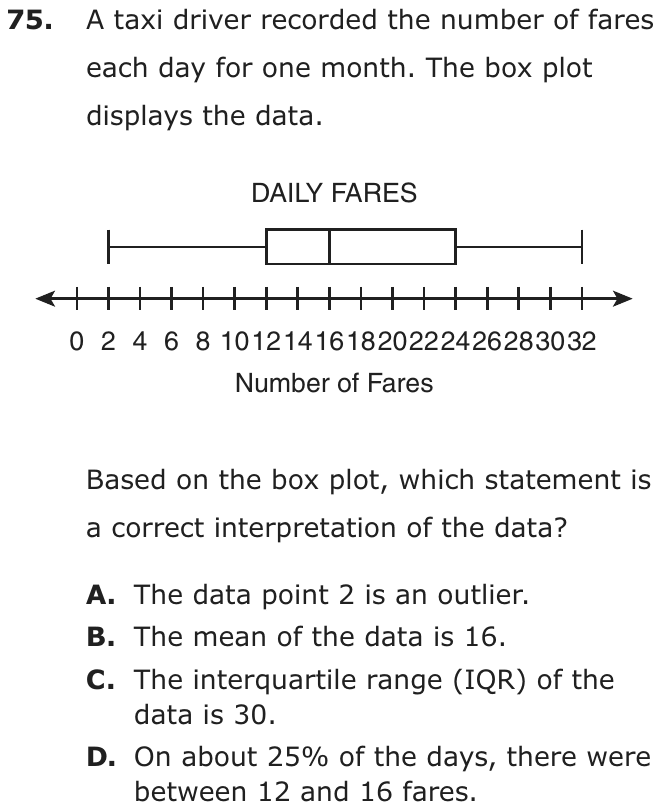
Question 18 of 42
2024 Test B Math, question 25Question
Which number line represents the values of x that satisfy the inequality ?
- A

- B

- C

- D

Show the answer
Correct answer: B
Split the compound inequality into two inequalities.
and
For each inequality, subtract 1 from each side.
and
For each inequality, divide both sides by −3. Note that dividing each side of an inequality by a negative number changes the direction of the inequality.
and
Combining the pieces gives the compound inequality .
The solution is that x is greater than or equal to −1 and less than or equal to 2, so choose the number line with filled circles at −1 and 2, with the filled segment between the circles.
Question analysis
An inequality question: choose the number line that shows the solutions of the compound inequality −5 ≤ 1 − 3x ≤ 4. Students solve an inequality whose x term has a negative coefficient, then match the endpoints, open or closed circles, and shading to one of four graphs.
- Grade level
- Grade 7 content, by NYS standard
- Compared with grade 7
- Above grade 7 Grade 7 students solve and graph two-step inequalities one at a time. This compound inequality needs two solved together and a division by a negative number, which reverses the signs, a step many grade 7 classes only touch on.
- Estimated difficulty
- Hard: combines ideas, needs a plan, and has more than one tempting wrong answer.
- Thinking it demands
- Depth of knowledge 1, recall and reproduction · mainly apply
- What makes it hard
- Error-prone arithmetic moderate
- A very close wrong answer moderate
- Reading a figure, table or graph minor
- Solution
- 4 steps
- Reading level
- Question and choices: about grade 12, 13 words.
- Students, last 30 days
- Not enough answers yet to show (it takes 10).
Why it is hard, traps and wrong answers (shows the answer)
Why it is hard
The question stacks two classic traps: reversing the inequality signs when dividing by −3, and matching filled or open circles to ≤. All four graphs use the endpoints −1 and 2, so finding those numbers proves little; the choice turns on the circles and the direction of the shading. Testing x = 0, x = 3 and the endpoint x = 2 in the original inequality checks both decisions in under a minute.
Error-prone arithmetic moderate Working it out
Dividing all three parts of −6 ≤ −3x ≤ 3 by −3 reverses both signs and the order, giving 2 ≥ x ≥ −1, which must be rewritten as −1 ≤ x ≤ 2. (Brown & Burton, 1978; Junker & Sijtsma, 2001)
A very close wrong answer moderate Choosing the answer
Two graphs share the endpoints −1 and 2 and the shading between them; only the circles, filled for ≤ and open for <, separate them. (Embretson & Wetzel, 1987; Gorin & Embretson, 2006; Ascalon et al., 2007)
Reading a figure, table or graph minor Understanding the question
Each graph must be read for three things at once: the endpoints, the fill of each circle, and whether the shading runs between them or outward. (Lesh, Post & Behr, 1987; Kirsch & Mosenthal, 1990)
Strategy: Subtract 1 from all three parts, divide all three by −3 while reversing both inequality signs, then rewrite the result from smallest to largest before matching circles and shading.
Traps
- Negatives and direction: Arithmetic with negative numbers, the order of a subtraction, or direction on a number line. (Moving a term across the equals sign without changing its sign is a faulty procedure.)
- Counting the ends: Inclusive or exclusive ends, fence posts, consecutive numbers: an answer that is one too many or too few, or an endpoint drawn open where it belongs closed (or the reverse).
The wrong answers, classified
A Counting the ends (Brown & Burton, 1978)
Solves for the right endpoints and shading but draws open circles, as if ≤ excluded −1 and 2 instead of including them.
C Negatives and direction (Brown & Burton, 1978)
Divides by −3 without reversing the signs, so the solutions seem to lie outside −1 and 2; with open circles, this graph shows exactly the values that fail.
D Negatives and direction (Brown & Burton, 1978)
Shades outward as if the signs had not reversed, but mixes the circles, filled at −1 and open at 2, which no single reading of ≤ gives.
Worked solution, step by step
Formulas used
- Subtracting from every part
- a and b are the two sides of an inequality, and c is any number. Subtracting the same number from every part keeps the inequality true. The sign does not change.
- Dividing by a negative number
- a and b are numbers, and c is a positive number, so −c is negative. When you divide both sides by a negative number, the inequality sign flips. For example, 2 is less than 3, but −2 is greater than −3.
Sort out the question
The inequality says that is between −5 and 4. The sign ≤ means less than or equal to. So −5 and 4 themselves are allowed. You need the number line that shows every x that works. To find them, get x alone in the middle.
Subtract 1 from every part
First take away the 1 in the middle. Subtract 1 from all three parts.
Divide by −3 and flip
Now x is multiplied by −3. Divide all three parts by −3. Dividing by a negative number flips each sign.
Watch out: if you forget to flip, x seems to lie outside −1 and 2. That leads to choices C and D, which are shaded outward.Read the result
Turn it around so the smaller number is on the left. It means the same thing.
So x can be any number from −1 to 2. The ends, −1 and 2, are included, because the signs are ≤.
Pick the number line
On a number line, a closed (filled-in) circle means the end number is included. An open circle means it is not. So you need closed circles at −1 and 2, with the part between them shaded. Watch out: choice A has the right shading but open circles, which leave out −1 and 2.
So the answer is B.
Check your answer
Test a few numbers in . For x = 0 you get 1, which is between −5 and 4, and 0 is shaded. For x = 2 you get −5, which is allowed, so the circle at 2 is filled in. For x = 3 you get −8, which is too small, so 3 is not shaded.
More questions like this
The original DOE question
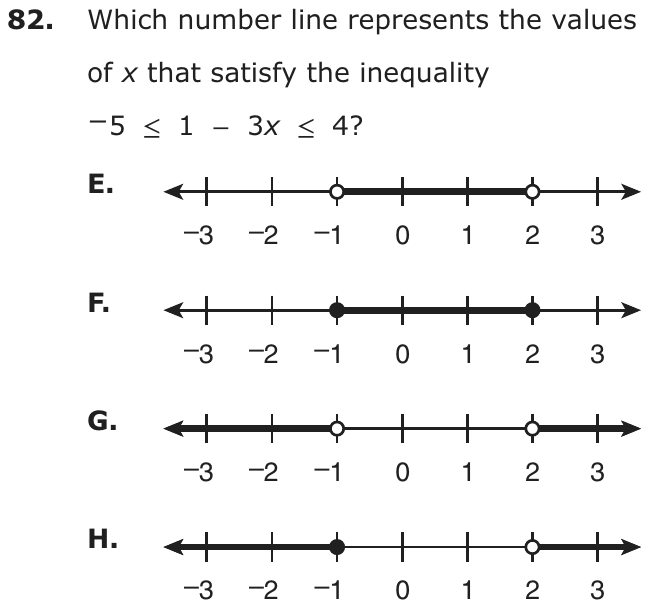
Question 19 of 42
2024 Test B Math, question 28Question
A community center has two 30-member exercise groups. The director recorded the ages of each group’s members in the box plots.
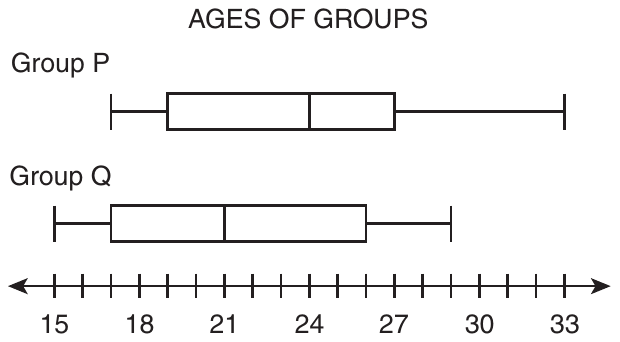
Which statement about the two groups can be verified based on the box plots?
- ABoth groups have at least one member who is exactly 29 years old.
- BGroup P has more members who are at least 17 years old than Group Q has.
- CBoth groups have an equal number of members who are between 21 and 24 years old.
- DGroup Q has fewer members who are between 19 and 27 years old than Group P has.
Show the answer
Correct answer: B
Groups P and Q have an equal number of members. All the members of Group P are 17 or older, but only about of the members of Group Q are 17 or older.
Question analysis
Box plots show the ages of the members of two 30-member exercise groups at a community center, Group P and Group Q. Students decide which statement comparing the groups can be verified from the plots alone. The challenge is knowing what a box plot guarantees about individual ages and counts, and what it leaves unknown.
- NYS standards
- Grade level
- Grade 7 content, by NYS standard
- Compared with grade 7
- Above grade 7 Grade 7 students read box plots and compare medians and spreads. Deciding which claims two box plots can prove, from what the five key values guarantee about counts, is a harder reasoning task than typical grade 7 work.
- Estimated difficulty
- Hard: combines ideas, needs a plan, and has more than one tempting wrong answer.
- Thinking it demands
- Depth of knowledge 3, strategic thinking · mainly evaluate
- What makes it hard
- Every choice must be checked major
- Something you must already know moderate
- Reading a figure, table or graph moderate
- Solution
- 3 steps
- Reading level
- Question and choices: about grade 5, 91 words.
- Students, last 30 days
- Not enough answers yet to show (it takes 10).
Why it is hard, traps and wrong answers (shows the answer)
Why it is hard
This is a question about evidence: the right statement is the only one the box plots guarantee, while the others may or may not be true. Students who treat the plots as pictures of every member, assuming ages fill each whisker or spread evenly through each box, find support for claims that cannot be checked. Asking what must hold for any 30 ages with these summaries separates the verifiable claim from the merely plausible ones.
Every choice must be checked major Choosing the answer
Three of the statements are not false but unverifiable, so each must be tested against what the five-number summaries guarantee, and none can be dismissed at a glance. (Embretson & Wetzel, 1987)
Something you must already know moderate Working it out
Students must know that the minimum and maximum are actual ages, that each quarter of a plot holds about a quarter of the 30 members, and that a whisker shows nothing in between. (Anderson & Krathwohl, 2001)
Reading a figure, table or graph moderate Understanding the question
The scale is labeled only every 3 years, so values such as 17, 19, 26 and 29 have to be read from unlabeled ticks on two separate plots. (Lesh, Post & Behr, 1987; Kirsch & Mosenthal, 1990)
Strategy: List each group's minimum, first quartile, median, third quartile and maximum, then test every statement against only what those five values guarantee about the 30 ages.
Traps
- Misunderstands the concept: A wrong belief about a concept: that percents can be added, that area grows like length, that averages can be averaged, that a bigger denominator means a bigger fraction.
- Numbers taken from the question: Combines the numbers in the question without a model of the situation, or is simply a number that appears in the question.
The wrong answers, classified
A Misunderstands the concept (Smith, diSessa & Roschelle, 1993; De Bock et al., 1998; Ni & Zhou, 2005)
Sees that Group Q's maximum is exactly 29 and that 29 also lies in Group P's upper whisker, assuming someone in Group P is that age.
C Numbers taken from the question (Hegarty, Mayer & Monk, 1995)
Matches the two medians, 21 and 24, and assumes the stretch between them holds the same number of members in both groups.
D Misunderstands the concept (Smith, diSessa & Roschelle, 1993; De Bock et al., 1998; Ni & Zhou, 2005)
Knows Group P's box from 19 to 27 holds half its members, then assumes ages spread evenly so Group Q has fewer there, which its plot cannot show.
Worked solution, step by step
Formulas used
- Members in each part of a box plot
- n is the number of members in a group, here 30. A box plot splits the data into four parts at the minimum, Q1, the median, Q3 and the maximum. Each part holds about one fourth of the data. It does not show how the ages spread out inside a part.
Read the two box plots
A box plot shows five numbers. The minimum is the youngest age, and the maximum is the oldest. Q1 is the left edge of the box, and Q3 is the right edge. The median is the line inside the box.
Group Min Q1 Median Q3 Max P 17 19 24 27 33 Q 15 17 21 26 29 Each group has 30 members.
Know what can be verified
To verify a statement means to know for sure that it is true. A box plot shows only five numbers, not every age. The minimum and maximum are real ages of real members. The other ages are hidden inside the box and whiskers.
Check choice B
In Group P, the youngest member is 17. So all 30 members are at least 17. In Group Q, the youngest member is 15, and 15 is under 17. So at most 29 members of Group Q are at least 17.
Group P has 30 such members, and Group Q has 29 or fewer. So choice B is true for sure.
Rule out choices A and C
A: Group Q’s oldest member is 29, so Group Q has a 29-year-old. But in Group P, 29 is inside the right whisker. A whisker does not show single ages. Watch out: 29 is in Group P’s range, but maybe no one in Group P is exactly 29.
C: The plots do not show how many members are between 21 and 24 in either group.
Rule out choice D and answer
Group P’s box, from 19 to 27, is two of its four parts.
So about 15 members of Group P are between 19 and 27. But 19 and 27 fall in the middle of Group Q’s parts, and ages inside a part can bunch up in any way. Group Q could have more or fewer. Watch out: D assumes the ages are spread out evenly, and a box plot never tells you that.
So the answer is B.
Check your answer
Choice B uses only the two minimums, which are real ages. Group P’s youngest member is 17, and Group Q’s is 15. That alone proves it. Each other choice needs ages inside a box or whisker, which a box plot does not show.
More questions like this
The original DOE question
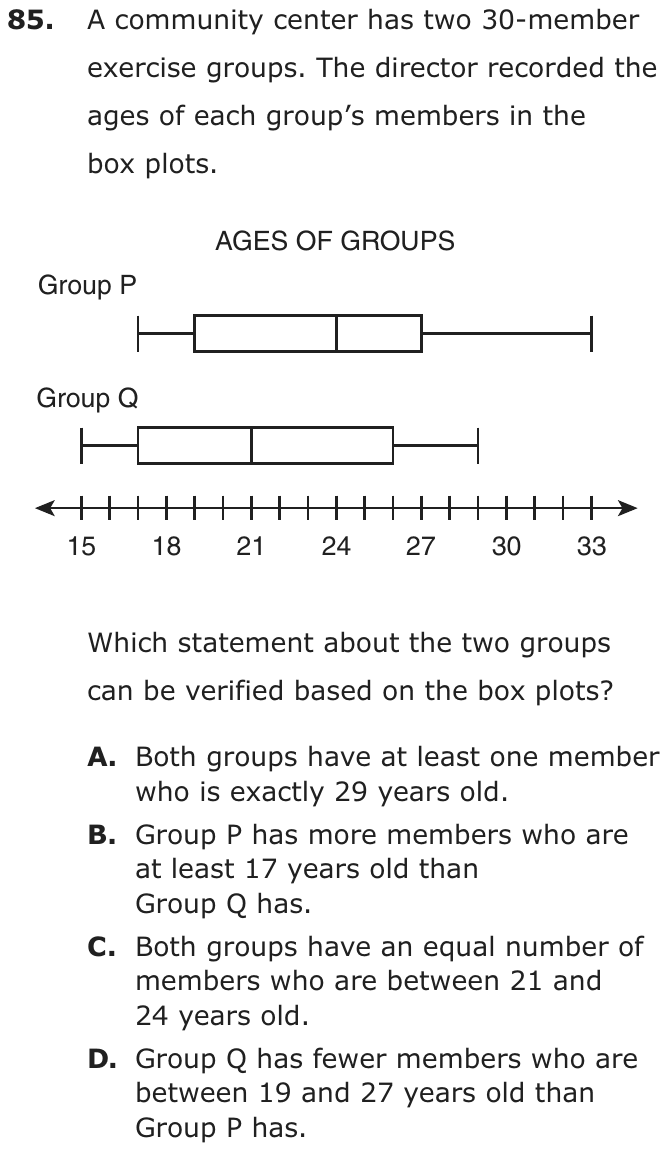
Question 20 of 42
2024 Test B Math, question 53Question
Which graph represents the solution to ?
- A

- B

- C

- D

Show the answer
Correct answer: A
Since , either or .
Solving for x gives .
Solving for x gives .
A filled circle on a number line represents “or equal to.” So the correct number line representation has filled circles at −3 and 1, with the number line filled to the left of −3 for “less than” and to the right of 1 for “greater than.”
Question analysis
Students choose the number line graph that shows every solution of an inequality in which x + 1 sits inside absolute value bars. It tests absolute value as distance and graphing inequalities. The tricky part is turning one absolute value statement into two pieces and placing each boundary point and shaded ray correctly.
- NYS standards
- Grade level
- Grade 7 content, by NYS standard
- Compared with grade 7
- Above grade 7 Grade 7 students solve and graph two-step inequalities and know absolute value as distance. An inequality with an absolute value has to be split into two cases, which is outside the grade 6 to 8 standards and well above typical grade 7 work.
- Estimated difficulty
- Hard: combines ideas, needs a plan, and has more than one tempting wrong answer.
- Thinking it demands
- Depth of knowledge 2, skills and concepts · mainly apply
- What makes it hard
- Something you must already know moderate
- A very close wrong answer moderate
- Reading a figure, table or graph minor
- Solution
- 3 steps
- Reading level
- Question and choices: about grade 9, 7 words.
- Students, last 30 days
- Not enough answers yet to show (it takes 10).
Why it is hard, traps and wrong answers (shows the answer)
Why it is hard
Reading |x + 1| as the distance from x to −1 makes this quick: the points 2 units away are −3 and 1, and greater than or equal means outside them. Students who solve only one case and mirror it across 0 land on graphs centered on 0, and students who find both endpoints may still shade between them. The graphs differ in just one dot or one shading choice, so each must be read carefully.
Something you must already know moderate Working it out
Solving |x + 1| ≥ 2 needs two cases, x + 1 ≤ −2 or x + 1 ≥ 2, joined by or; absolute value inequalities go beyond grade 7, and the stem gives no hint. (Anderson & Krathwohl, 2001)
A very close wrong answer moderate Choosing the answer
The right graph and the segment from −3 to 1 share both filled endpoints, so only deciding between outside and between the boundaries separates them. (Embretson & Wetzel, 1987; Gorin & Embretson, 2006; Ascalon et al., 2007)
Reading a figure, table or graph minor Understanding the question
Four number lines must be read for filled dots and arrow directions, and two of them differ from the right one only in where a single dot sits. (Lesh, Post & Behr, 1987; Kirsch & Mosenthal, 1990)
Strategy: Read the absolute value as distance from −1 on the number line, find the points exactly 2 units away, and decide whether the solutions lie between or outside them.
Traps
- Misunderstands the concept: A wrong belief about a concept: that percents can be added, that area grows like length, that averages can be averaged, that a bigger denominator means a bigger fraction.
- Negatives and direction: Arithmetic with negative numbers, the order of a subtraction, or direction on a number line. (Moving a term across the equals sign without changing its sign is a faulty procedure.)
The wrong answers, classified
B Misunderstands the concept (Smith, diSessa & Roschelle, 1993; De Bock et al., 1998; Ni & Zhou, 2005)
Solves x + 1 ≥ 2 to get x ≥ 1, then mirrors it across 0 to x ≤ −1, as if the solution were centered on 0 rather than on −1.
C Negatives and direction (Brown & Burton, 1978)
Finds −3 and 1 but shades between them, the solution of |x + 1| ≤ 2, reversing which side of the boundaries lies at least 2 units from −1.
D Misunderstands the concept (Smith, diSessa & Roschelle, 1993; De Bock et al., 1998; Ni & Zhou, 2005)
Solves x + 1 ≤ −2 to get x ≤ −3, then mirrors it across 0 to x ≥ 3, assuming the boundaries are symmetric about 0.
Worked solution, step by step
Formulas used
- Absolute value as distance
- x and a are points on the number line. The bars mean absolute value. |x − a| is how far apart the two points are, which is never negative. Since x + 1 = x − (−1), |x + 1| is the distance from x to −1.
Sort out the question
You need the graph of every x that makes true. The sign ≥ means greater than or equal to. The bars mean absolute value.
On a number line, a filled dot means that point counts. A thick line with an arrow means all the numbers that way count too.
Read it as a distance
Adding 1 is the same as subtracting −1, so . By the formula, is the distance from x to −1.
So the inequality says that x is at least 2 units away from −1.
Find the two boundary points
Start at −1 and go 2 units each way.
At −3 and at 1, the distance is exactly 2. The words or equal to let them count, so they get filled dots.
Decide which side to shade
Being at least 2 away means being farther out. Numbers between −3 and 1 are too close to −1. For example, 0 is only 1 unit away. So shade to the left of −3 and to the right of 1.
In algebra, that is or . These give or .
Match the graph
Choice A has filled dots at −3 and 1, with arrows going outward. That matches.
Watch out: Choice C shades between −3 and 1. Those are the points within 2 of −1, the answer to . Choices B and D are centered on 0, but the center here is −1.
So the answer is A, the graph shaded outward from −3 and 1.
Check your answer
Test a point from each part. For x = 2, , and 3 is at least 2. For x = 0, , which is less than 2. For x = −3, , which counts. Graph A agrees with all three.
More questions like this
The original DOE question
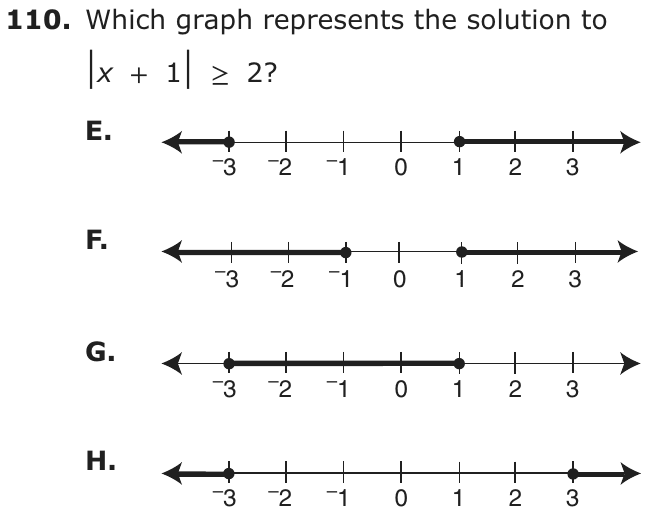
Question 21 of 42
2023 Test A Math, question 10Question

Points Y and Z are not shown on the number line above. If X is the midpoint of , and Y is the midpoint of , where on the number line would point Z be located?
- A2
- B4
- C6
- D8
Show the answer
Correct answer: D
First, find where Y is located on the number line. Point X is the midpoint of . Since there are 2 units between W and X, there must also be 2 units between X and Y. Thus, Y is located at 4 on the number line.
Point Y is the midpoint of . Use the same reasoning as above. Since there are 4 units between W and Y, there must be 4 units between Y and Z. So, Z is located at 8 on the number line.
Question analysis
A number line shows point W at 0 and point X at 2, and two more points, Y and Z, are described but not drawn. Students use two midpoint facts, one after the other, to find where Z lies. Each midpoint fact is about a different segment, so keeping track of which point is the middle one matters.
- Grade level
- Grade 7 content, by NYS standard
- Compared with grade 7
- Below grade 7 Midpoints on a number line rest on distance, which grade 7 students find as a difference. Here every point lies at a whole number of zero or more, so the work is two short steps with no negative numbers.
- Estimated difficulty
- Straightforward: two steps or one careful reading.
- Thinking it demands
- Depth of knowledge 2, skills and concepts · mainly apply
- What makes it hard
- Many steps minor
- Reading a figure, table or graph minor
- Solution
- 2 steps
- Reading level
- Question and choices: about grade 7, 36 words.
- Students, last 30 days
- Not enough answers yet to show (it takes 10).
Why it is hard, traps and wrong answers (shows the answer)
Why it is hard
Each midpoint statement doubles a distance from W, so the problem is two short doublings, 2 to 4 and then 4 to 8. The risk is stopping halfway, since Y's position is found first and appears among the choices, or reusing X as an endpoint in the second statement. Rereading which point the question asks about, and checking that Y is halfway between W and Z, catches both.
Many steps minor Working it out
The two midpoint statements must be used in order: the first places Y at 4, and only then can the second, about segment WZ, place Z. (Daniel & Embretson, 2010; Enright, Morley & Sheehan, 2002)
Reading a figure, table or graph minor Understanding the question
Only W at 0 and X at 2 are marked on the 0-to-10 line, and the overbars name WY and WZ as segments, so Y and Z have to be placed from the statements alone. (Lesh, Post & Behr, 1987; Kirsch & Mosenthal, 1990)
Strategy: Use the first midpoint to place Y as far beyond X as X is from W, then use the second midpoint the same way to place Z beyond Y.
Traps
- Answers a different question: A choice is right for another quantity: the other unknown, the rest instead of the part, the part instead of the whole.
- Misreads the question: Misses or misreads a condition or a word in the question: "at least", "each", "remaining", "not".
The wrong answers, classified
A Numbers taken from the question (Hegarty, Mayer & Monk, 1995)
Gives 2, the position of point X, the only labeled point besides W, without using either midpoint statement.
B Answers a different question (King et al., 2004; Hegarty, Mayer & Monk, 1995)
Uses the first statement to place Y at 4 and answers with Y's position instead of going on to locate Z, the point the question asks about.
C Misreads the question (Hegarty, Mayer & Monk, 1995)
Treats Y as the midpoint of XZ instead of WZ, so Z lands 2 units past Y, at 6, continuing the even steps from W to X to Y.
Worked solution, step by step
Formulas used
- Midpoint of a segment
- A and B are the ends of a segment, a straight piece of a line. M is its midpoint, the point exactly halfway. AM is the distance from A to M, and MB is the distance from M to B. A midpoint splits a segment into two equal parts, so these are equal.
Sort out the question
The number line shows W at 0 and X at 2. Points Y and Z are not shown. X is the midpoint of segment WY. Y is the midpoint of segment WZ. A midpoint is the point exactly halfway along a segment. You need the number where Z sits.
Place point Y
X is halfway from W to Y. So X to Y is as long as W to X.
So Y is 2 units past X.
Point Y is at 4. Watch out: this is Y, not Z. Stopping here gives 4, choice B.
Place point Z
Now Y is halfway from W to Z. W to Y is 4 units, so Y to Z is also 4 units.
Watch out: the second midpoint is for segment WZ, not XZ. Taking just 2 more units from Y puts Z at 6, choice C. So the answer is D, 8.
Check your answer
Check both midpoints. Halfway from 0 to 4 is , which is X. Halfway from 0 to 8 is , which is Y. Both facts in the question are true.
More questions like this
The original DOE question
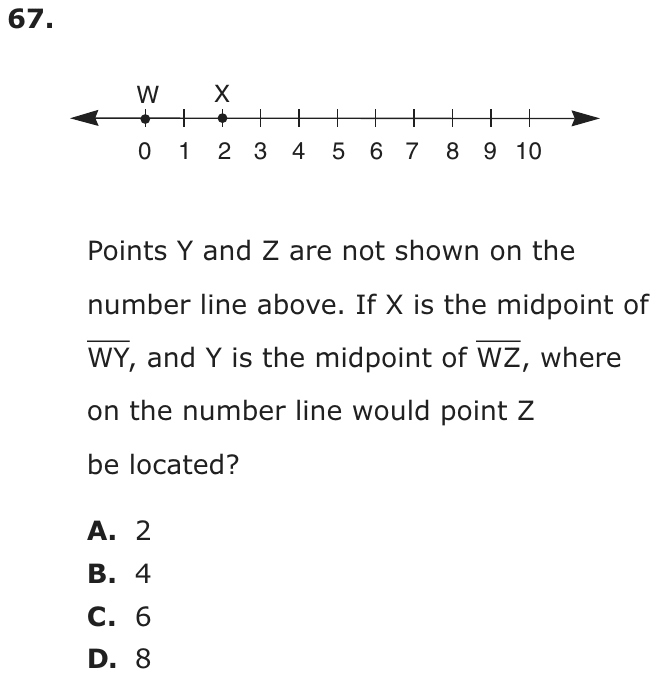
Question 22 of 42
2023 Test A Math, question 15Question
A swim instructor used the box plot below to display the distribution of the ages of students who signed up for swim lessons.
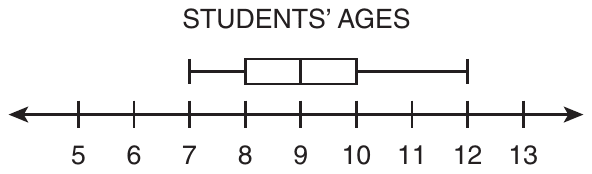
Which statement about the distribution of ages is true?
- AThe data contain an outlier.
- BApproximately half the students are exactly 9 years old.
- CApproximately one-fourth of the students are at least 10 years old.
- DThe interquartile range is 3 greater than the range of the data.
Show the answer
Correct answer: C
The data points in the box plot are as follows:
- minimum: 7
- first quartile: 8
- median: 9
- third quartile: 10
- maximum: 12
Since the value of the third quartile is 10, approximately one-fourth of the students are 10–12 years old.
Question analysis
A swim instructor's box plot shows the ages of students who signed up for lessons. Students decide which of four statements about the distribution is true, using the minimum, quartiles, median and maximum. The statements test different box plot ideas, including outliers, the median, the quartiles and the range, so each needs its own check.
- Grade level
- Grade 7 content, by NYS standard
- Compared with grade 7
- At grade 7 New York places box plots, the interquartile range and outliers in grade 7. Here four statements test those ideas one at a time; each check is short, so the item matches typical grade 7 work.
- Estimated difficulty
- Moderate: several steps, or a close reading with one strong distractor.
- Thinking it demands
- Depth of knowledge 2, skills and concepts · mainly understand
- What makes it hard
- Something you must already know moderate
- Every choice must be checked moderate
- Reading a figure, table or graph minor
- Solution
- 3 steps
- Reading level
- Question and choices: about grade 8, 66 words.
- Students, last 30 days
- Not enough answers yet to show (it takes 10).
Why it is hard, traps and wrong answers (shows the answer)
Why it is hard
Reading the five values off the plot is quick; the work is knowing what a box plot can and cannot say. It shows where quarters of the data begin and end, not how many students share any one age, and a long whisker is not an outlier unless it passes the 1.5 × IQR cutoff, here 13. The true statement uses the third quartile: about a quarter of the students are 10 or older.
Something you must already know moderate Working it out
The statements rely on box plot facts the question does not give: each section holds about a quarter of the data, the middle line is the median, and outliers lie beyond 1.5 IQRs. (Anderson & Krathwohl, 2001)
Every choice must be checked moderate Choosing the answer
Four statements test four separate ideas, an outlier, the share at one age, a quarter of the data and two spreads, so ruling one out says nothing about the rest. (Embretson & Wetzel, 1987)
Reading a figure, table or graph minor Understanding the question
The five values, 7, 8, 9, 10 and 12, are read off a 5-to-13 scale, where the longer right whisker draws the eye more than the box does. (Lesh, Post & Behr, 1987; Kirsch & Mosenthal, 1990)
Strategy: Read the five key values off the plot, then test each statement: compute the range, the interquartile range and the outlier cutoffs, and recall what share of the data each part holds.
Traps
- Misunderstands the concept: A wrong belief about a concept: that percents can be added, that area grows like length, that averages can be averaged, that a bigger denominator means a bigger fraction.
- Wrong formula: Uses a related but wrong formula: perimeter for area, diameter for radius, area for volume, or a misremembered one.
The wrong answers, classified
A Misunderstands the concept (Smith, diSessa & Roschelle, 1993; De Bock et al., 1998; Ni & Zhou, 2005)
Takes the long right whisker, reaching 12, as a sign of an outlier, but 12 is below the cutoff 10 + 1.5 × 2 = 13.
B Misunderstands the concept (Smith, diSessa & Roschelle, 1993; De Bock et al., 1998; Ni & Zhou, 2005)
Reads the median line at 9 as the age of half the students, though a median only splits the ages into a lower and an upper half.
D Wrong formula (King et al., 2004)
Swaps the two measures, taking the box's 2 years as the range and the whiskers' 5 years as the interquartile range, so the IQR seems 3 greater.
Worked solution, step by step
Formulas used
- Range
- The maximum is the largest value, the right end of a box plot. The minimum is the smallest, the left end. The range is how far apart they are. It shows how spread out all the data are.
- Interquartile range
- IQR is short for interquartile range. Q1, the first quartile, is the left edge of the box. Q3, the third quartile, is the right edge. The IQR is the width of the box. It is the spread of the middle half of the data. The four parts of a box plot each hold about one-fourth of the data.
- Outlier test
- An outlier is a value far from the rest of the data. A common rule says a value is an outlier if it lies more than 1.5 IQRs below Q1 or above Q3.
Read the five values off the plot
A box plot shows five numbers. The median is the middle value when the ages are in order.
Part Age Minimum, the left whisker’s end 7 First quartile, Q1, the box’s left edge 8 Median, the line in the box 9 Third quartile, Q3, the box’s right edge 10 Maximum, the right whisker’s end 12 Check choice A, an outlier
An outlier would be above 13 or below 5. The ages only run from 7 to 12. So there is no outlier. Watch out: a long whisker is not an outlier. It just means the top ages are spread out. Choice A is false.
Check choice B, the median
The median, 9, is the middle age. About half the students are 9 or younger. About half are 9 or older. It does not tell how many are exactly 9. Watch out: the median line does not mean half the students are 9. Choice B is false.
Check choice C, the top fourth
The box plot splits the students into four groups of about the same size. Each group holds about one-fourth of them. The last group runs from Q3, 10, to the maximum, 12. At least 10 means 10 or more. So about one-fourth of the students are at least 10 years old. Choice C is true.
Check choice D, the two spreads
The IQR is 3 less than the range, not 3 greater. The box always fits inside the whiskers, so the IQR can never be bigger. Watch out: swapping the two measures gives choice D. So the answer is C: about one-fourth of the students are at least 10 years old.
Check your answer
Picture 20 students. About 5 would be in each fourth of the plot. The top 5 would be ages 10 to 12. That is about one-fourth, just as choice C says. Each other choice fails a fact you can read straight off the plot.
More questions like this
The original DOE question
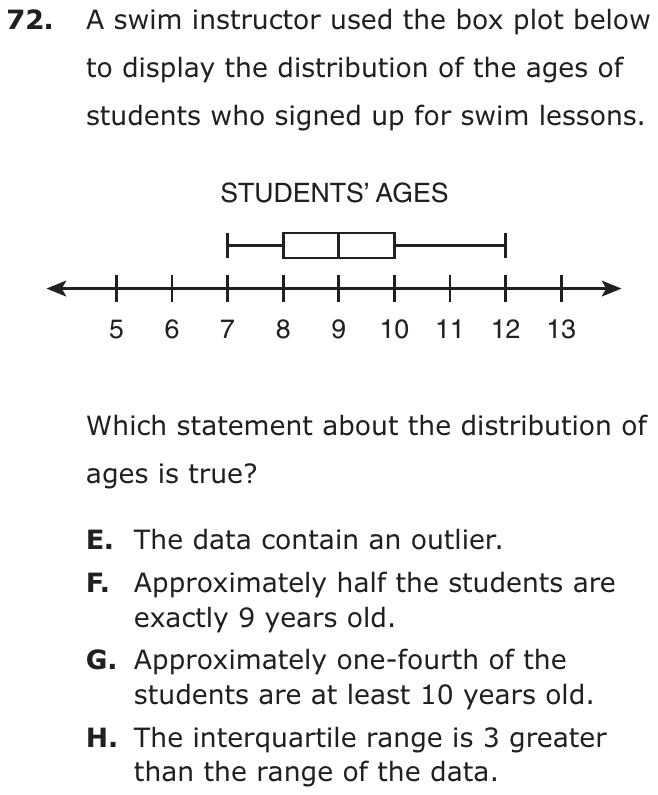
Question 23 of 42
2023 Test A Math, question 35Question

On the number line above, point L (not shown) is located on line segment JK so that . What is the position of point L?
- A−2
- B0
- C2
- D4
Show the answer
Correct answer: B
units. Let . Then . Substitute these expressions in the given equation:
Solve for x:
| Apply the multiplicative inverse property; multiply both sides of the equation by 3. | |
| Apply the distributive property; multiply the 2 by 10 and x. | |
| Apply the additive inverse property; add to both sides of the equation. | |
| Apply the multiplicative inverse property; divide both sides of the equation by 5. | |
So, point L is 4 units to the right of point J: . Point L is located at 0 on the number line.
Question analysis
This number line question puts J at −4 and K at 6 and asks for the position of a point L on segment JK where JL is two thirds of LK. Students find the segment's length, divide it in a 2-to-3 ratio, and turn a distance into a coordinate. Reading the ratio backwards, or giving a distance instead of a position, leads to wrong answers.
- Grade level
- Grade 7 content, by NYS standard
- Compared with grade 7
- At grade 7 Distances on a number line that crosses zero are grade 7 rational-number work, and splitting a length in a given ratio is grade 7 proportional reasoning. Turning a fraction of one part into a split, then into a position, makes a typical multistep task.
- Estimated difficulty
- Moderate: several steps, or a close reading with one strong distractor.
- Thinking it demands
- Depth of knowledge 2, skills and concepts · mainly apply
- What makes it hard
- Turning words into math moderate
- Reading a figure, table or graph minor
- Many steps minor
- Solution
- 3 steps
- Reading level
- Question and choices: about grade 5, 25 words.
- Students, last 30 days
- Not enough answers yet to show (it takes 10).
Why it is hard, traps and wrong answers (shows the answer)
Why it is hard
The ratio is stated between two unknown pieces, which is less familiar than a fraction of a whole, and the final step turns a length into a position. Students who stop at JL's length, read 2/3 the wrong way round, or use its 2 as a distance all reach listed points. Sketching five equal shares of 2 units from −4 to 6, two for JL and three for LK, makes the position plain.
Turning words into math moderate Understanding the question
JL = 2/3 LK compares the two pieces with each other, not a piece with the whole JK, so the 10 units must be split in the ratio 2 : 3, giving JL 4 and LK 6. (Hegarty, Mayer & Monk, 1995; Koedinger & Nathan, 2004)
Reading a figure, table or graph minor Understanding the question
J's position, −4, and K's, 6, are read from the number line, whose labeled ticks run every 2 units, and L itself is not drawn. (Lesh, Post & Behr, 1987; Kirsch & Mosenthal, 1990)
Many steps minor Working it out
Three steps follow in order: the length JK = 6 − (−4), the length JL from the ratio, and finally L's position counted from J rather than from 0. (Daniel & Embretson, 2010; Enright, Morley & Sheehan, 2002)
Strategy: Find the length of JK, split it into five equal shares with two for JL and three for LK, then count JL's length to the right from J.
Traps
- Stops one step early: A choice is a number from partway through the solution.
- Wrong operation: Adds instead of multiplying, divides the wrong way round, turns a ratio or rate upside down, or undoes a step in the wrong direction (subtracts what should be added back).
- Numbers taken from the question: Combines the numbers in the question without a model of the situation, or is simply a number that appears in the question.
The wrong answers, classified
A Numbers taken from the question (Hegarty, Mayer & Monk, 1995)
Takes the 2 in 2/3 as the length of JL and moves 2 units right from J at −4, without relating JL to LK or to JK.
C Wrong operation (Hegarty, Mayer & Monk, 1995; King et al., 2004)
Turns the ratio upside down, making LK two thirds of JL, so JL is 6 and L lands at 2, nearer K than J.
D Stops one step early (King et al., 2004; Gierl et al., 2017)
Finds JL = 4 correctly but gives that length as L's position, stopping before counting the 4 units from J at −4.
Worked solution, step by step
Formulas used
- Distance on a number line
- Subtract the position on the left from the position on the right. The answer is how many units apart the two points are. A distance is never negative.
- Splitting a length in a ratio
- A ratio a : b compares two pieces. If a length is split in the ratio a : b, think of it as a + b equal parts. The first piece gets a of them and the second gets b. Divide the whole length by a + b to find one part.
Sort out the question
Read the number line. Point J is at −4 and point K is at 6. Point L sits somewhere between them. JL is the length from J to L, and LK is the length from L to K. The rule says JL is of LK. You need the position of L.
Find the length of JK
K is on the right, so subtract J’s position from K’s.
Taking away −4 is the same as adding 4. J and K are 10 units apart.
Turn the rule into equal parts
JL is of LK. So for every 2 units in JL, LK has 3 units. That means JK is made of 2 + 3 = 5 equal parts. JL gets 2 parts and LK gets 3.
Each part is 2 units long.
Find the two lengths
Watch out: JL is of LK, not the other way round. Flipping the ratio makes JL 6 and puts L at 2, choice C.
Find the position of L
L is 4 units to the right of J. Start at J’s position, −4, and move 4 to the right.
Watch out: 4 is the length of JL, not where L sits. Answering 4 is choice D. So the answer is B, 0.
Check your answer
Put L at 0 and test the rule. JL = 0 − (−4) = 4, and LK = 6 − 0 = 6. Then , which is JL. Also 4 + 6 = 10, the whole length JK.
More questions like this
The original DOE question
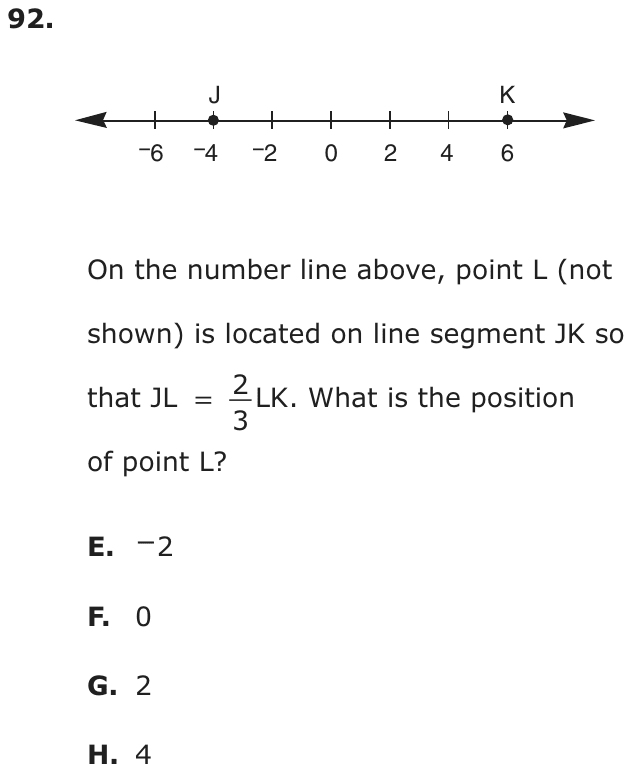
Question 24 of 42
2023 Test A Math, question 38Question
Which graph represents the solution to ?
- A

- B

- C

- D

Show the answer
Correct answer: A
| Apply the additive inverse property; add 7 to both sides of the inequality. | |
| Apply the multiplicative inverse property; divide both sides of the inequality by −3. Note: when dividing an inequality by a negative number, the inequality sign is reversed. | |
The solution is that x is less than −1, so choose the graph that starts at −1 and continues to the left.
Question analysis
This inequality question asks which number line graph shows the solution of −3x − 7 > −4. Students solve a two-step inequality whose x term has a negative coefficient, then match the boundary point and the direction of the shading. Handling the inequality symbol at the division step is where most mistakes happen, and each slip has a matching graph.
- Grade level
- Grade 7 content, by NYS standard
- Compared with grade 7
- At grade 7 Solving and graphing a two-step inequality is a core grade 7 standard. This one has a negative coefficient on x, the classic grade 7 inequality trap, and four similar graphs test whether the sign and the direction were both handled.
- Estimated difficulty
- Moderate: several steps, or a close reading with one strong distractor.
- Thinking it demands
- Depth of knowledge 1, recall and reproduction · mainly apply
- What makes it hard
- Something you must already know moderate
- A very close wrong answer moderate
- Reading a figure, table or graph minor
- Solution
- 3 steps
- Reading level
- Question and choices: about grade 9, 7 words.
- Corrected from the DOE handbook
- A wrong term in the explanation was corrected.
- Students, last 30 days
- Not enough answers yet to show (it takes 10).
Why it is hard, traps and wrong answers (shows the answer)
Why it is hard
The solving takes two moves, but the second carries the rule the question tests: dividing an inequality by a negative number flips its direction. The four graphs cross two features, boundary at −1 or 1 and shading left or right, so forgetting the flip, dropping a sign, or both each land on a graph. Testing a shaded value such as x = −2 in the original inequality, where 6 − 7 = −1 is greater than −4, confirms the choice.
Something you must already know moderate Working it out
The step that decides the question, reversing the symbol when dividing both sides by −3, is a rule students must bring themselves; −3x > 3 becomes x < −1, not x > −1. (Anderson & Krathwohl, 2001)
A very close wrong answer moderate Choosing the answer
The graph shaded to the right from an open circle at −1 matches the right graph's boundary exactly and differs only in direction, the result of skipping the reversal. (Embretson & Wetzel, 1987; Gorin & Embretson, 2006; Ascalon et al., 2007)
Reading a figure, table or graph minor Understanding the question
Each graph must be read for two things, where its open circle sits, at −1 or 1, and which way the arrow runs, so a boundary alone does not identify the answer. (Lesh, Post & Behr, 1987; Kirsch & Mosenthal, 1990)
Strategy: Add 7 to both sides, divide by −3 and reverse the inequality symbol, then match both the boundary point and the shading direction; test one shaded value in the original.
Traps
- Negatives and direction: Arithmetic with negative numbers, the order of a subtraction, or direction on a number line. (Moving a term across the equals sign without changing its sign is a faulty procedure.)
The wrong answers, classified
B Negatives and direction (Brown & Burton, 1978)
Reverses the symbol correctly but drops the negative in 3 ÷ (−3), so the boundary lands at 1 with the shading to its left.
C Negatives and direction (Brown & Burton, 1978)
Divides both sides by −3 without reversing the symbol, solving the inequality as if it were an equation, so x > −1 and the shading runs right.
D Negatives and direction (Brown & Burton, 1978)
Treats −3x as 3x, so it solves 3x > 3 to get x > 1 with no reversal, which puts both the boundary and the direction wrong.
What was corrected from the DOE handbook, and why
- Explanation: The handbook’s steps say “add 7 to both sides of the equation” and “divide both sides of the equation by −3” (p. 142, question 95). But −3x − 7 > −4 is an inequality, not an equation, and the step’s own note is the point of the question: dividing an inequality by a negative number reverses the sign. The site now says “both sides of the inequality” in both steps, as the DOE’s later guides word this step (“Subtract 4 from both sides of the inequality” in the 2024–2025 guide). The working and the answer are unchanged.
Worked solution, step by step
Formulas used
- Adding to both sides of an inequality
- a and b are the two sides, and c is any number. Adding the same amount to both sides keeps the comparison true, like adding the same weight to both pans of a scale.
- Dividing an inequality by a negative number
- a and b are the two sides, and c is a negative number. When you divide both sides by a negative number, the greater-than sign flips to less-than. That is because negatives reverse order: 2 is more than 1, but −2 is less than −1.
Sort out the question
An inequality compares two amounts. The sign > means is greater than. You need the graph of every x that makes true. The graphs differ in two ways: where the open circle sits, at −1 or 1, and which way the shading goes.
Add 7 to both sides
Adding 7 undoes the −7, so the x term is alone on the left.
Divide by −3 and flip the sign
So x is any number less than −1. Watch out: if you forget to flip the sign, you get x > −1, and that graph is choice C. Also, 3 ÷ (−3) is −1, not 1. Dropping that minus sign leads to B or D.
Match the solution to a graph
Less than −1 means to the left of −1 on the number line. The circle at −1 is open, or empty, because −1 itself does not work. The sign means greater than, not greater than or equal to.
Graph A has an open circle at −1 and is shaded to the left. So the answer is A, the graph shaded left from an open circle at −1.
Check your answer
Test a number on each side of −1. For x = −2: , and −1 is greater than −4, so −2 works. For x = 0: , and −7 is less than −4, so 0 does not work. The shading must go left.
More questions like this
The original DOE question
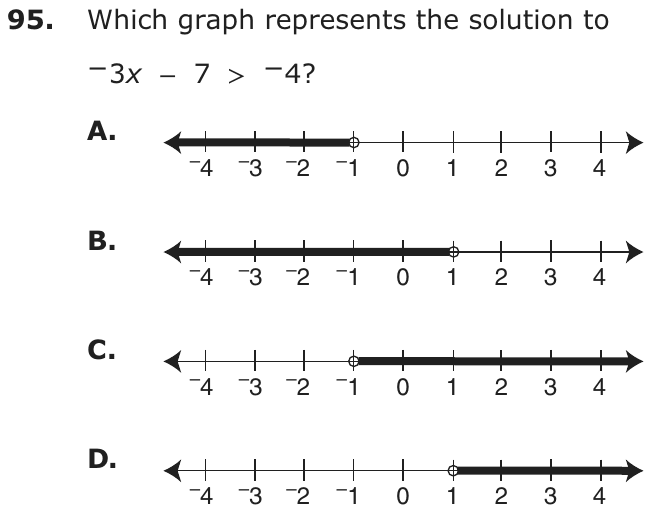
Question 25 of 42
2023 Test A Math, question 51Question
At a carnival, visitors can win a prize if an employee cannot correctly guess their age. The employee records the first 15 ages that he guesses one Saturday. The box plot shown below displays data about the ages he recorded.

What is the interquartile range of the box plot?
- A7
- B9
- C10
- D11
Show the answer
Correct answer: B
Quartile 1 is the median of the lower half of the data, 8.
Quartile 3 is the median of the upper half of the data, 17.
The interquartile range is 9.
Question analysis
This statistics question shows a box plot of 15 ages that a carnival employee guessed and asks for its interquartile range. Students read the quartiles from the edges of the box and subtract. Confusing the interquartile range with the full range, or using the median line in place of a quartile, gives the wrong choices.
- NYS standards
- 7.SP.1 box plots and interquartile range
- Grade level
- Grade 7 content, by NYS standard
- Compared with grade 7
- At grade 7 Reading a box plot and finding its interquartile range is a grade 7 standard in New York. The values sit on labeled whole-number ticks and one subtraction is needed, a routine grade 7 task once the box's edges are known as the quartiles.
- Estimated difficulty
- Straightforward: two steps or one careful reading.
- Thinking it demands
- Depth of knowledge 2, skills and concepts · mainly apply
- What makes it hard
- Solution
- 2 steps
- Reading level
- Question and choices: about grade 6, 48 words.
- Students, last 30 days
- Not enough answers yet to show (it takes 10).
Why it is hard, traps and wrong answers (shows the answer)
Why it is hard
The arithmetic is one subtraction, so the question tests whether students know which parts of a box plot to use. The whiskers' ends give the range, the line inside the box gives the median, and both are easy to grab in place of the quartiles. The story about the carnival and the 15 ages plays no part in the answer.
Something you must already know minor Working it out
The plot shows five values with no labels, so students must know that the box's ends mark the quartiles and that the interquartile range is the box's width, not the whiskers'. (Anderson & Krathwohl, 2001)
Reading a figure, table or graph minor Understanding the question
The values 7, 8, 10, 17 and 18 are read off a scale ticked at every whole number, with the box's ends at 8 and 17 and the median line at 10. (Lesh, Post & Behr, 1987; Kirsch & Mosenthal, 1990)
Strategy: Find the first and third quartiles on the plot by recalling which parts of a box plot mark them, then subtract the smaller quartile from the larger.
Traps
- Wrong formula: Uses a related but wrong formula: perimeter for area, diameter for radius, area for volume, or a misremembered one.
- Misunderstands the concept: A wrong belief about a concept: that percents can be added, that area grows like length, that averages can be averaged, that a bigger denominator means a bigger fraction.
- Information you don't need: The question gives numbers or facts that play no part in the answer.
The wrong answers, classified
A Wrong formula (King et al., 2004)
Subtracts the median from the third quartile, 17 − 10 = 7, measuring only the part of the box right of the middle line.
C Misunderstands the concept (Smith, diSessa & Roschelle, 1993; De Bock et al., 1998; Ni & Zhou, 2005)
Gives the median, 10, read off the line inside the box, taking a single value on the plot for the spread between the quartiles.
D Wrong formula (King et al., 2004)
Subtracts the minimum from the maximum, 18 − 7 = 11, which is the range shown by the whiskers, not the width of the box.
Worked solution, step by step
Formulas used
- Interquartile range
- Q1, the first quartile, is the middle of the lower half of the data. Q3, the third quartile, is the middle of the upper half. In a box plot, Q1 is the left end of the box and Q3 is the right end. So the IQR is the width of the box.
Sort out the question
A box plot shows five numbers. The whiskers, the lines sticking out, end at the smallest and largest values. The box covers the middle half of the data. The line inside the box is the median, the middle value. You need the interquartile range of the ages.
Read the five numbers
Read each one off the number line below the plot.
- Smallest age, the left whisker: 7
- Q1, the left end of the box: 8
- Median, the line inside the box: 10
- Q3, the right end of the box: 17
- Largest age, the right whisker: 18
Find the interquartile range
The interquartile range is 9 years. Watch out: 18 − 7 = 11 is the range, the whole spread from whisker to whisker. That is choice D. The median, 10, is choice C.
So the answer is B, 9.
Check your answer
Count the spaces across the box. From 8 to 17 there are 9 spaces of 1 year each, so the box is 9 years wide. The answer is also less than the whole range, 11, as it must be.
More questions like this
The original DOE question
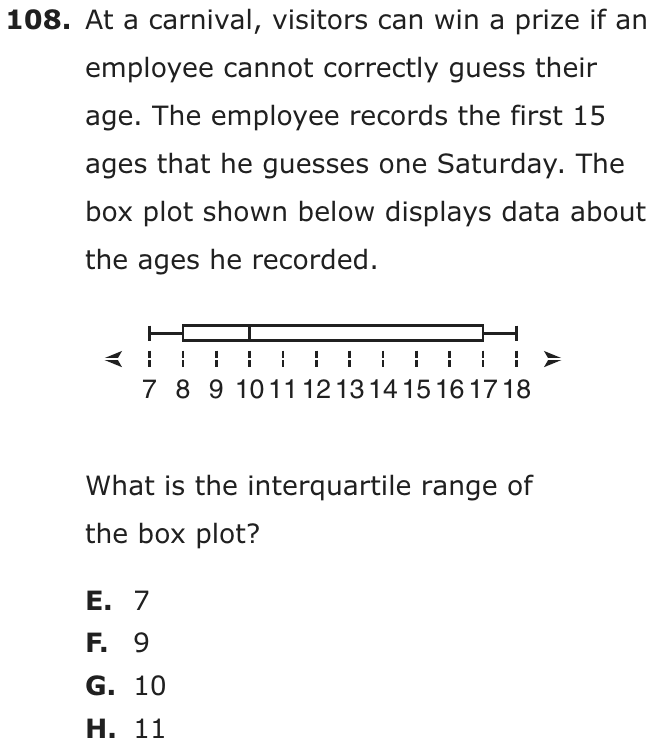
Question 26 of 42
2023 Test A Math, question 56Question

If all possible values of x are indicated by the shaded part of the number line above, which number line best shows all possible values of ?
- A

- B

- C

- D

Show the answer
Correct answer: D
The shaded region goes from to . So, the possible values of would be between the reciprocal of and the reciprocal of , which are 2 and , respectively. Find the number line in the answer options that has a shaded region that ranges from to 2, which is option D.
Question analysis
This number line question shades all possible values of x from one half to three halves and asks which number line shows all possible values of 1/x. Students find reciprocals of fractions and work out how a whole range of values changes. Keeping track of what happens to each end of the range, and placing fractions accurately on the line, makes it tricky.
- NYS standards
- Grade level
- Grade 6 content, by NYS standard
- Compared with grade 7
- Above grade 7 Reciprocals of single fractions are grade 6 work. Applying them to every value in a shaded range at once, and working out where the new range begins and ends, is reasoning about a whole set of numbers that grade 7 classes rarely practice.
- Estimated difficulty
- Hard: combines ideas, needs a plan, and has more than one tempting wrong answer.
- Thinking it demands
- Depth of knowledge 2, skills and concepts · mainly apply
- What makes it hard
- Reading a figure, table or graph moderate
- A very close wrong answer moderate
- Variables instead of numbers minor
- Solution
- 3 steps
- Reading level
- Question and choices: about grade 12, 27 words.
- Students, last 30 days
- Not enough answers yet to show (it takes 10).
Why it is hard, traps and wrong answers (shows the answer)
Why it is hard
Few students have flipped an interval before, so the question rewards testing its two ends and noticing that the order reverses. The harder part comes at the end: 2/3 falls between the tick marks, and a graph ending at the nearby 1/2 tick looks right at a glance. Students who believe a reciprocal is always at least 1, or who shift the interval instead of flipping it, reach the other graphs.
Reading a figure, table or graph moderate Understanding the question
The shaded segment's ends sit on unlabeled half-unit ticks, 1/2 and 3/2, and each choice must be read the same way, with 2/3 falling between ticks rather than on one. (Lesh, Post & Behr, 1987; Kirsch & Mosenthal, 1990)
A very close wrong answer moderate Choosing the answer
The graph from 1/2 to 2 matches the right graph's right end and differs at the left end by only a sixth of a unit, 1/2 against 2/3. (Embretson & Wetzel, 1987; Gorin & Embretson, 2006; Ascalon et al., 2007)
Variables instead of numbers minor Understanding the question
The question asks about 1/x for every x in a range, so a whole interval must be transformed, and its ends swap: the smallest x gives the largest 1/x. (Koedinger & Nathan, 2004; Enright, Morley & Sheehan, 2002)
Strategy: Take the reciprocal of each end of the shaded part, ask whether a bigger x gives a bigger or a smaller 1/x, and look for the graph whose endpoints are exactly those values.
Traps
- Misreads the figure: Reads a value, label or tick spacing in a figure, table or graph wrongly.
- Misunderstands the concept: A wrong belief about a concept: that percents can be added, that area grows like length, that averages can be averaged, that a bigger denominator means a bigger fraction.
- Wrong operation: Adds instead of multiplying, divides the wrong way round, turns a ratio or rate upside down, or undoes a step in the wrong direction (subtracts what should be added back).
The wrong answers, classified
A Wrong operation (Hegarty, Mayer & Monk, 1995; King et al., 2004)
Adds 1 to each endpoint instead of taking reciprocals, sliding the shaded part from 1/2–3/2 one unit right, to 3/2–5/2.
B Misunderstands the concept (Smith, diSessa & Roschelle, 1993; De Bock et al., 1998; Ni & Zhou, 2005)
Gets 2 from 1/2 but assumes a reciprocal cannot be less than 1, as flipping a proper fraction suggests, so it starts the shading at 1 instead of 2/3.
C Misreads the figure (Lesh, Post & Behr, 1987; Kirsch & Mosenthal, 1990)
Finds the reciprocals 2/3 and 2 but places 2/3 at the half-unit tick, 1/2, though 2/3 lies a third of the way from that tick toward 1.
Worked solution, step by step
Formulas used
- Reciprocal
- a and b are the top and bottom of a fraction. The reciprocal flips the fraction upside down. The number 1 over x is the reciprocal of x. A number times its reciprocal always makes 1.
Sort out the question
x can be any number in the shaded part of the first number line. You need the number line that shows every possible value of , the reciprocal of x. The reciprocal is the number flipped upside down, like for 2.
Read the shaded part
The ticks come every half unit. The shading starts at the tick halfway between 0 and 1, which is . It ends halfway between 1 and 2, which is , or . Both dots are filled in, so both ends count.
Find the reciprocals of the ends
Flip each end of the shaded part.
So the ends of the new shading are 2 and .
Notice that the ends swap
When x gets bigger, gets smaller. So the smallest x, , gives the biggest value, 2. The biggest x, , gives the smallest, . So runs from to 2, ends included.
Find the matching number line
lies between the half tick and 1, a third of the way from to 1. Line D starts there and ends at 2. Watch out: line C starts at the half tick, , not at . Line B starts at 1.
So the answer is D, the line shaded from to 2.
Check your answer
Test a value in the middle. x = 1 is shaded, and . On line D, 1 is shaded too. Test an end: , so really is the reciprocal of .
More questions like this
The original DOE question
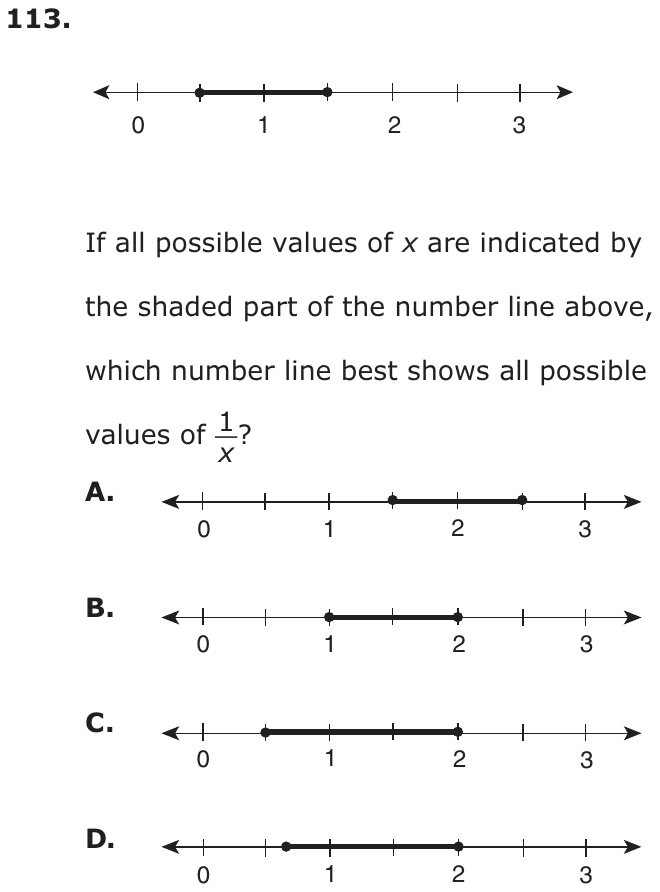
Question 27 of 42
2023 Test B Math, question 10Question
A total of 24 students in a math class took a 100-point test:
- None of the students scored 100 points.
- 75% of the students scored less than 82 points.
- The lowest score in the class was 54 points.
Which box plot best represents the test scores from this math class?
- A
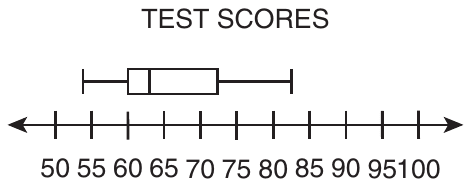
- B
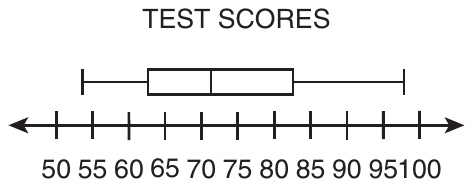
- C
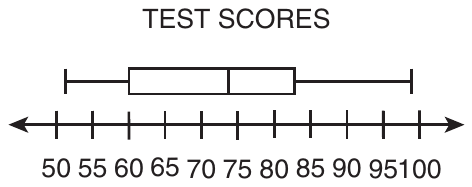
- D
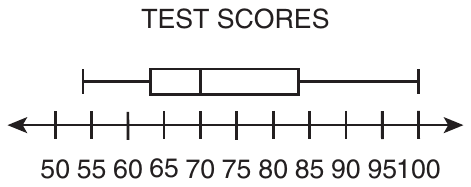
Show the answer
Correct answer: B
Use the information in the bullet points to reason which box plot could represent the data set of test scores.
Since none of the students scored 100, the maximum value on the box plot must be less than 100.
If 75% of the students scored less than 82, then 25% scored 82 points or more. Since the third quartile (Q3) indicates (75%) of the data is to the left and (25%) of the data is to the right, it is reasonable that Q3 would be at or about 82.
Given that the lowest score in the class was 54, the minimum point on the box plot must be 54.
The box plot graph in option B is the only one that meets all three criteria.
Question analysis
Twenty-four students took a 100-point test: nobody scored 100, 75% scored below 82, and the lowest score was 54. Students choose the box plot that fits all three facts. The skill is linking each statement to a part of the plot, the whiskers, the box and the quartiles, and checking every plot closely.
- NYS standards
- 7.SP.1 box plots and interquartile range
- Grade level
- Grade 7 content, by NYS standard
- Compared with grade 7
- At grade 7 Grade 7 students usually read values off a box plot. This item runs the other way, turning a percent statement into a quartile and checking the whiskers against two more facts, but the content stays at grade 7.
- Estimated difficulty
- Moderate: several steps, or a close reading with one strong distractor.
- Thinking it demands
- Depth of knowledge 2, skills and concepts · mainly analyze
- What makes it hard
- Every choice must be checked moderate
- Reading a figure, table or graph moderate
- Something you must already know minor
- Solution
- 3 steps
- Reading level
- Question and choices: about grade 2, 45 words.
- Students, last 30 days
- Not enough answers yet to show (it takes 10).
Why it is hard, traps and wrong answers (shows the answer)
Why it is hard
The question turns three sentences into three features of a box plot, and a plot that matches two of them is easy to accept. The upper-quartile fact is the conceptual one: students who do not know that the box’s right edge marks 75 percent put 82 at the end of the whisker. The other two facts are quick visual checks, but only if every plot is actually checked.
Every choice must be checked moderate Choosing the answer
Each wrong plot fails a different fact, so all four must be tested against all three bullets: the left whisker against 54, the right whisker against 100, and the box’s right edge against 82. (Embretson & Wetzel, 1987)
Reading a figure, table or graph moderate Understanding the question
The axis is labeled every 5 points, and the deciding features fall between labels: one left whisker starts near 51 instead of 54, and box edges sit near 82.5. (Lesh, Post & Behr, 1987; Kirsch & Mosenthal, 1990)
Something you must already know minor Working it out
Nothing explains that “75% of the students scored less than 82” locates the upper quartile, the right edge of the box, rather than the highest score. (Anderson & Krathwohl, 2001)
Strategy: Turn each fact into a feature to check: where the left whisker starts, where the right whisker ends, and where the box ends. Rule out any plot that breaks one.
Traps
- Misreads the question: Misses or misreads a condition or a word in the question: "at least", "each", "remaining", "not".
- Misunderstands the concept: A wrong belief about a concept: that percents can be added, that area grows like length, that averages can be averaged, that a bigger denominator means a bigger fraction.
- Misreads the figure: Reads a value, label or tick spacing in a figure, table or graph wrongly.
The wrong answers, classified
A Misunderstands the concept (Smith, diSessa & Roschelle, 1993; De Bock et al., 1998; Ni & Zhou, 2005)
Puts 82 at the end of the right whisker, as if it were the highest score, when 75 percent below 82 marks the box’s right edge.
C Misreads the figure (Lesh, Post & Behr, 1987; Kirsch & Mosenthal, 1990)
Accepts the left whisker as starting at the lowest score, 54, when it begins near 51, just past the 50 tick.
D Misreads the question (Hegarty, Mayer & Monk, 1995)
Matches the lowest score and the box’s right edge near 82 but overlooks that a whisker reaching 100 means someone scored 100.
Worked solution, step by step
Formulas used
- Parts of a box plot
- A box plot shows five numbers. The left whisker starts at the minimum, the lowest value. The box starts at Q1, the first quartile, and ends at Q3, the third quartile. The line inside is the median, the middle value. The right whisker ends at the maximum. About a quarter of the data falls in each of the four sections.
Sort out the question
24 students took a test. You know three facts. Nobody scored 100. 75% scored less than 82. The lowest score was 54. You need the box plot that fits all three facts.
Turn each fact into a feature
Match each fact to a part of the box plot.
- The lowest score is 54, so the left whisker starts at 54.
- Nobody scored 100, so the right whisker ends before 100.
- 75% is three quarters. Three quarters of the scores are below Q3. So the box should end at about 82.
Read the number line
The ticks are 5 points apart: 50, 55, 60 and so on. A score of 54 sits just left of the 55 tick. A score of 82 sits a little less than halfway from 80 to 85. Look closely, because these points fall between labels.
Check plot A
In plot A, the right whisker ends near 82, and the box ends near 72. That would make 82 the highest score. Watch out: 75% below 82 does not make 82 the top score. It tells you where the box ends. So A is out.
Check plot C
In plot C, the left whisker starts near 51, just right of the 50 tick. But the lowest score was 54. So C is out.
Check plot D
Plot D starts at 54, and its box ends near 82. But its right whisker reaches 100. That means someone scored 100, and nobody did. Watch out: D fits two facts, so it is easy to stop early. Check all three. So D is out.
Check plot B and answer
Plot B starts at 54. Its box ends near 82. Its right whisker stops near 98, below 100. It fits all three facts. So the answer is B.
Check your answer
Go over B once more with all three facts. Its lowest point is 54. Its box ends near 82. Its highest point is under 100. Each other plot breaks one fact: A’s box, C’s left whisker and D’s right whisker.
More questions like this
The original DOE question
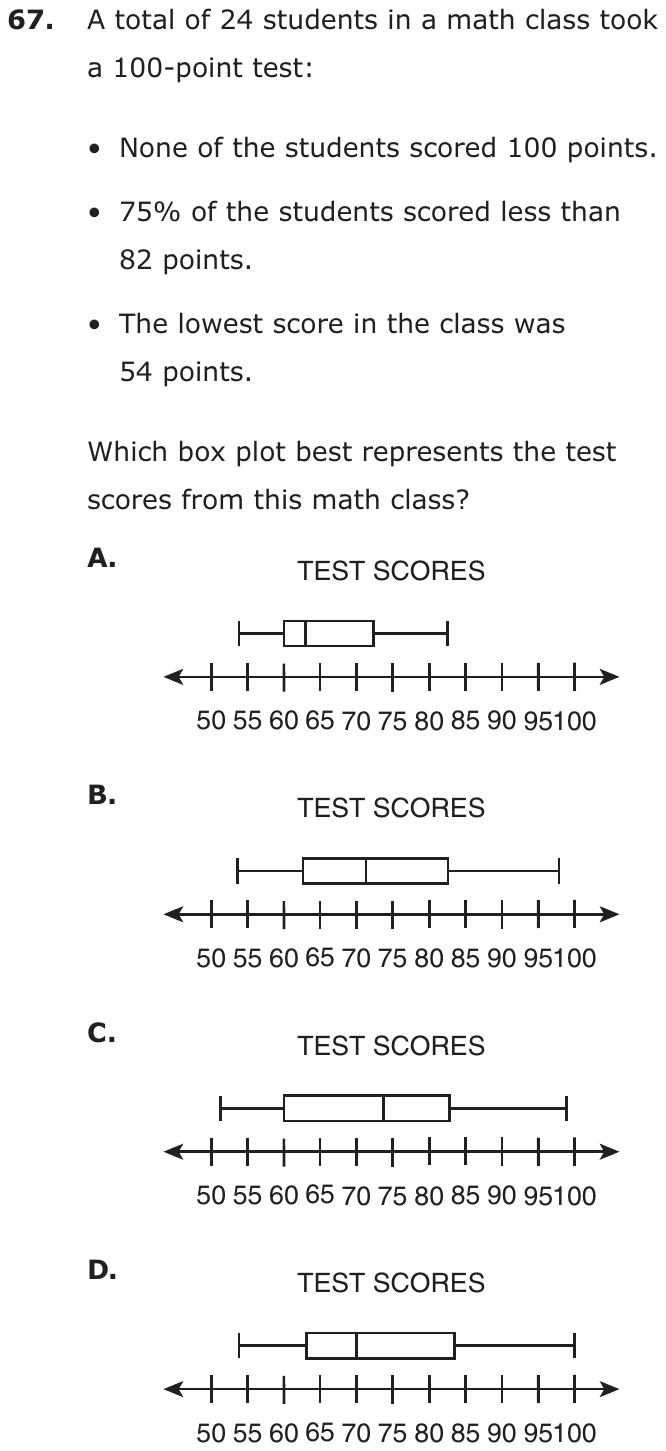
Question 28 of 42
2023 Test B Math, question 22Question
A vendor is selling 10 packages of homemade fudge at a bake sale. The vendor weighed and labeled each package. The package weights are given in ounces:
| 4.6 | 6.0 | 3.8 | 3.5 | 4.5 |
| 5.4 | 3.9 | 6.5 | 4.8 | 6.2 |
The vendor created a box plot of the package weights. Which box plot best represents the data?
- A
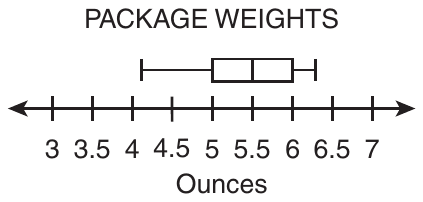
- B
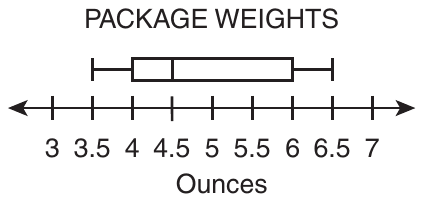
- C
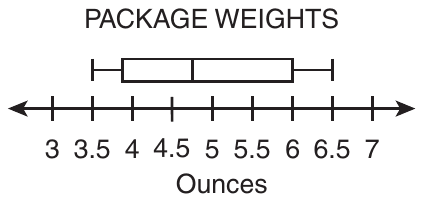
- D
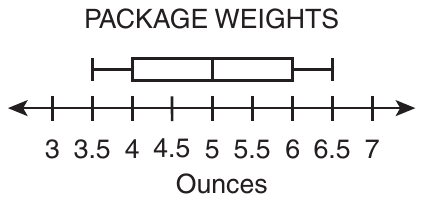
Show the answer
Correct answer: C
A set of 10 data points is given. The first step for determining the quartiles and minimum and maximum values of the box plot is to order the data from smallest to greatest value. For this data set the order is:
| 3.5 | 3.8 | 3.9 | 4.5 | 4.6 |
| 4.8 | 5.4 | 6.0 | 6.2 | 6.5 |
The minimum value is the smallest decimal, 3.5, and the maximum value is the greatest decimal, 6.5.
To determine the median in a set with an even number of values, locate the two middle values (5th and 6th in this case): 4.6 and 4.8. Determine the mean, or average, of the two middle numbers by adding them together and dividing the sum by 2:
To determine the value of the first quartile (Q1), locate the middle value of the 5 terms to the left of the median:
| 3.5 | 3.8 | 3.9 | 4.5 | 4.6 |
To determine the value of the third quartile (Q3), locate the middle value of the 5 terms to the right of the median:
| 4.8 | 5.4 | 6.0 | 6.2 | 6.5 |
Box plot C identifies the correct minimum, maximum, median, and quartiles of the data set.
Question analysis
A vendor weighs 10 packages of homemade fudge, from 3.5 to 6.5 ounces, and makes a box plot of the weights. Students choose the box plot that matches the data. They must sort the decimals, find the median of an even number of values and both quartiles, then compare plots that differ only slightly.
- Grade level
- Grade 7 content, by NYS standard
- Compared with grade 7
- Above grade 7 Building a box plot from data is grade 7 content. This version needs all five summary values from ten unsorted decimals, including a median between two values, then a close comparison of plots, longer and finer than typical.
- Estimated difficulty
- Hard: combines ideas, needs a plan, and has more than one tempting wrong answer.
- Thinking it demands
- Depth of knowledge 2, skills and concepts · mainly apply
- What makes it hard
- Many steps moderate
- A very close wrong answer moderate
- Reading a figure, table or graph moderate
- Slow to do carefully minor
- Solution
- 4 steps
- Reading level
- Question and choices: about grade 4, 43 words.
- Students, last 30 days
- Not enough answers yet to show (it takes 10).
Why it is hard, traps and wrong answers (shows the answer)
Why it is hard
Most of the work happens before the plots are even read: the weights must be sorted, and the median of ten values is the average of two of them. After that, three plots look almost identical, so a careless median, taken from the unsorted list or placed halfway between the extremes, settles on a wrong one. The careful student checks the median line and the box’s left edge against values that fall between the tick marks.
Many steps moderate Working it out
Ten unsorted decimals must be ordered, then five values found: the median as the mean of the fifth and sixth, 4.6 and 4.8, and each quartile as the middle of its half. (Daniel & Embretson, 2010; Enright, Morley & Sheehan, 2002)
A very close wrong answer moderate Choosing the answer
Three plots share whiskers at 3.5 and 6.5 and a box ending at 6; they differ only in the median line, at 4.5, near 4.75 or at 5, and in where the box starts. (Embretson & Wetzel, 1987; Gorin & Embretson, 2006; Ascalon et al., 2007)
Reading a figure, table or graph moderate Understanding the question
The axis is ticked every half ounce, and the correct plot’s median, 4.7, and lower quartile, 3.9, both fall between ticks, so each line’s position must be judged by eye. (Lesh, Post & Behr, 1987; Kirsch & Mosenthal, 1990)
Slow to do carefully minor Choosing the answer
Sorting ten decimals, computing a five-number summary and comparing four plots takes well over a minute and a half when done carefully. (Lu & Sireci, 2007)
Strategy: Sort the ten weights, then find the least and greatest, the median as the mean of the fifth and sixth values, and each quartile as the middle of its half.
Traps
- Wrong formula: Uses a related but wrong formula: perimeter for area, diameter for radius, area for volume, or a misremembered one.
- A faulty procedure: A systematic but wrong procedure: adding fractions straight across, applying an exponent to each term of a sum, dropping a sign when moving a term.
The wrong answers, classified
A Little reason to choose it (Haladyna & Downing, 1993; Rodriguez, 2005)
No working from these weights gives whiskers near 4.1 and 6.3 or a median of 5.5, since the data run from 3.5 to 6.5, so it mostly draws guesses.
B A faulty procedure (Brown & Burton, 1978; Tatsuoka, 1983)
Skips sorting and takes 4.5, the fifth weight as printed, for the median, so the plot with its median line on 4.5 seems to fit.
D Wrong formula (King et al., 2004)
Finds the median with the midrange formula, (3.5 + 6.5) ÷ 2 = 5, halfway between the lightest and heaviest packages instead of the middle of the sorted weights.
Worked solution, step by step
Formulas used
- Median of an even number of values
- First put the values in order. With an even number of values, two sit in the middle. The median is their mean, or average: add them and divide by 2. The median splits the data in half.
- Quartiles
- Q1 is the first quartile and Q3 is the third quartile. Split the ordered data in half at the median. Q1 is the middle of the lower half, and Q3 is the middle of the upper half. A box plot’s box runs from Q1 to Q3.
Sort out the question
The vendor weighed 10 packages of fudge, in ounces. You need the box plot that matches the weights. A box plot is built from five numbers. They are the minimum (least), the first quartile Q1, the median, the third quartile Q3 and the maximum (greatest). So find those five numbers first.
Put the weights in order
List the 10 weights from least to greatest.
3.5 3.8 3.9 4.5 4.6 4.8 5.4 6.0 6.2 6.5 Watch out: you must sort first. The fifth weight as printed is 4.5. Using it as the median points to choice B.
Find the least and greatest
The minimum is 3.5 ounces and the maximum is 6.5 ounces. So the whiskers must run from 3.5 to 6.5. Plot A’s whiskers run from about 4.1 to about 6.3, so A is out.
Find the median
With 10 weights, the two middle ones are the 5th and 6th: 4.6 and 4.8.
The median is 4.7 ounces. Watch out: the median is not halfway between the least and greatest. That gives and points to choice D.
Find the two quartiles
The lower half is the 5 weights below the median: 3.5, 3.8, 3.9, 4.5 and 4.6. Its middle value is .
The upper half is the 5 weights above the median: 4.8, 5.4, 6.0, 6.2 and 6.5. Its middle value is .
Match the summary to a plot
The five numbers are 3.5, 3.9, 4.7, 6.0 and 6.5. Plots B, C and D all run from 3.5 to 6.5, and their boxes end at 6. They differ in the median line and where the box starts.
- B: the box starts at 4, and the median line is at 4.5.
- D: the box starts at 4, and the median line is at 5.
- C: the box starts just left of 4, and the median line is between 4.5 and 5.
C is the closest match to a Q1 of 3.9 and a median of 4.7. So the answer is C.
Check your answer
A median splits the data in half. Five weights, 3.5 to 4.6, are below 4.7. Five, 4.8 to 6.5, are above it. A median line at 5, as in D, would have six weights below it. A line at 4.5, as in B, would have only three below it.
More questions like this
The original DOE question
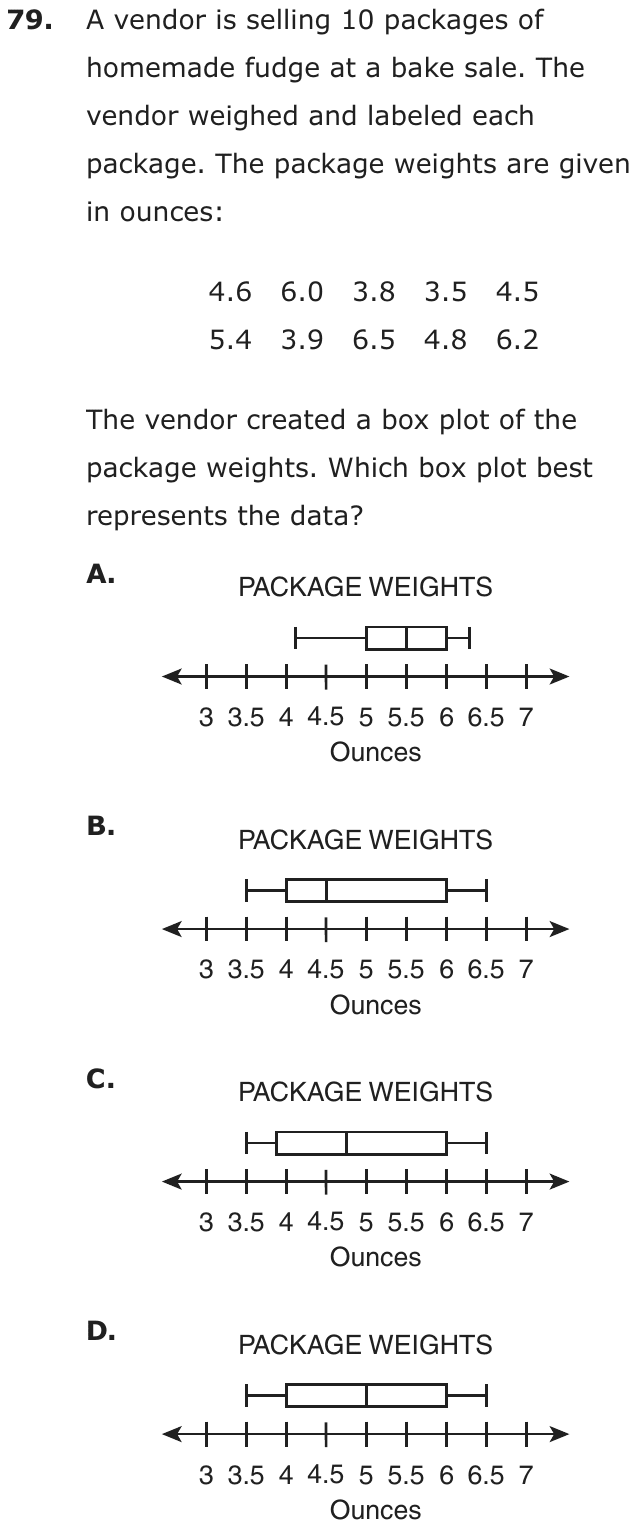
Question 29 of 42
2023 Test B Math, question 26Question
The box plot below represents a set of data.

What is the interquartile range of the set of data?
- A9
- B12
- C21
- D27
Show the answer
Correct answer: C
First, determine the values of the upper and lower quartiles of the set of data:
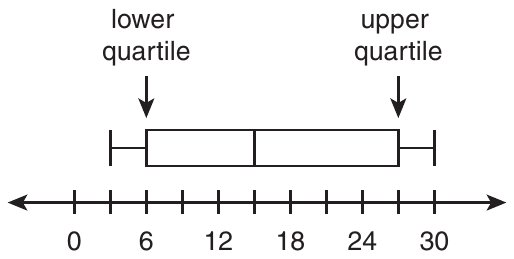
- The upper quartile value is indicated by the vertical line segment at the far right edge of the box plot above the hash mark representing 27.
- The lower quartile value is indicated by the vertical line segment at the far left edge of the box plot above the hash mark representing 6.
To determine the interquartile range, subtract the lower quartile value (6) from the upper quartile value (27):
Question analysis
A box plot on a number line marked every 3 units, with labels every 6, represents a set of data. Students find the interquartile range. They have to read the two ends of the box, one of which falls on an unlabeled tick, and remember exactly which part of the plot the interquartile range measures.
- NYS standards
- 7.SP.1 box plots and interquartile range
- Grade level
- Grade 7 content, by NYS standard
- Compared with grade 7
- At grade 7 Finding the interquartile range from a box plot is a grade 7 skill, and this is a typical example. Read two values and subtract; the only extra care is a box edge that falls on a tick with no label.
- Estimated difficulty
- Straightforward: two steps or one careful reading.
- Thinking it demands
- Depth of knowledge 1, recall and reproduction · mainly apply
- What makes it hard
- Solution
- 2 steps
- Reading level
- Question and choices: about grade 6, 19 words.
- Students, last 30 days
- Not enough answers yet to show (it takes 10).
Why it is hard, traps and wrong answers (shows the answer)
Why it is hard
Once the two edges of the box are read, one subtraction finishes the question, so the work is reading the scale and knowing which part of the plot is meant. The upper quartile falls on an unlabeled tick, which costs care. The wrong answers measure the whole spread or only half of the box, all common mix-ups of what the interquartile range covers.
Reading a figure, table or graph moderate Understanding the question
The axis is labeled only every 6 units but ticked every 3, and the box’s right edge sits on the unlabeled tick for 27, so it has to be counted from 24. (Lesh, Post & Behr, 1987; Kirsch & Mosenthal, 1990)
Something you must already know minor Working it out
Nothing defines the interquartile range; it is the width of the box, the upper quartile minus the lower, not the span of the whiskers. (Anderson & Krathwohl, 2001)
Strategy: Find the values at the left and right edges of the box, counting tick marks in steps of 3 where there is no label, and subtract the smaller from the larger.
Traps
- Wrong formula: Uses a related but wrong formula: perimeter for area, diameter for radius, area for volume, or a misremembered one.
The wrong answers, classified
A Wrong formula (King et al., 2004)
Gives the median minus the lower quartile, 15 − 6 = 9, as the interquartile range, measuring only the left part of the box.
B Wrong formula (King et al., 2004)
Gives the upper quartile minus the median, 27 − 15 = 12, as the interquartile range, measuring only the right part of the box.
D Wrong formula (King et al., 2004)
Subtracts the ends of the whiskers, 30 − 3 = 27, giving the range of the data instead of the interquartile range.
Worked solution, step by step
Formulas used
- Interquartile range
- IQR stands for interquartile range. Q3, the third quartile, is the right edge of a box plot’s box. Q1, the first quartile, is the left edge. Subtracting gives the width of the box, where the middle half of the data lies.
Sort out the question
You see a box plot and need the interquartile range, or IQR. That is the width of the box: the upper quartile minus the lower quartile. The whiskers don’t matter here.
Read the number line
The labels are 0, 6, 12, 18, 24 and 30. But there is a tick mark halfway between each pair of labels. So the ticks go up by 3: 0, 3, 6, 9 and so on. The tick between 24 and 30 stands for 27.
Find the edges of the box
The left edge of the box is at 6. That is the lower quartile, Q1. The right edge is at the unlabeled tick after 24, which is 27. That is the upper quartile, Q3.
Subtract to find the IQR
Watch out: uses the ends of the whiskers. That is the range, choice D. Also, the median line at 15 splits the box. and are each only part of the box. So the answer is C, 21.
Check your answer
Count the tick spaces across the box, from 6 to 27. There are 7 spaces, and each is worth 3. So the box is units wide. That matches.
More questions like this
The original DOE question
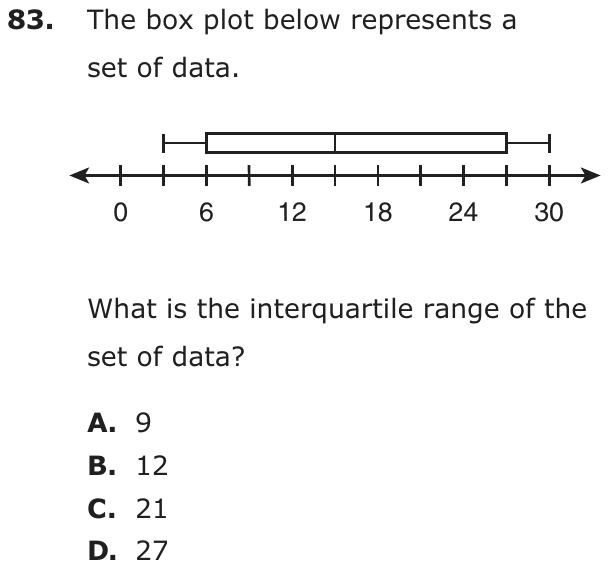
Question 30 of 42
2023 Test B Math, question 32Question

On the number line above, how many units longer is than ?
- A
- B
- C
- D3
Show the answer
Correct answer: B
First, find the lengths of the given segments:
Then, find the difference:
Question analysis
A number line shows three points labeled with mixed numbers and a whole number, and students find how many units longer one segment is than another. It tests subtracting mixed numbers with unlike denominators to find distances. Regrouping when the fraction being subtracted is the larger one is where most errors happen.
- Grade level
- Grade 7 content, by NYS standard
- Compared with grade 7
- At grade 7 Finding distances between points on a number line is grade 7 work. Here the points are mixed numbers with different denominators, so finding two distances and their difference makes it a typical but careful grade 7 task.
- Estimated difficulty
- Straightforward: two steps or one careful reading.
- Thinking it demands
- Depth of knowledge 2, skills and concepts · mainly apply
- What makes it hard
- Error-prone arithmetic moderate
- Reading a figure, table or graph minor
- Solution
- 3 steps
- Reading level
- Question and choices: about grade 9, 16 words.
- Students, last 30 days
- Not enough answers yet to show (it takes 10).
Why it is hard, traps and wrong answers (shows the answer)
Why it is hard
This is three subtractions, so most errors are in the fractions rather than the plan. Taking 1 1/3 from a whole number such as 3 tempts students to subtract only the whole parts and keep the 1/3, which reverses which segment looks longer. Rewriting every coordinate in sixths, 8/6, 18/6 and 31/6, turns the work into whole-number subtraction of numerators.
Error-prone arithmetic moderate Working it out
Both lengths subtract mixed numbers with different denominators, 5 1/6 − 3 and 3 − 1 1/3, and the second needs regrouping before the two results are compared in sixths. (Brown & Burton, 1978; Junker & Sijtsma, 2001)
Reading a figure, table or graph minor Understanding the question
The three coordinates come from the labels under P, Q and R, and the segments QR and PQ must each be measured from Q at 3, the point they share. (Lesh, Post & Behr, 1987; Kirsch & Mosenthal, 1990)
Strategy: Find each length by subtracting the left endpoint from the right one, writing the mixed numbers in sixths, then subtract the shorter length from the longer.
Traps
- A faulty procedure: A systematic but wrong procedure: adding fractions straight across, applying an exponent to each term of a sum, dropping a sign when moving a term.
- Numbers taken from the question: Combines the numbers in the question without a model of the situation, or is simply a number that appears in the question.
The wrong answers, classified
A A faulty procedure (Brown & Burton, 1978; Tatsuoka, 1983)
Subtracts only the whole numbers in 3 − 1 1/3 and keeps the 1/3, giving PQ as 2 1/3, then compares it with 2 1/6 and gets 1/6.
C Little reason to choose it (Haladyna & Downing, 1993; Rodriguez, 2005)
No common working gives 2/3; it is only the fraction part of PQ’s length, 1 2/3, so it mostly draws guesses.
D Numbers taken from the question (Hegarty, Mayer & Monk, 1995)
Picks 3, the coordinate of point Q, a number read off the line rather than a difference between two lengths.
Worked solution, step by step
Formulas used
- Length on a number line
- The length of a segment is the distance between its two end points. Subtract the number on the left from the number on the right. Subtracting tells how many units you move to get from one point to the other.
- Mixed number to improper fraction
- a is the whole number part. b over c is the fraction part, with b on top and c on the bottom. Each whole holds c parts, so a wholes hold a × c parts. Then add the b extra parts. An improper fraction has a top bigger than its bottom.
Read the number line
Point P is at . Point Q is at 3. Point R is at .
The bar over QR means segment QR, the piece of the line from Q to R. You need how much longer QR is than PQ. So find both lengths, then subtract.
Find the length of QR
R is on the right, and Q is on the left. Use the length rule.
QR is units long.
Find the length of PQ
Q is on the right, and P is on the left.
Take it in two parts. First, 3 − 1 = 2. Then take away the extra . That gives . So PQ is units long.
Watch out: Don’t just do 3 − 1 and keep the . That gives , which is too long. It leads to choice A.
Write both lengths in sixths
The fractions have different bottoms, 6 and 3. Change both lengths to sixths so you can subtract. Use the mixed number rule.
Subtract the lengths
Take the shorter length away from the longer one.
QR is unit longer than PQ.
So the answer is B, .
Check your answer
Write every point in sixths. P is , Q is and R is . QR is 31 − 18 = 13 sixths. PQ is 18 − 8 = 10 sixths. The difference is 3 sixths, which is one half.
More questions like this
The original DOE question
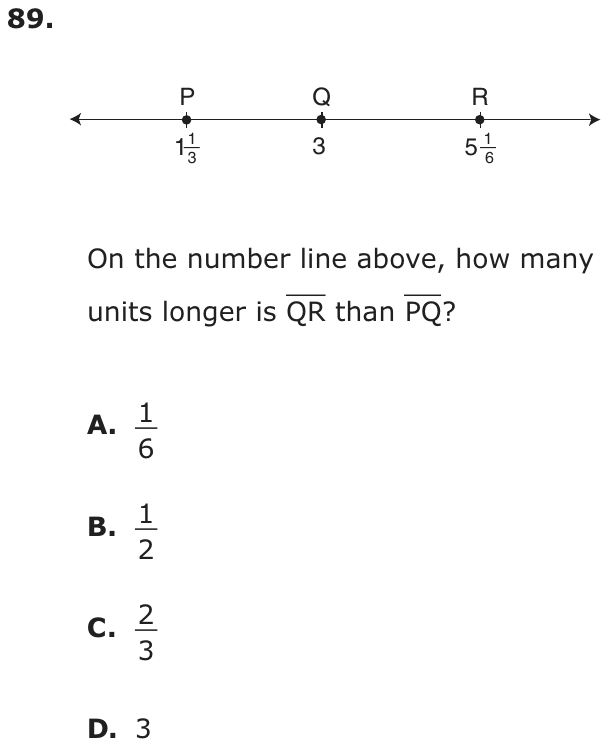
Question 31 of 42
2023 Test B Math, question 56Question
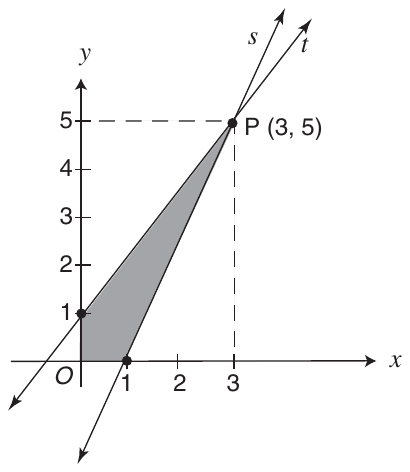
Lines s and t intersect at point P (3, 5). What is the area, in square units, of the shaded region in the graph above?
- A2
- B3
- C4
- D7
Show the answer
Correct answer: C
First, find the area of the rectangle in the graph:
Then, find the areas of the two right triangles that are not shaded:
Upper triangle:
Lower triangle:
The area of the shaded region, in square units, is calculated by subtracting the total area of the two right triangles from the area of the rectangle:
Question analysis
Two lines meet at the point (3, 5) on a coordinate grid, and the shaded region between them and the axes is a four-sided shape. Students find its area in square units. The shape is not a standard figure, so no single area formula applies to it directly.
- Grade level
- Grade 6 content, by NYS standard
- Compared with grade 7
- At grade 7 Areas of triangles and rectangles are grade 6 content, and grade 7 students often find composite areas. This region is an irregular four-sided shape with two slanted sides, so students need a plan, and the lengths come from coordinates rather than labels.
- Estimated difficulty
- Moderate: several steps, or a close reading with one strong distractor.
- Thinking it demands
- Depth of knowledge 2, skills and concepts · mainly apply
- What makes it hard
- No obvious method moderate
- Reading a figure, table or graph moderate
- Many steps minor
- Solution
- 4 steps
- Reading level
- Question and choices: about grade 4, 23 words.
- Students, last 30 days
- Not enough answers yet to show (it takes 10).
Why it is hard, traps and wrong answers (shows the answer)
Why it is hard
The question rewards a plan more than computation: the region has no name, so students must see it inside the dashed rectangle from O to P, with two right triangles cut away. Reading each triangle’s legs from the axes is the second hurdle, since the 1-unit intercepts shorten one leg of each, to 4 instead of 5 and to 2 instead of 3. Only one wrong choice, from using one coordinate as both heights, has a clear working behind it, so most errors here are guesses after a failed plan.
No obvious method moderate Working it out
The shaded shape has four sides, two of them slanted, and no formula of its own; it must be boxed in the 3-by-5 rectangle with two triangles removed, or cut along OP. (Schoenfeld, 1985)
Reading a figure, table or graph moderate Understanding the question
No lengths are labeled; every one comes from the coordinates of P (3, 5), the y-intercept 1 of line s and the x-intercept 1 of line t. (Lesh, Post & Behr, 1987; Kirsch & Mosenthal, 1990)
Many steps minor Working it out
The rectangle, two triangle areas and a subtraction make four computations, 15, 6 and 5, then 15 − 11, each built from different coordinates. (Daniel & Embretson, 2010; Enright, Morley & Sheehan, 2002)
Strategy: Draw the rectangle from O to P, find the areas of the two unshaded right triangles inside it from the coordinates, and subtract both from the rectangle's area.
Traps
- Misreads the figure: Reads a value, label or tick spacing in a figure, table or graph wrongly.
The wrong answers, classified
A Little reason to choose it (Haladyna & Downing, 1993; Rodriguez, 2005)
No common working gives 2; no rectangle or triangle built from the coordinates leaves that area, so it mostly draws students who judge the narrow region by eye.
B Misreads the figure (Lesh, Post & Behr, 1987; Kirsch & Mosenthal, 1990)
Cuts the region along OP into two triangles with bases of 1 but uses 3, the x-coordinate of P, as the height of both: 1.5 + 1.5 = 3.
D Little reason to choose it (Haladyna & Downing, 1993; Rodriguez, 2005)
No common working gives 7; half of the 3-by-5 rectangle, 7.5, comes closest, so it mostly draws students who guess the region fills about half.
Worked solution, step by step
Formulas used
- Area of a rectangle
- A is the area, in square units. l is the length and w is the width. Multiplying them counts the unit squares that fill the rectangle.
- Area of a triangle
- A is the area. b is the base, one side. h is the height: the distance from the base straight up to the far corner. A right triangle has a square corner, and the two sides that meet there are the base and height. A triangle is half of a rectangle with the same base and height.
Sort out the shaded region
The shaded region has four corners: O at (0, 0), (0, 1) on the y-axis, P at (3, 5), and (1, 0) on the x-axis. Line t meets the y-axis at (0, 1), and line s meets the x-axis at (1, 0). There is no easy formula for this shape. But the dashed lines make a rectangle around it. So find the rectangle’s area and take away the white parts.
Find the rectangle’s area
The rectangle has corners O, (3, 0), P and (0, 5). It is 3 units wide and 5 units tall.
The rectangle’s area is 15 square units.
Find the upper triangle’s area
The white triangle at the top left has corners (0, 1), (0, 5) and P. Its square corner, or right angle, is at (0, 5). One side runs up the y-axis from 1 to 5, so it is 4 units. The other runs across from 0 to 3, so it is 3 units.
Its area is 6 square units.
Find the lower triangle’s area
The white triangle at the bottom right has corners (1, 0), (3, 0) and P. Its square corner is at (3, 0). One side runs along the x-axis from 1 to 3, so it is 2 units. The other goes up from 0 to 5, so it is 5 units.
Its area is 5 square units.
Watch out: The lines cross the axes at 1, not at O. So these sides are 4 and 2, not 5 and 3.
Subtract the white triangles
Take both triangles away from the rectangle.
The shaded area is 4 square units.
So the answer is C, 4.
Check your answer
Cut the shaded region along a line from O to P. One piece has a base of 1 on the x-axis and a height of 5, since P is 5 units up. Its area is 2.5. The other has a base of 1 on the y-axis and a height of 3, since P is 3 units across. Its area is 1.5. Then 2.5 + 1.5 = 4. Using 3 for both heights gives 3, choice B.
More questions like this
The original DOE question
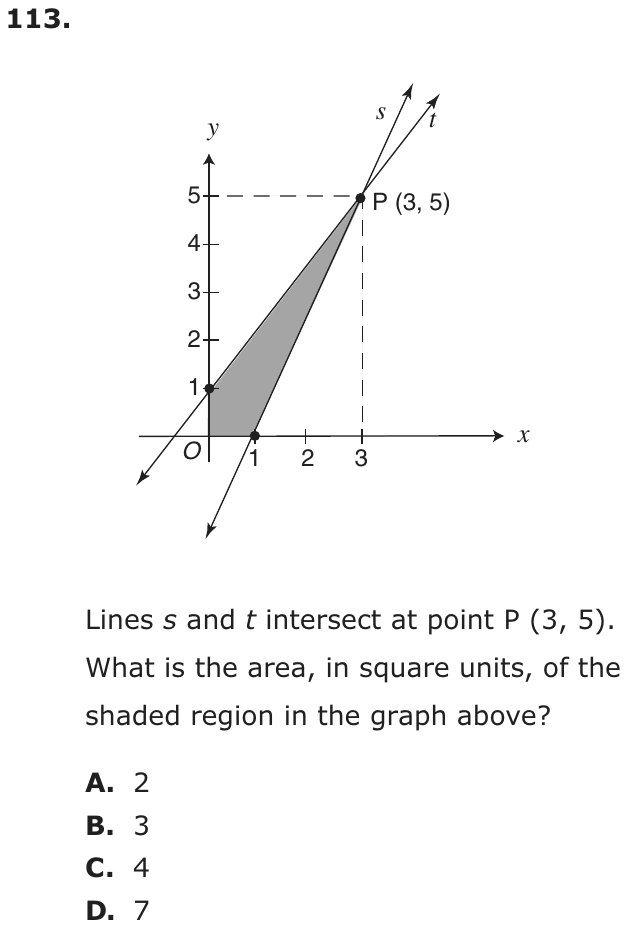
Question 32 of 42
2018 Test A Math, question 14Question
Which number line below shows the solution to the inequality ?
- A

- B

- C

- D

Show the answer
Correct answer: D
Multiply each term by 2 to eliminate the fraction, and isolate :
Therefore, must be between −8 and 4.
Question analysis
An inequality question: choose the number line that shows the solution of a compound inequality in which x divided by 2 lies between −4 and 2. Students undo the division in every part and match the graph's endpoints and shading. The four number lines differ in their endpoints and in which part of the line is shaded.
- Grade level
- Grade 7 content, by NYS standard
- Compared with grade 7
- At grade 7 Grade 7 students solve two-step inequalities and graph them on a number line. This compound inequality needs only one operation applied to all three parts at once, so it matches typical grade 7 work.
- Estimated difficulty
- Straightforward: two steps or one careful reading.
- Thinking it demands
- Depth of knowledge 1, recall and reproduction · mainly apply
- What makes it hard
- Reading a figure, table or graph moderate
- Error-prone arithmetic minor
- Solution
- 2 steps
- Reading level
- Question and choices: about grade 11, 11 words.
- Students, last 30 days
- Not enough answers yet to show (it takes 10).
Why it is hard, traps and wrong answers (shows the answer)
Why it is hard
Solving takes one step, multiplying through by 2, so most of the work is matching the result to a picture. The choices pair each common slip with a graph: the bounds left as written, the bounds halved, and the right bounds shaded on the wrong side. Reading the open circles against the labeled ticks at −5 and 5 settles it.
Reading a figure, table or graph moderate Understanding the question
The four number lines are labeled only at −10, −5, 0, 5 and 10, so open circles at −8 and 4, or at −4 and 2, have to be located by counting ticks. (Lesh, Post & Behr, 1987; Kirsch & Mosenthal, 1990)
Error-prone arithmetic minor Working it out
All three parts of −4 < x/2 < 2 must be multiplied by 2, and the negative bound −4 becomes −8; halving instead gives −2. (Brown & Burton, 1978; Junker & Sijtsma, 2001)
Strategy: Multiply all three parts of the inequality by 2 to isolate x, then pick the graph whose open circles and shading match the new bounds.
Traps
- Stops one step early: A choice is a number from partway through the solution.
- Negatives and direction: Arithmetic with negative numbers, the order of a subtraction, or direction on a number line. (Moving a term across the equals sign without changing its sign is a faulty procedure.)
The wrong answers, classified
A Wrong operation (Hegarty, Mayer & Monk, 1995; King et al., 2004)
Divides each part of the inequality by 2 instead of multiplying, getting −2 < x < 1, so the open circles land at −2 and 1.
B Stops one step early (King et al., 2004; Gierl et al., 2017)
Graphs −4 and 2 as the bounds of x, stopping before the step of multiplying through by 2 to clear the fraction x/2.
C Negatives and direction (Brown & Burton, 1978)
Finds −8 and 4 correctly but shades the two rays outside them, as if x had to be less than −8 or greater than 4.
Worked solution, step by step
Formulas used
- Multiplying an inequality by a positive number
- a and b are numbers, and the less-than sign means the left side is smaller. If you multiply both sides by the same positive number, like 2, the smaller side stays smaller. So the sign keeps pointing the same way. A negative number would flip it, but 2 is positive.
Sort out the inequality
An inequality compares two amounts that may not be equal. The sign means less than. Here means x divided by 2. The inequality says x divided by 2 is between −4 and 2. You need the values of x itself. Then you pick the number line that shows them.
Multiply all three parts by 2
To undo dividing by 2, multiply by 2. Multiply all three parts, so the whole statement stays true.
Watch out: multiply, don’t divide. Dividing gives −2 and 1, choice A. Leaving the ends at −4 and 2 is choice B.
Read what the answer means
x is greater than −8 and less than 4. So x is any number between −8 and 4. x cannot equal −8 or 4 exactly. On a number line, that means open circles at −8 and 4, with the part between them shaded.
Find the matching number line
The number lines are labeled only at −10, −5, 0, 5 and 10. Count the tick marks. −8 is 3 ticks left of −5, and 4 is 1 tick left of 5. Watch out: choice C has circles at −8 and 4 but shades the parts outside them. So the answer is D.
Check your answer
Test a number from the shaded part, like 0. , and 0 is between −4 and 2. Now test 6, which is outside. , and 3 is not less than 2. So only the part between −8 and 4 works.
More questions like this
The original DOE question
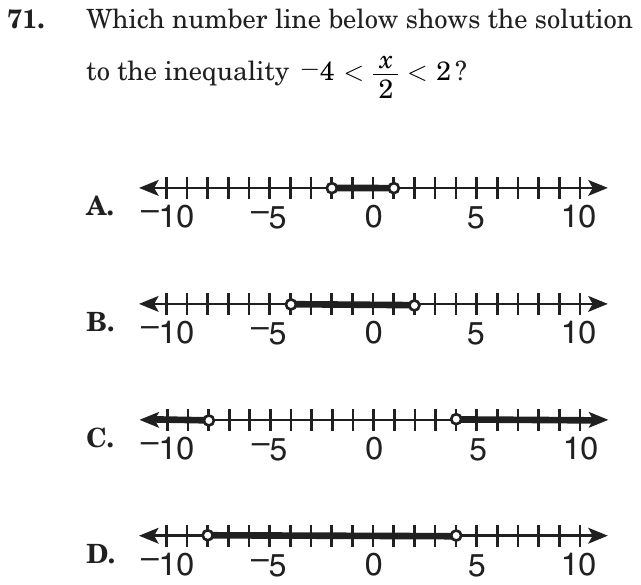
Question 33 of 42
2018 Test A Math, question 18Question
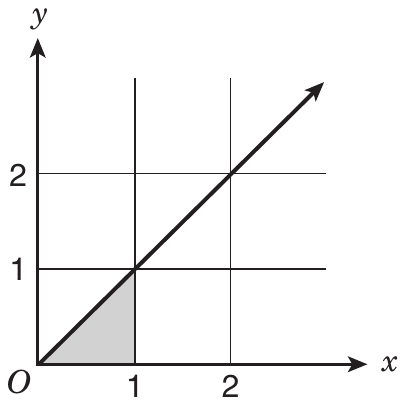
What is the area of the shaded region in the graph above?
- A0.25 square unit
- B0.5 square unit
- C1 square unit
- D1.5 square units
Show the answer
Correct answer: B
The shaded region is a right triangle. Each leg is 1 unit in length.
So the area is
or 0.5 sq unit
Question analysis
A coordinate grid question: find the area of a shaded right triangle with corners at the origin, (1, 0) and (1, 1), under a diagonal line. Students read the base and height from the grid and apply the triangle area formula. The figure does most of the work; the task is recalling the formula correctly.
- Grade level
- Grade 6 content, by NYS standard
- Compared with grade 7
- Below grade 7 Finding a triangle's area from a grid is grade 6 work, and this takes one step with whole-unit legs. It is easier than typical grade 7 area problems, which use composite figures or scale drawings.
- Estimated difficulty
- Routine: one familiar step, little to misread.
- Thinking it demands
- Depth of knowledge 1, recall and reproduction · mainly apply
- What makes it hard
- Solution
- 1 step
- Reading level
- Question and choices: about grade 2, 20 words.
- Students, last 30 days
- Not enough answers yet to show (it takes 10).
Why it is hard, traps and wrong answers (shows the answer)
Why it is hard
This is a quick formula question with legs of 1. The main risk is the one-half in the triangle formula: leaving it out gives the area of the whole grid square, which is a listed choice. Seeing that the diagonal cuts the unit square exactly in half gives a check that needs no formula at all.
Reading a figure, table or graph minor Understanding the question
The legs of the shaded triangle, from O to (1, 0) and up to (1, 1), are read off the grid lines; the line running on to (2, 2) is not part of the region. (Lesh, Post & Behr, 1987; Kirsch & Mosenthal, 1990)
Something you must already know minor Working it out
The triangle area formula, one half times base times height, is needed and not given; the shaded triangle is half of one grid square. (Anderson & Krathwohl, 2001)
Strategy: Read the two legs straight off the grid, then apply the triangle area formula, base times height divided by two.
Traps
- A formula you must know: Needs a formula the test does not give: area, circumference, volume, probability rules.
The wrong answers, classified
A Misreads the figure (Lesh, Post & Behr, 1987; Kirsch & Mosenthal, 1990)
Judges the shaded triangle by eye as a quarter of the 1-by-1 grid square instead of the half that the diagonal from O to (1, 1) cuts off.
C Wrong formula (King et al., 2004)
Multiplies base by height, 1 × 1 = 1, and leaves out the one-half, giving the whole unit square instead of the triangle.
D Little reason to choose it (Haladyna & Downing, 1993; Rodriguez, 2005)
No common working gives 1.5, which is more than the whole grid square around the shaded triangle; it mostly draws guesses.
Worked solution, step by step
Formulas used
- Area of a triangle
- A is the area. b is the base, the side the triangle sits on. h is the height: the straight-up distance from the base to the top corner, at a right angle to the base. You take half because a triangle is half of a rectangle with the same base and height.
Sort out the shaded region
The shaded region is a triangle. Its corners are O, the point (1, 0) and the point (1, 1). O is the origin, the point (0, 0) where the axes meet. The line keeps going up to (2, 2), but only the small triangle is shaded. You need its area in square units.
Read the base and height
The base lies along the x-axis, from O to 1. So the base is 1 unit. The height goes straight up from (1, 0) to (1, 1). So the height is 1 unit too. The base and height meet at a right angle, as the grid lines show.
Use the triangle formula
The area is 0.5 square unit. Watch out: don’t forget the one half. is the whole grid square, choice C. So the answer is B, 0.5 square unit.
Check your answer
The grid square from 0 to 1 has an area of 1 square unit. The slanted line cuts it corner to corner into two equal triangles. The shaded one is half the square, so 0.5 square unit.
More questions like this
The original DOE question
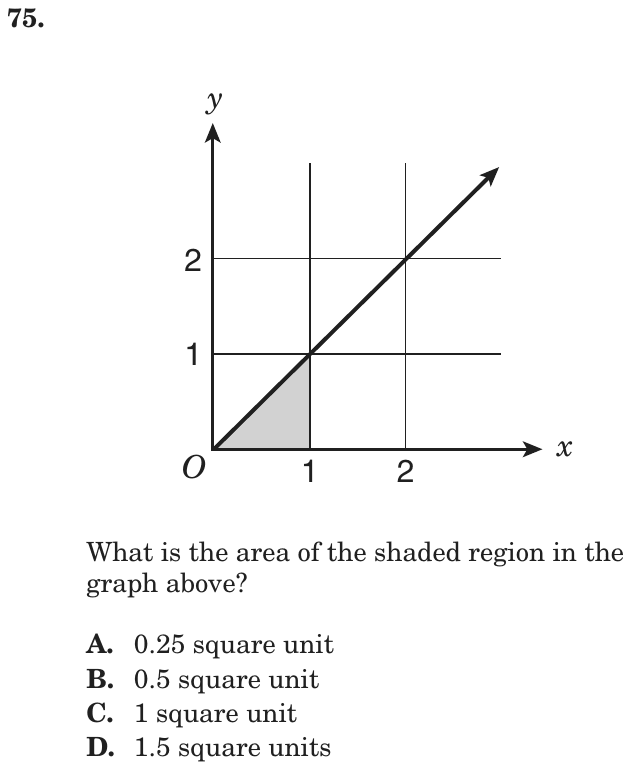
Question 34 of 42
2018 Test A Math, question 24Question
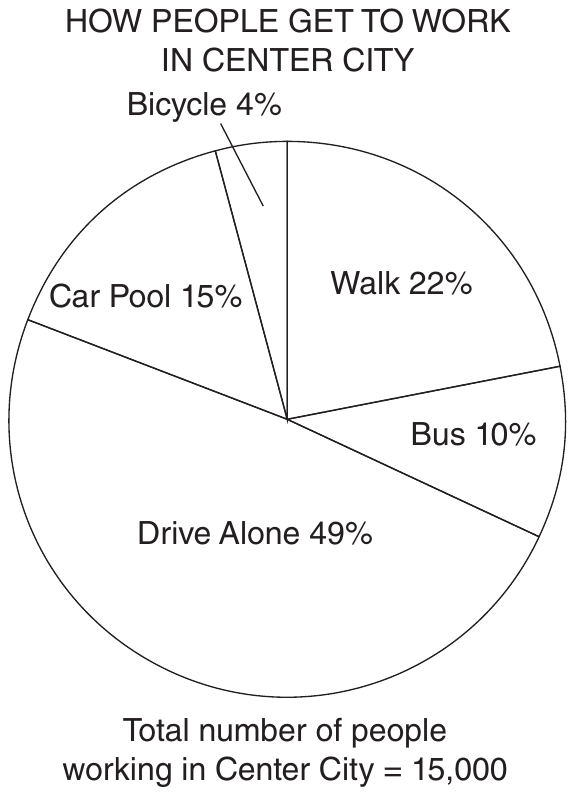
How many more people in Center City walk to work than ride their bicycle to work?
- A2,500
- B2,700
- C2,800
- D3,000
Show the answer
Correct answer: B
According to the chart, 22% of people walk to work and 4% ride a bicycle. Subtract to find the percentage of how many more people walk than bicycle:
22% − 4% = 18%
To find the exact number of people, multiply 18% (0.18) by the number of people working in Center City (15,000):
Question analysis
This circle graph question shows how the 15,000 people working in Center City get to work, with 22% walking and 4% riding a bicycle. Students find how many more people walk than bike by combining a percent difference with a percent of a total. The choices are close together, so estimating is risky.
- Grade level
- Grade 6 content, by NYS standard
- Compared with grade 7
- Below grade 7 Reading a circle graph and taking a percent of a total are grade 6 skills. With only two short steps and friendly numbers, this is easier than typical grade 7 multistep percent work.
- Estimated difficulty
- Straightforward: two steps or one careful reading.
- Thinking it demands
- Depth of knowledge 2, skills and concepts · mainly apply
- What makes it hard
- A very close wrong answer moderate
- Reading a figure, table or graph minor
- Error-prone arithmetic minor
- Solution
- 2 steps
- Reading level
- Question and choices: about grade 7, 16 words.
- Students, last 30 days
- Not enough answers yet to show (it takes 10).
Why it is hard, traps and wrong answers (shows the answer)
Why it is hard
The method is short: subtract the percents first, or find both groups and subtract, and both reach the same number. What makes the question less safe than it looks is the tight spread of choices, all within 500 of each other, so rounding 18% or slipping on one product lands on a wrong answer. Subtracting the percents first leaves one multiplication to get right instead of two.
A very close wrong answer moderate Choosing the answer
2,700 sits only 100 from 2,800 and 300 from 3,000, so estimating 18% of 15,000 as about a fifth cannot pick it; only the exact product does. (Embretson & Wetzel, 1987; Gorin & Embretson, 2006; Ascalon et al., 2007)
Reading a figure, table or graph minor Understanding the question
The Walk 22% and Bicycle 4% labels must be picked out of five sectors, and the 15,000 total sits in a caption below the circle graph. (Lesh, Post & Behr, 1987; Kirsch & Mosenthal, 1990)
Error-prone arithmetic minor Working it out
The percent gap has to become a count, 0.18 × 15,000, a decimal times a five-digit number worked by hand without a calculator. (Brown & Burton, 1978; Junker & Sijtsma, 2001)
Strategy: Subtract the two percents first, then take that single percent of 15,000, instead of finding each group and subtracting.
The wrong answers, classified
A Little reason to choose it (Haladyna & Downing, 1993; Rodriguez, 2005)
No common working gives 2,500, which is 1/6 of 15,000 and matches no sector or difference of sectors; it mostly catches estimates.
C An arithmetic slip (Junker & Sijtsma, 2001)
Takes 4% of 15,000 as 500 instead of 600 and subtracts it from the 3,300 walkers, getting 2,800.
D Rounds too early (King et al., 2004)
Rounds the 18-point gap up to 20% to make the multiplication easy and takes 20% of 15,000, which is 3,000.
Worked solution, step by step
Formulas used
- Percent of a number
- W is the whole amount. p is the percent, and x is the part you want. Percent means out of 100, so p percent is the fraction p over 100. Multiplying the whole by that fraction gives the part.
Sort out the circle graph
A circle graph shows how a whole splits into parts. This one shows how 15,000 workers get to work. Walk is 22%. Bicycle is 4%. You need how many more people walk than ride a bicycle.
Subtract the percents first
Both percents are parts of the same 15,000 people. So you can subtract the percents first. Then you only need one multiplication.
The difference is 18% of all the workers.
Find 18% of 15,000
First find 1% by dividing by 100. Then multiply by 18.
That is 2,700 people.
Avoid rounding and answer
Watch out: don’t round 18% up to 20% to make it easy. 20% of 15,000 is 3,000, choice D. The choices are close together, so you need the exact number. So the answer is B, 2,700.
Check your answer
Find each group, then subtract. Walkers: 22% of 15,000 is 3,300. Bike riders: 4% of 15,000 is 600. . You get the same answer.
More questions like this
The original DOE question
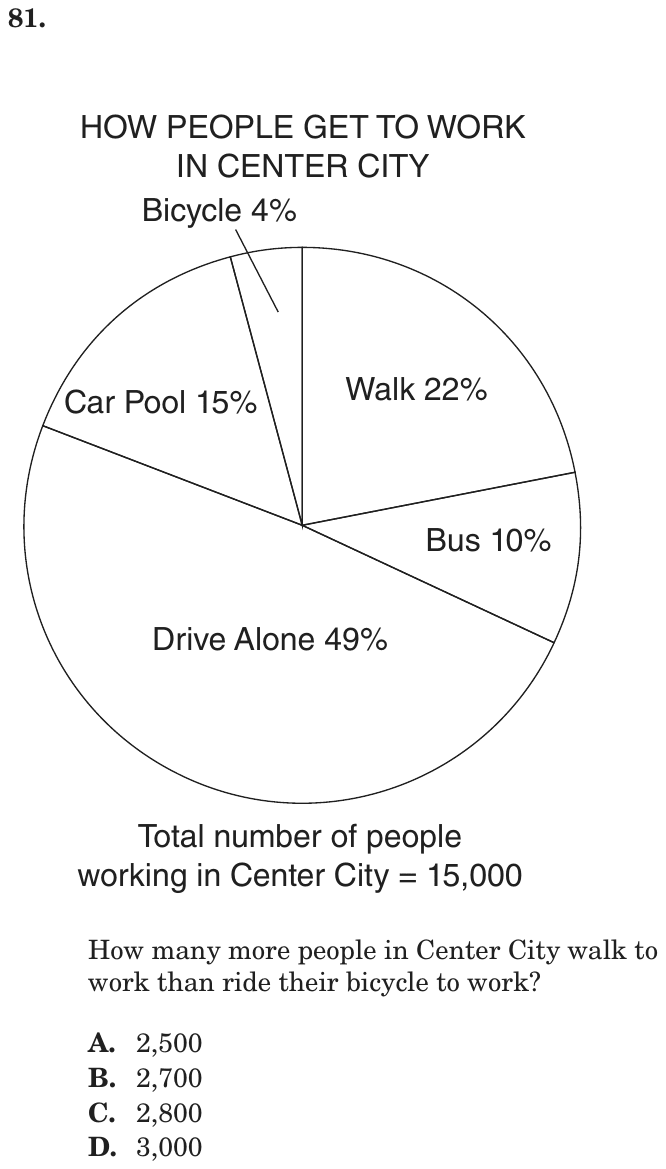
Question 35 of 42
2018 Test A Math, question 36Question
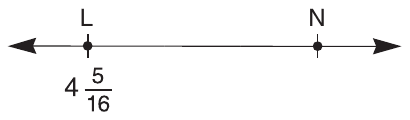
On the number line above, LN = . Point M (not shown) is located between point L and point N. Which value below is a possible value for M?
- A4.26
- B4.31
- C4.35
- D4.58
Show the answer
Correct answer: C
Since , point is located at
.
So must be between point , , and point , . Point can also be written as 4.3125, and point can be written as 4.4375. The only option given that lies between those two points is 4.35.
Question analysis
This number line question says the distance from point L to point N is one eighth and asks which decimal could be the position of a point M between them. Students take L's position, a mixed number in sixteenths, find N, and compare with decimal choices. Converting sixteenths to decimals precisely is the tricky part.
- NYS standards
- Grade level
- Grade 7 content, by NYS standard
- Compared with grade 7
- At grade 7 Grade 7 students convert fractions to decimals and compare them. This item needs an exact conversion of sixteenths and a comparison to the thousandths, where rounding too early can mislead, but it stays within grade 7 content.
- Estimated difficulty
- Moderate: several steps, or a close reading with one strong distractor.
- Thinking it demands
- Depth of knowledge 2, skills and concepts · mainly apply
- What makes it hard
- Error-prone arithmetic moderate
- A very close wrong answer moderate
- Reading a figure, table or graph minor
- Solution
- 3 steps
- Reading level
- Question and choices: about grade 5, 28 words.
- Students, last 30 days
- Not enough answers yet to show (it takes 10).
Why it is hard, traps and wrong answers (shows the answer)
Why it is hard
The interval from L to N is only an eighth wide, and three of the four choices crowd near it, so precision decides the question. Students comfortable working in sixteenths can avoid decimals until the end, since 4.35 lies between 4 5/16 and 4 7/16. Those who convert loosely, or who misread a mixed number as a decimal, are pulled to a neighboring choice.
Error-prone arithmetic moderate Working it out
Converting 4 5/16 to 4.3125 and N to 4.4375 needs four decimal places, while the choices stop at hundredths, so early rounding blurs the left boundary. (Brown & Burton, 1978; Junker & Sijtsma, 2001)
A very close wrong answer moderate Choosing the answer
The choices 4.31 and 4.35 both lie within 0.04 of L, so estimating cannot separate them; only the exact 4.3125 shows 4.31 just outside the interval and 4.35 inside. (Embretson & Wetzel, 1987; Gorin & Embretson, 2006; Ascalon et al., 2007)
Reading a figure, table or graph minor Understanding the question
L's value appears only on the number line, and the picture shows N to the right of L, which fixes which way the one-eighth gap runs. (Lesh, Post & Behr, 1987; Kirsch & Mosenthal, 1990)
Strategy: Add one eighth, or two sixteenths, to L's position to locate N, convert both endpoints to four-place decimals, and keep only a choice strictly between them.
Traps
- Rounds too early: Rounds a value partway through, or rounds the wrong way, so the final answer drifts from the exact one.
- Answer in another form: The right answer is written differently from the way you worked it out.
- A faulty procedure: A systematic but wrong procedure: adding fractions straight across, applying an exponent to each term of a sum, dropping a sign when moving a term.
The wrong answers, classified
A Negatives and direction (Brown & Burton, 1978)
Measures the one-eighth gap to the left of L, giving 4.1875 to 4.3125, an interval that contains 4.26 but contradicts the figure.
B Rounds too early (King et al., 2004)
Rounds L's 4.3125 to 4.31 and treats 4.31 as inside the interval, missing that it lies slightly to the left of L.
D A faulty procedure (Brown & Burton, 1978; Tatsuoka, 1983)
Writes 4 5/16 as 4.516 by placing the fraction's digits after the decimal point, so N becomes about 4.641 and 4.58 appears to fit.
Worked solution, step by step
Formulas used
- Equal fractions
- a is the top number (numerator) and b is the bottom number (denominator). Multiplying both by the same number k gives an equal fraction. It is like cutting each piece into k smaller pieces. Use it to give fractions the same bottom before you add or subtract.
- Fraction to decimal
- A fraction bar means divide. a is the top number and b is the bottom number. Dividing the top by the bottom turns the fraction into a decimal. Then you can compare it with decimal choices.
Sort out what you know
Point L is at . Point N is to the right of L. The distance from L to N, called LN, is .
Point M is somewhere between L and N. You need a choice that fits between them. The choices are decimals, so you will change the fractions into decimals.
Find where N is
N is to the right of L, so add. First give a bottom of 16, to match L:
Watch out: N is to the right of L in the figure. Going left instead gives a gap that holds 4.26, choice A.
Change both points to decimals
Divide the top of each fraction by the bottom:
So L is at 4.3125 and N is at 4.4375.
Test each choice
M must be bigger than 4.3125 and smaller than 4.4375.
- 4.26 is smaller than 4.3125. It is left of L.
- 4.31 is 4.3100, just smaller than 4.3125. It is a hair left of L.
- 4.35 is between them. It fits.
- 4.58 is bigger than 4.4375. It is right of N.
Watch out: if you round L to 4.31, choice B seems to fit. Keep all four decimal places. So the answer is C, 4.35.
Check your answer
Subtract to be sure. 4.35 − 4.3125 = 0.0375, which is more than 0, so 4.35 is right of L. 4.4375 − 4.35 = 0.0875, which is also more than 0, so 4.35 is left of N. It sits between them.
More questions like this
The original DOE question
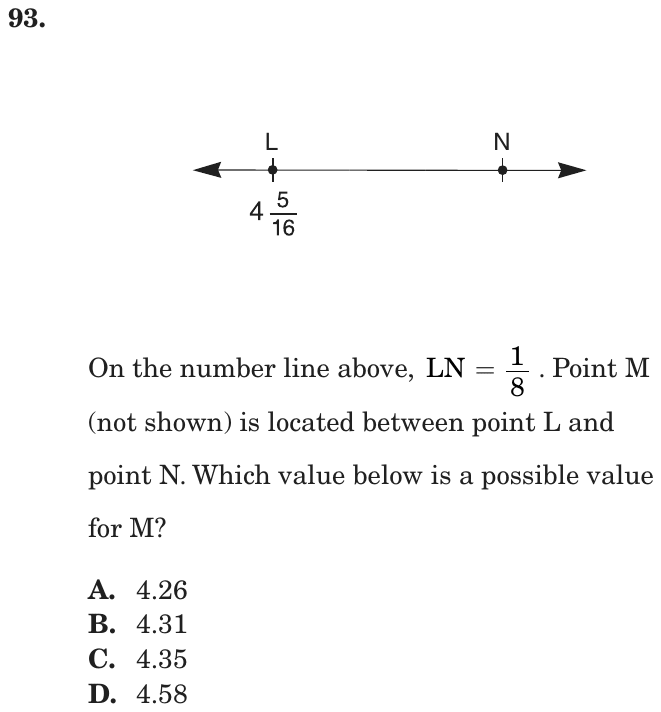
Question 36 of 42
2018 Test A Math, question 41Question
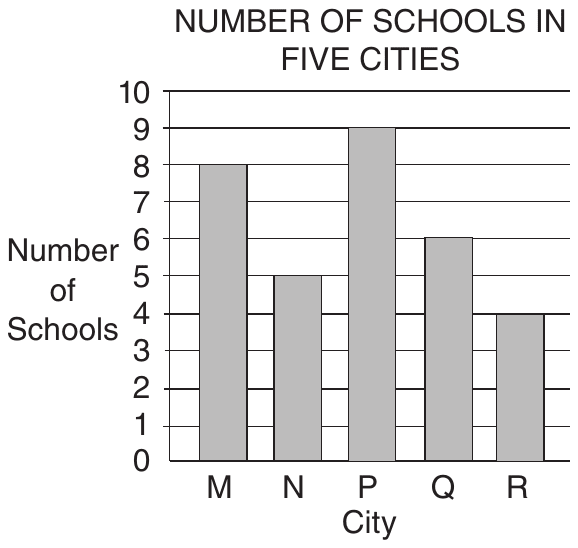
The graph above shows the number of schools per city for five small cities. Cities M and N each have 500 students per school. City P has 400 students per school. Cities Q and R each have 700 students per school. Which of the five cities has the greatest number of students?
- ACity M
- BCity P
- CCity Q
- DCity R
Show the answer
Correct answer: C
Take each city’s number of schools and multiply by the number of students. It is not necessary to calculate all 5 of these.
Cities M and N have the same number of students per school, so just calculate the number of students in City M because it has more schools than City N.
The same goes for Q and R — only Q needs to be calculated because it has more schools than R.
M= 8 × 500 = 4,000
P = 9 × 400 = 3,600
Q = 6 × 700 = 4,200
City Q has the greatest number of students.
Question analysis
This graph question shows the number of schools in each of five small cities and gives the number of students per school for each city. Students multiply schools by students per school to compare the total number of students. Comparing only the bars, or only the rates, can mislead.
- Grade level
- Grade 6 content, by NYS standard
- Compared with grade 7
- Below grade 7 Reading a bar graph and multiplying is familiar from grade 6. Grade 7 data tasks often add percents or compare distributions; this one needs only a few whole-number products, so it is easier than typical grade 7 work.
- Estimated difficulty
- Straightforward: two steps or one careful reading.
- Thinking it demands
- Depth of knowledge 2, skills and concepts · mainly apply
- What makes it hard
- A very close wrong answer moderate
- Much to keep track of minor
- Reading a figure, table or graph minor
- Solution
- 3 steps
- Reading level
- Question and choices: about grade 2, 57 words.
- Corrected from the DOE handbook
- A misstatement in the explanation was corrected.
- Students, last 30 days
- Not enough answers yet to show (it takes 10).
Why it is hard, traps and wrong answers (shows the answer)
Why it is hard
Neither the tallest bar nor the highest rate wins, which is the point of the question: total students depend on both. The explanation's shortcut, comparing only M, P and Q because N and R each share a rate with a taller bar, cuts the work to three products. The top two totals are close, so the products must actually be computed rather than estimated.
A very close wrong answer moderate Choosing the answer
City M's 4,000 students and City Q's 4,200 differ by only 200, so judging from bar heights and rates cannot separate them; only computing 8 × 500 and 6 × 700 does. (Embretson & Wetzel, 1987; Gorin & Embretson, 2006; Ascalon et al., 2007)
Much to keep track of minor Working it out
The rates come in three groups in the stem, 500 for M and N, 400 for P, 700 for Q and R, and each must be matched to its bar. (Sweller, 1988; Carpenter, Just & Shell, 1990)
Reading a figure, table or graph minor Understanding the question
The number of schools comes only from the bar heights, read against gridlines from 0 to 10; all five bars end exactly on a gridline. (Lesh, Post & Behr, 1987; Kirsch & Mosenthal, 1990)
Strategy: For each city, multiply the number of schools read from the graph by its students per school and compare the products; cities that share a rate need only their school counts compared.
Traps
- Stops one step early: A choice is a number from partway through the solution.
- Answers a different question: A choice is right for another quantity: the other unknown, the rest instead of the part, the part instead of the whole.
The wrong answers, classified
A Stops one step early (King et al., 2004; Gierl et al., 2017)
Computes M's 8 × 500 = 4,000 and P's 9 × 400 = 3,600 and stops, never working out Q's 6 × 700 = 4,200.
B Answers a different question (King et al., 2004; Hegarty, Mayer & Monk, 1995)
Picks the tallest bar, P's nine schools, which answers which city has the most schools rather than the most students.
D Numbers taken from the question (Hegarty, Mayer & Monk, 1995)
Picks a city with the stem's highest rate, 700 students per school, without noticing that R has only 4 schools to Q's 6.
What was corrected from the DOE handbook, and why
- Explanation: The handbook says “Cities M and N have the same number of students”. They have the same number of students per school (500), not the same total: M has 8 × 500 = 4,000 and N has 5 × 500 = 2,500, which is why only City M, with more schools, needs to be calculated. The sentence now says “the same number of students per school”.
Worked solution, step by step
Formulas used
- Total students in a city
- S is the total number of students in a city. n is the number of schools, read from the bar. s is the number of students in each school. You multiply because every school in that city has the same number of students.
Read the graph
The bar graph shows how many schools each city has. Read the top of each bar against the numbers on the left. M has 8, N has 5, P has 9, Q has 6 and R has 4.
The question gives the students per school. You need the city with the most students in all.
Multiply for each city
Use the formula for each city:
City Schools Students per school Total students M 8 500 4,000 N 5 500 2,500 P 9 400 3,600 Q 6 700 4,200 R 4 700 2,800 Compare the totals
The biggest total is 4,200, for City Q.
Watch out: City P has the tallest bar, but that means the most schools, not the most students. That leads to choice B. City M’s 4,000 is close, so do not stop before you work out Q. That is choice A.
So the answer is C, City Q.
Check your answer
A shortcut: M and N both have 500 per school, and M has more schools, so M beats N. Q and R both have 700, and Q beats R. So only M, P and Q matter: 4,000, 3,600 and 4,200. Q still wins.
More questions like this
The original DOE question
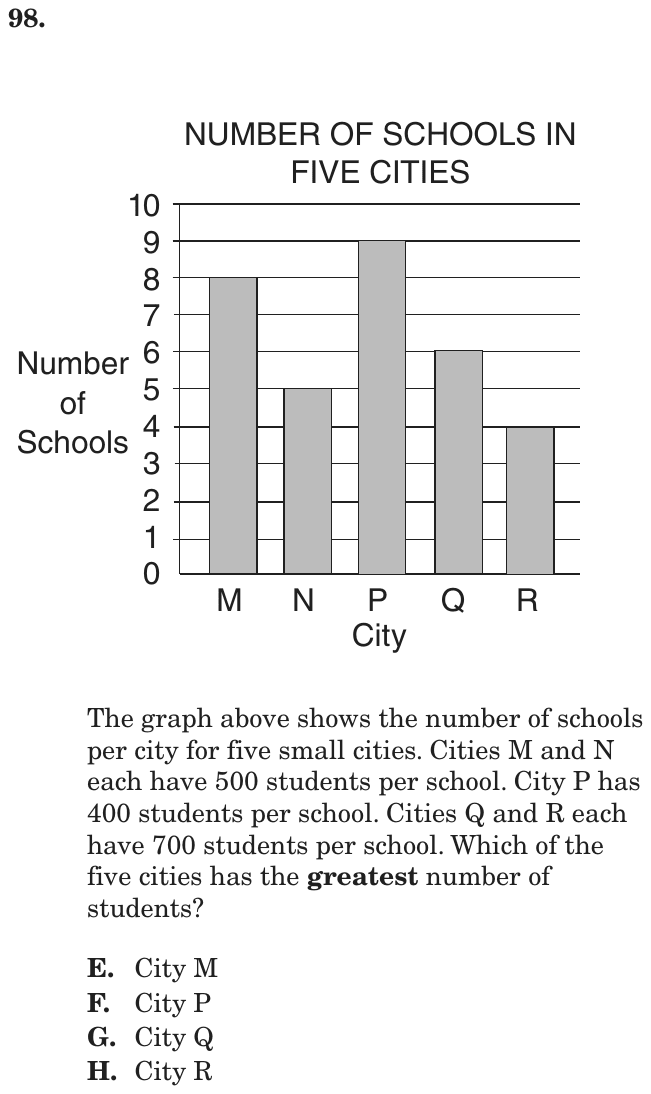
Question 37 of 42
2018 Test A Math, question 44Question

On the number line above, points , , , and are integers, and . What is the value of ?
- A8
- B11
- C12
- D18
Show the answer
Correct answer: C
Convert the ratios into fractions of . Use the sum of the ratios for the denominator.
The part of that is is the sum of those fractions:
Find the length of :
The value of is .
Question analysis
This number line question places integer points W, X, Y and Z on a line and gives the ratio of the segments WX, XY and YZ as 4 to 2 to 3. Students find the whole length from W to Z, split it by the ratio, and add the parts that make up WY. Mixing up a part with the whole is the main risk.
- Grade level
- Grade 7 content, by NYS standard
- Compared with grade 7
- Above grade 7 Grade 7 students find distances on a number line and use part-to-whole ratios, usually separately. This item joins them: a negative endpoint, a three-term ratio and a choice of which segments to combine.
- Estimated difficulty
- Hard: combines ideas, needs a plan, and has more than one tempting wrong answer.
- Thinking it demands
- Depth of knowledge 2, skills and concepts · mainly apply
- What makes it hard
- Combines ideas moderate
- Reading a figure, table or graph moderate
- Many steps minor
- Solution
- 3 steps
- Reading level
- Question and choices: about grade 10, 21 words.
- Corrected from the DOE handbook
- Equations in the explanation that mixed up a fraction of a length with the length itself were corrected.
- Students, last 30 days
- Not enough answers yet to show (it takes 10).
Why it is hard, traps and wrong answers (shows the answer)
Why it is hard
Each step is routine, but the question keeps asking for a different piece of the line: the whole WZ, the part WX, and finally WY, which is two parts added together. Two of the wrong choices are exactly those other pieces. Students who mark the actual positions, X at −2 and Y at 2, can check the ratio before answering.
Combines ideas moderate Working it out
A three-part ratio, 4:2:3, must be applied to a length found from a negative endpoint, 8 − (−10) = 18, joining ratio and number-line distance. (Embretson, 1998; Daniel & Embretson, 2010)
Reading a figure, table or graph moderate Understanding the question
Only W at −10 and Z at 8 are labeled, and the drawing is not to scale: Y is drawn nearer 5 than 2, so reading WY from the picture fails. (Lesh, Post & Behr, 1987; Kirsch & Mosenthal, 1990)
Many steps minor Working it out
Find WZ, split it into 9 equal parts of 2, then add the 4 parts of WX and the 2 parts of XY. (Daniel & Embretson, 2010; Enright, Morley & Sheehan, 2002)
Strategy: Find the length WZ from the endpoints on the number line, divide it by the total number of ratio parts, and multiply by the parts from W to Y.
Traps
- Stops one step early: A choice is a number from partway through the solution.
- Answers a different question: A choice is right for another quantity: the other unknown, the rest instead of the part, the part instead of the whole.
- Counting the ends: Inclusive or exclusive ends, fence posts, consecutive numbers: an answer that is one too many or too few, or an endpoint drawn open where it belongs closed (or the reverse).
The wrong answers, classified
A Stops one step early (King et al., 2004; Gierl et al., 2017)
Finds WX, 4/9 of 18 = 8, and stops without adding XY's 4 to reach Y; 8 also matches Z's label.
B Counting the ends (Brown & Burton, 1978)
Places Y at 2 but counts the integers strictly between −10 and 2, which are −9 through 1, getting 11 instead of the distance 12.
D Answers a different question (King et al., 2004; Hegarty, Mayer & Monk, 1995)
Gives the whole length WZ, 8 − (−10) = 18, instead of the part from W to Y.
What was corrected from the DOE handbook, and why
- Explanation: The handbook writes WX = 4/9, XY = 2/9 and WY = 2/3, and then says “The value of WY is 2/3(18) = 12”. Those fractions are parts of WZ, not the lengths themselves (WX is 8 and WY is 12), so WY cannot be both 2/3 and 12. The lines now read WX = 4/9 WZ, XY = 2/9 WZ and WY = 2/3 WZ. The method and the answer are unchanged.
Worked solution, step by step
Formulas used
- Distance on a number line
- d is the distance between two points. b is the point on the right and a is the point on the left. Subtracting left from right always gives a positive distance. It works even when a is negative.
- Size of one part of a ratio
- u is the size of one part. L is the whole length being shared. p is the total number of parts, found by adding the numbers in the ratio. Every part is the same size, so you share the length equally.
Sort out what you know
W is at −10 and Z is at 8. X and Y are between them. The ratio 4:2:3 means WX is 4 parts, XY is 2 parts and YZ is 3 parts. All the parts are the same size.
You need the length WY, from W to Y. The drawing is not exact, so use the numbers, not the picture.
Find the whole length WZ
WZ is 18 units long. Subtracting a negative number is the same as adding.
Find the size of one part
Add the ratio numbers to get the number of parts:
Share the 18 units equally among 9 parts:
Each part is 2 units long.
Find WY
WY is WX and XY together, so it has 4 + 2 = 6 parts:
Watch out: WX alone is 4 × 2 = 8, which is choice A. And 18 is the whole line, choice D. So the answer is C, 12.
Check your answer
Place the points. W is at −10. X is 8 units to the right, at −2. Y is 4 more, at 2. Z is 6 more, at 8, which matches its label. And the distance from −10 to 2 is 2 − (−10) = 12.
More questions like this
The original DOE question
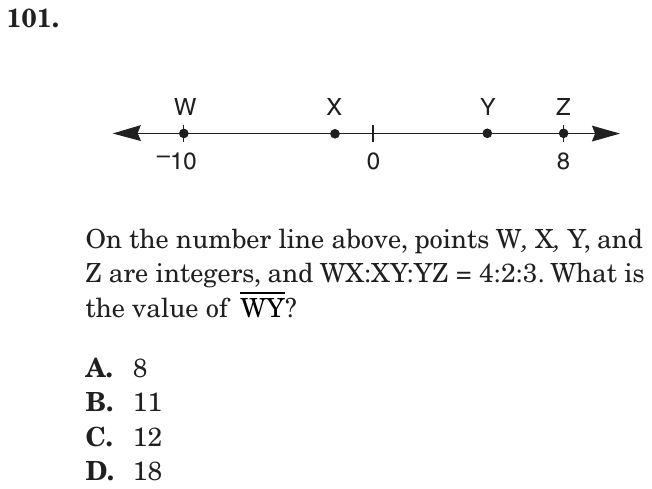
Question 38 of 42
2018 Test A Math, question 54Question
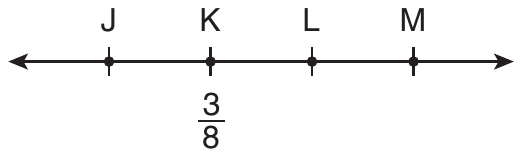
On the number line above, , , and . What is the position of point ?
- A
- B
- C
- D
Show the answer
Correct answer: C
First, use to find the location of :
Now, use to find the location of :
Finally, use to find the location of :
Question analysis
This number line question gives the lengths JK, JM and LM as mixed numbers and asks for the position of point L. Students must chain three distance steps, moving left from K to J, right to M and back to L, with fractions in eighths and a negative position. Losing track of where K sits is the main danger.
- Grade level
- Grade 7 content, by NYS standard
- Compared with grade 7
- Above grade 7 Grade 7 students add and subtract rational numbers and find distances on a number line one at a time. This item chains three such steps with mixed numbers and a negative position, more than typical grade 7 work demands.
- Estimated difficulty
- Among the hardest on the SHSAT: a non-obvious approach, heavy reading, or a well-hidden trap.
- Thinking it demands
- Depth of knowledge 2, skills and concepts · mainly apply
- What makes it hard
- A very close wrong answer major
- Error-prone arithmetic moderate
- Reading a figure, table or graph moderate
- Many steps minor
- Solution
- 4 steps
- Reading level
- Question and choices: about grade 9, 20 words.
- Students, last 30 days
- Not enough answers yet to show (it takes 10).
Why it is hard, traps and wrong answers (shows the answer)
Why it is hard
Every number is a mixed fraction, one position is negative, and the figure's even spacing hides how long KL really is. The distance route, KL = 9 3/4 − 3 1/2 − 1 1/8, avoids the negative entirely but ends one step short of a position unless K's 3/8 is added back. That last step is the one most students skip, which is why the question sits at the top of the scale.
A very close wrong answer major Choosing the answer
The choices 5 1/8, 5 1/4 and 5 1/2 lie within 3/8 of one another, so no estimate separates them; only exact eighths and adding K's 3/8 pick out the right one. (Embretson & Wetzel, 1987; Gorin & Embretson, 2006; Ascalon et al., 2007)
Error-prone arithmetic moderate Working it out
Every step mixes halves, quarters and eighths, and placing J means 3/8 − 3 1/2 = −3 1/8, a subtraction that crosses zero. (Brown & Burton, 1978; Junker & Sijtsma, 2001)
Reading a figure, table or graph moderate Understanding the question
Only K is labeled, and the points are drawn evenly spaced although KL is over four times LM, so the picture gives no help with sizes. (Lesh, Post & Behr, 1987; Kirsch & Mosenthal, 1990)
Many steps minor Working it out
Three linked moves, K to J, J to M and M back to L, each depend on the last, so an early slip carries through. (Daniel & Embretson, 2010; Enright, Morley & Sheehan, 2002)
Strategy: Start from K's labeled position, subtract JK to place J, add JM to place M, then subtract LM, keeping every fraction in eighths.
Traps
- Answers a different question: A choice is right for another quantity: the other unknown, the rest instead of the part, the part instead of the whole.
- Stops one step early: A choice is a number from partway through the solution.
The wrong answers, classified
A Stops one step early (King et al., 2004; Gierl et al., 2017)
Finds KL = 9 3/4 − 3 1/2 − 1 1/8 = 5 1/8 and stops one step short, never adding K's position of 3/8.
B An arithmetic slip (Junker & Sijtsma, 2001)
Rewrites 9 3/4 as 9 4/8 instead of 9 6/8, so M lands at 6 3/8 and L at 6 3/8 − 1 1/8 = 5 1/4.
D Answers a different question (King et al., 2004; Hegarty, Mayer & Monk, 1995)
Finds KM = 9 3/4 − 3 1/2 = 6 1/4, the distance from K to M, and gives it without moving back 1 1/8 to L.
Worked solution, step by step
Formulas used
- Distance on a number line
- d is the distance between two points. b is the point on the right and a is the point on the left. Subtracting left from right always gives a positive distance. It works even when a is negative.
- Equal fractions
- a is the top number (numerator) and b is the bottom number (denominator). Multiplying both by the same number k gives an equal fraction. It is like cutting each piece into k smaller pieces. Use it to give fractions the same bottom before you add or subtract.
Sort out what you know
Only K has a value: . JK means the distance from J to K. You know JK = , JM = and LM = .
You need the position of L, the number where L sits. The points are drawn evenly spaced, but the distances are not equal. So use the numbers, not the picture.
Write the fractions in eighths
The fractions use halves, fourths and eighths. Give them all a bottom of 8:
Watch out: is , not . That slip leads to choice B.
Find the distance from K to M
JM is JK and KM put together. So take JK away from JM:
KM is , or . Watch out: this is a distance, not where L sits. Choice D stops here.
Find the distance from K to L
KM is KL and LM put together. So take LM away:
KL is . Watch out: this is still a distance. Choice A stops here.
Find the position of L
L is to the right of K, and K is at . Add:
So the answer is C, .
Check your answer
Place every point. J is left of K, at . M is right of J, at . L is left of M, at , which is . Same answer.
More questions like this
The original DOE question
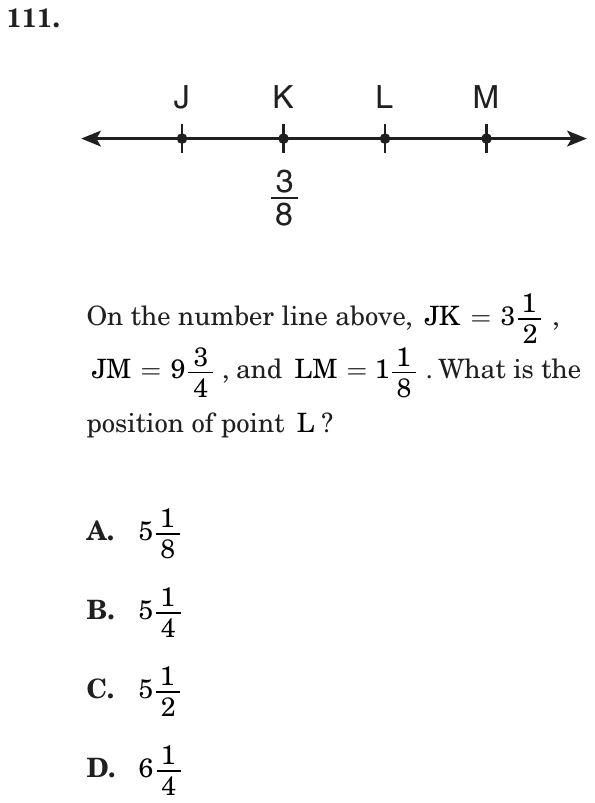
Question 39 of 42
2018 Test B English, question 53Passage Invention of the Telegraph
Samuel Morse, an American inventor, is credited with creating the electronic telegraph, a communication device that allows users to send messages using a system of short and long pulses that represent letters, numbers, and punctuation. In 1843 the United States Congress passed the Telegraph Bill, which provided Morse with the funds to build an electric telegraph system.
Invention of the Telegraph
Earlier Signal Systems
Long before Samuel F. B. Morse electrically transmitted his famous message “What hath God wrought?” from Washington to Baltimore on May 24, 1844, there were signaling systems that enabled people to communicate over distances. Most were visual or “semaphore” systems using flags or lights. In the eighteenth century, such systems used an observer who would decipher a signal from a high tower on a distant hill and then send it on to the next station. The young American republic wanted just such a system along its entire Atlantic coast and offered a prize of $30,000 for a workable proposal. The framers of this legislation had no way of knowing that when they used the word “telegraph” to refer to this visual semaphore system, they would be offered an entirely new and revolutionary means of communication—electricity.
The Growth of an Idea
The idea of using electricity to communicate over distance is said to have occurred to Morse during a conversation aboard ship when he was returning from Europe in 1832. Michael Faraday’s recently invented electromagnet was much discussed by the ship’s passengers, and when Morse came to understand how it worked, he speculated that it might be possible to send a coded message over a wire. While a student at Yale College years before, he had written his parents a letter about how interesting he found the lectures on electricity. Despite what he had learned at Yale, Morse found when he began to develop his idea that he had little real understanding of the nature of electricity, and after sporadic attempts to work with batteries, magnets, and wires, he finally turned for help to a colleague at the University of the City of New York, Leonard D. Gale.
Gale was a professor of chemistry and familiar with the electrical work of Princeton’s Joseph Henry, a true pioneer in the new field. Well before Morse had his shipboard idea about a telegraph, Henry rang a bell at a distance by opening and closing an electric circuit. In 1831, he had published an article, of which Morse was unaware, that contained details suggesting the idea of an electric telegraph. Gale’s help and his knowledge of this article proved crucial to Morse’s telegraph system because Gale not only pointed out flaws in the system but showed Morse how he could regularly boost the strength of a signal and overcome the distance problems he had encountered by using a relay system Henry had invented. Henry’s experiments, Gale’s assistance, and, soon after, hiring the young technician Alfred Vail were keys to Morse’s success.
Obstacles and Opportunities
By December 1837, Morse had enough confidence in his new system to apply for the federal government’s appropriation, and during the next year he conducted demonstrations of his telegraph both in New York and Washington.
However, when the economic disaster known as the Panic of 1837 took hold of the nation and caused a long depression, Morse was forced to wait for better times. It was during this period that Morse visited Europe again and tried not only to secure patent protection overseas but to examine competing telegraph systems in England. . . .
By 1843, the country was beginning to recover economically, and Morse again asked Congress for the $30,000 that would allow him to build a telegraph line from Washington to Baltimore, forty miles away. The House of Representatives eventually passed the bill containing the Morse appropriation, and the Senate approved it in the final hours of that Congress’s last session. With President Tyler’s signature, Morse received the cash he needed and began to carry out plans for an underground telegraph line.
Realizing a Great Invention
Morse had hired the ingenious construction engineer Ezra Cornell to lay the pipe carrying the wire, and although Cornell did his job superbly, one of Morse’s partners, Congressman F. O. J. Smith, had purchased wire with defective insulation. Too much time had been wasted laying bad wire, and with the project on a rigid deadline, something had to be done quickly. Cornell suggested that the fastest and cheapest way of connecting Washington and Baltimore was to string wires overhead on trees and poles. The desperate Morse gave the go-ahead, and the line was completed in time for the dramatic and spectacularly successful link between the Supreme Court chamber of the Capitol building and the railroad station in Baltimore.
Soon, as overhead wires connected cities up and down the Atlantic coast, the dots-and-dashes method that recorded messages on a long moving strip of paper was replaced by the operator’s ability to interpret the code in real time. . . . Telegraph lines soon extended westward, and within Morse’s own lifetime they connected the continents of Europe and America.
“Invention of the Telegraph”—Public Domain/Library of Congress
legislation: Telegraph Bill
dots-and-dashes method: the short and long pulses of Morse code that are sent and received by telegraph operators
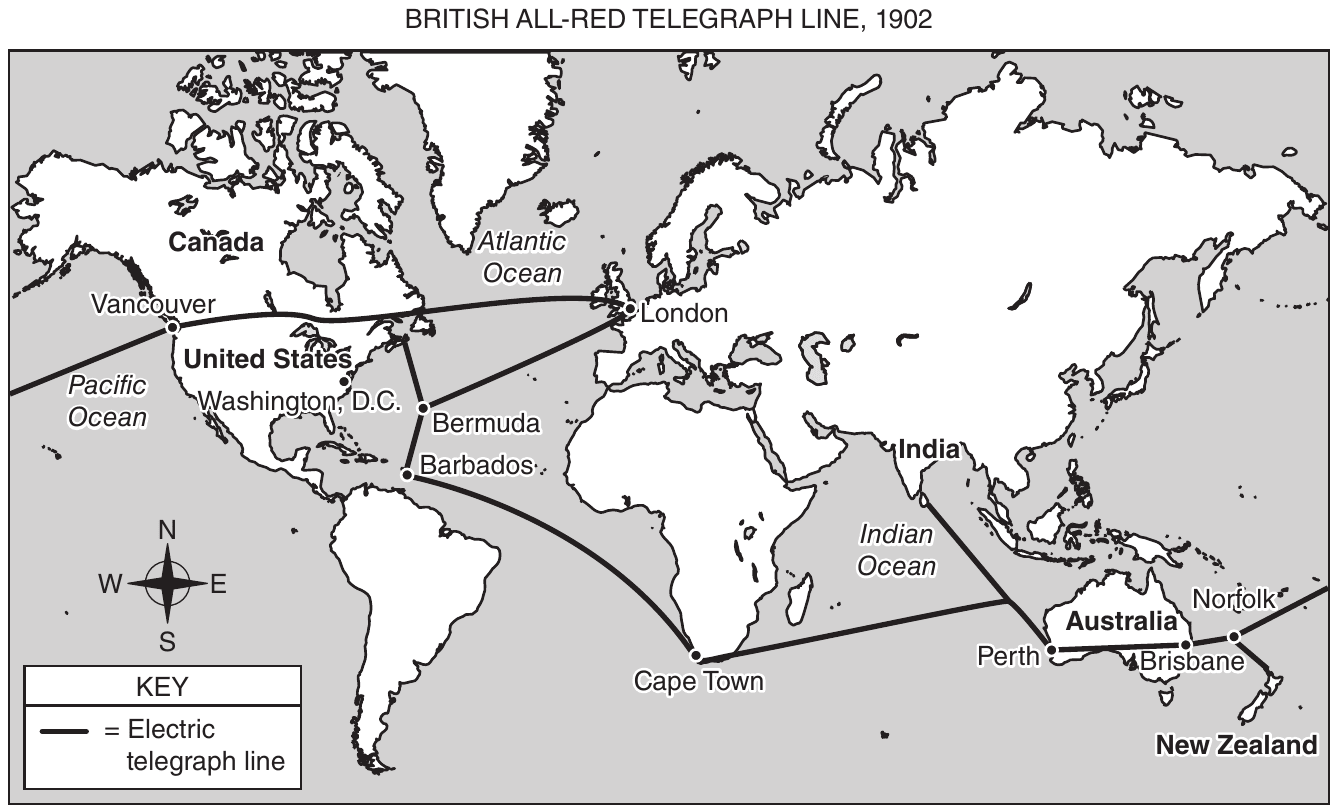
The first transatlantic electric telegraph message was sent in 1858, and by 1902 the British All-Red Line connected most of the world.
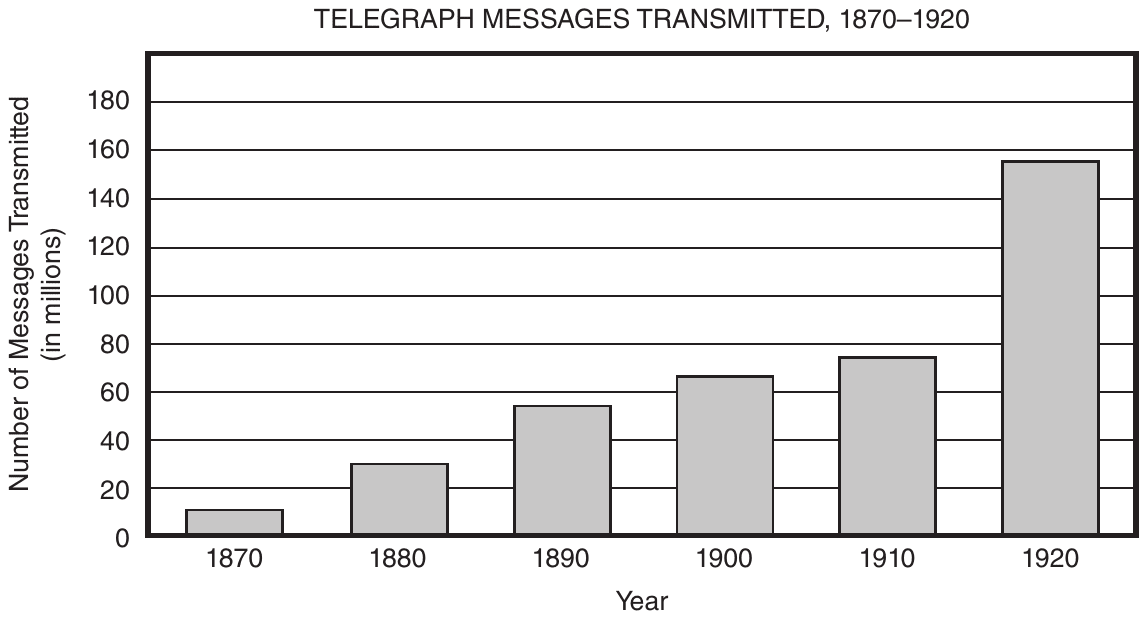
Source: U.S. Bureau of the Census. Historical Statistics of the United States, Colonial Times to 1970, Bicentennial Edition, Part 2. Washington, D.C., 1975.
Question
How does the graph support the ideas in paragraph 8?
- AIt indicates how welcome the improvement of long-distance communication was in the United States.
- BIt provides evidence of the dramatic increase in the number of telegraph messages as Morse’s system expanded across the United States.
- CIt reveals that by the twentieth century millions of people had used the telegraph despite earlier hesitations about the system.
- DIt shows how improvements that allowed Morse code to be read in real time made relaying telegraph messages faster and increased the system’s usage.
Show the answer
Correct answer: B
The question asks how the graph supports the ideas in paragraph 8. The graph shows the number of messages transmitted from 1870 to 1920. In 1920 almost 160 million messages were transmitted, showing a “dramatic”—more than double—increase from 1910, which makes Option B the correct answer.
Option A is incorrect because, while it can be implied from the expansion shown on the graph that people possibly welcomed the improvement in long-distance communication, the graph does not state this explicitly.
Option C is incorrect because the graph does not show how many people used the telegraph, but rather it shows the number of messages sent. Additionally, paragraph 8 provides no details about hesitation on the part of individuals.
Option D is incorrect because, while improvements in recording and interpreting code were made, the graph does not show the effect of this advancement on the speed or number of messages being transmitted.
Question analysis
This question asks how a graph that accompanies “Invention of the Telegraph” supports the ideas in paragraph 8, the passage’s closing account of what followed the first telegraph line. Students must connect a data display to a paragraph of text, and the choices differ in how much they claim a graph of this kind could prove.
- Grade level
- Grade 7 reading and task
- Compared with grade 7
- At grade 7 Connecting a graph to a paragraph is standard grade 7 work with mixed formats. The demand is typical: read the paragraph, read the data, and check that a claim about the graph does not go beyond it.
- Estimated difficulty
- Moderate: several steps, or a close reading with one strong distractor.
- Thinking it demands
- Depth of knowledge 2, skills and concepts · mainly analyze
- What makes it hard
- Reading a figure, table or graph moderate
- A very close wrong answer moderate
- Combines ideas minor
- Evidence
- Answered from one paragraph or stanza
- Reading level
- Passage: about grade 11, 910 words; question and choices: about grade 11, 88 words.
- Corrected from the DOE handbook
- A misreading of the graph in the explanation was corrected.
- Students, last 30 days
- Not enough answers yet to show (it takes 10).
Why it is hard, traps and wrong answers (shows the answer)
Why it is hard
The graph is simple to read; the challenge is deciding how much a count of messages can prove. Wrong choices claim the graph shows public feeling, numbers of people, or the effect of one improvement, and the last of these is tempting because paragraph 8 mentions that improvement. Students who ask what the vertical axis measures can reject all three quickly.
Reading a figure, table or graph moderate Understanding the question
The bar graph counts messages in millions, rising from about 10 in 1870 to about 155 in 1920; it measures neither people, nor speed, nor causes, which is what rules out three choices. (Lesh, Post & Behr, 1987; Kirsch & Mosenthal, 1990)
A very close wrong answer moderate Choosing the answer
The key and the real-time-reading choice both tie the rise in messages to a change described in paragraph 8; they part on one detail, the claim that relaying became “faster,” which a count of messages cannot show. (Embretson & Wetzel, 1987; Gorin & Embretson, 2006; Ascalon et al., 2007)
Combines ideas minor Working it out
Students must join the graph’s fifty years of growth to paragraph 8’s spread of overhead wires along the coast, westward and across the ocean. (Embretson, 1998; Daniel & Embretson, 2010)
Strategy: Reread paragraph 8 and look at what the graph measures, then for each choice ask whether both the paragraph and the graph back it up.
Traps
- Reads too much in: A reasonable-sounding conclusion that goes further than the text allows.
- Twists what the text says: Uses the text's topic and ideas but changes what it says: who did it, how much, when, or why.
The wrong answers, classified
A Reads too much in (Graesser, Singer & Trabasso, 1994)
Infers from the growth that people welcomed the telegraph, which may be true, but a count of messages cannot show how anyone felt about the change.
C Twists what the text says (King et al., 2004)
Treats messages as people, reading “in millions” as millions of users, and adds “earlier hesitations” that neither the graph nor paragraph 8 mentions.
D Reads too much in (Graesser, Singer & Trabasso, 1994)
Takes real-time reading of code from paragraph 8 and credits it with the rise in messages, but the graph shows only totals, not what caused them or how fast messages moved.
What was corrected from the DOE handbook, and why
- Explanation: The handbook says 1920 showed an “almost double” increase from 1910. The graph shows about 75 million messages in 1910 and about 155 million in 1920, so the number more than doubled. The site now says “more than double.”
Working it out, step by step
Figure out what the question asks
This asks how the bar graph supports paragraph 8. To answer, you need to know two things. What does paragraph 8 say? And what does the graph actually measure?
Read paragraph 8
Paragraph 8 says that “overhead wires connected cities up and down the Atlantic coast.” Then “Telegraph lines soon extended westward, and within Morse’s own lifetime they connected the continents of Europe and America.” So the main idea is growth. The telegraph spread farther and farther.
Read the bar graph
The graph’s title is Telegraph Messages Transmitted, 1870–1920. Its side axis counts messages, in millions. The bars rise every ten years. There were about 10 million messages in 1870 and about 75 million in 1910. In 1920 there were about 155 million. That last jump is more than double. The graph counts messages. It does not count people, speed or feelings.
Check each choice
- A is wrong. A count of messages can’t show how welcome something was. That is a feeling.
- B fits. The bars show a huge rise in messages as the lines spread.
- C is wrong. The graph counts messages, not people. Nothing mentions “earlier hesitations” either.
- D is wrong. Paragraph 8 does mention reading code “in real time,” or right away. But the graph shows totals only. It can’t show what caused the rise or how fast messages moved.
Choose the answer
The graph shows messages rising from about 10 million to about 155 million as the wires spread. So the answer is B, “It provides evidence of the dramatic increase in the number of telegraph messages as Morse’s system expanded across the United States.”
Why this answer and not the closest wrong one
D is the closest trap, since paragraph 8 really does mention reading code in real time. But ask what the side of the graph measures. It counts messages, nothing else. A count can show that use grew, as B says. It can’t show that messages got faster, or why.
More questions like this
The original DOE question
The passage “Invention of the Telegraph” as printed (pages 146–148)
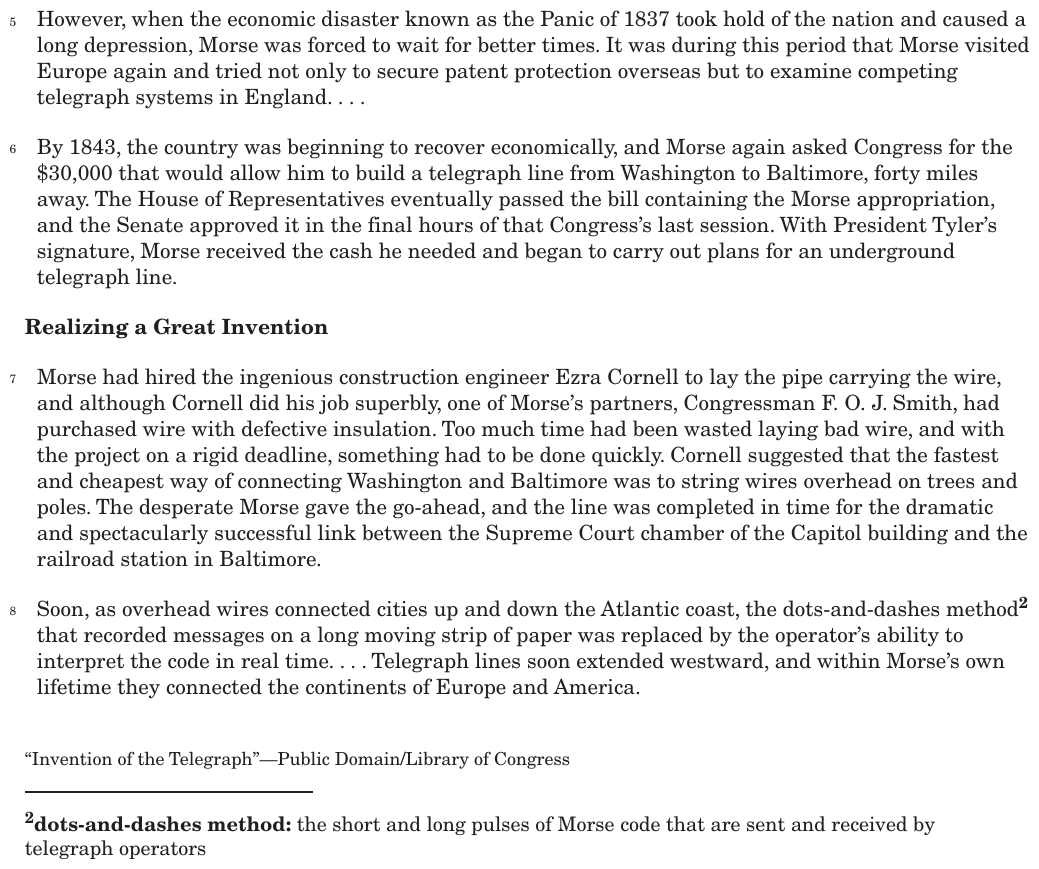
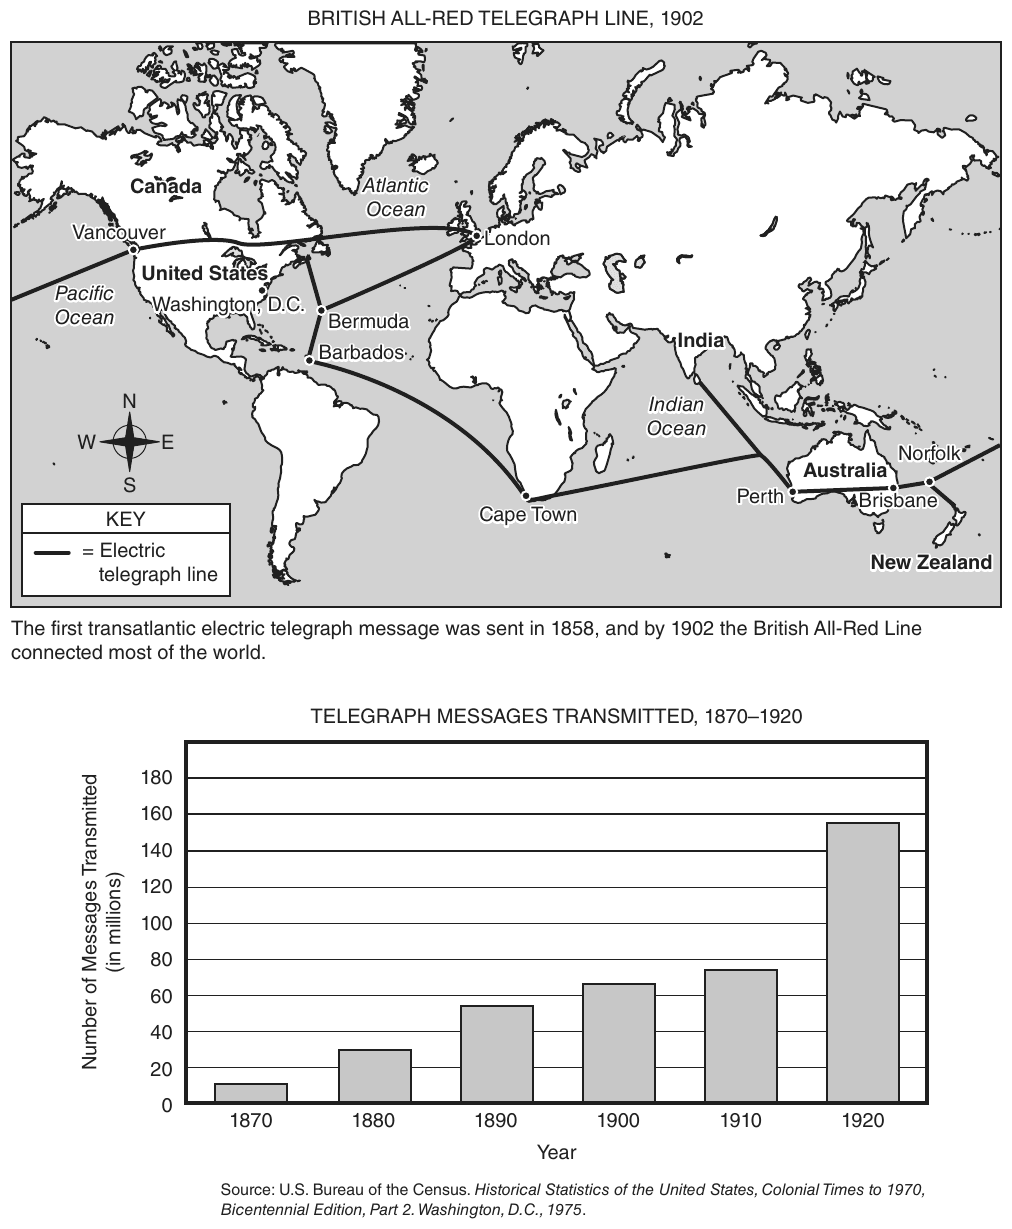
Question 40 of 42
2018 Test B Math, question 23Question
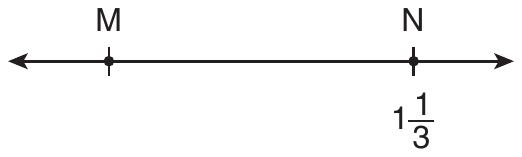
On the number line above, . What is the position of point ?
- A
- B
- C
- D
Show the answer
Correct answer: B
To find , subtract and set it equal to the length:
Question analysis
This number line question gives the distance between points M and N as a mixed number and asks for the position of M. Students subtract fractions with unlike denominators, moving past zero into negative numbers. Direction along the line and the sign of the result are where it gets tricky.
- Grade level
- Grade 7 content, by NYS standard
- Compared with grade 7
- At grade 7 Grade 7 students find distances on a number line as the absolute value of a difference. Doing it with mixed numbers that have unlike denominators, and crossing zero, is a typical and slightly demanding grade 7 task.
- Estimated difficulty
- Moderate: several steps, or a close reading with one strong distractor.
- Thinking it demands
- Depth of knowledge 2, skills and concepts · mainly apply
- What makes it hard
- Reading a figure, table or graph moderate
- Error-prone arithmetic moderate
- A very close wrong answer moderate
- Solution
- 3 steps
- Reading level
- Question and choices: about grade 8, 17 words.
- Students, last 30 days
- Not enough answers yet to show (it takes 10).
Why it is hard, traps and wrong answers (shows the answer)
Why it is hard
The distance is given and one endpoint is known, so the question is really about direction and sign. Because the drawing shows no zero, students must reason that moving 5 5/6 to the left from 1 1/3 carries M past zero. The choices pair each size with each sign, so getting the size right is only half the work; the sign decides between two choices.
Reading a figure, table or graph moderate Understanding the question
The number line labels only N, at 1 1/3, and shows no zero, so students must see from the picture that M lies left of N and work out whether it passes zero. (Lesh, Post & Behr, 1987; Kirsch & Mosenthal, 1990)
Error-prone arithmetic moderate Working it out
The subtraction 1 1/3 − 5 5/6 mixes unlike denominators and crosses zero: in sixths it is 8/6 − 35/6 = −27/6, which then reduces to a mixed number. (Brown & Burton, 1978; Junker & Sijtsma, 2001)
A very close wrong answer moderate Choosing the answer
4 1/2 and −4 1/2 are written the same except for the sign; only noticing that M lies left of N, so below 1 1/3, separates them. (Embretson & Wetzel, 1987; Gorin & Embretson, 2006; Ascalon et al., 2007)
Strategy: Read N's coordinate from the number line, convert everything to sixths, and move the given distance from N toward M's side of the line.
Traps
- Negatives and direction: Arithmetic with negative numbers, the order of a subtraction, or direction on a number line. (Moving a term across the equals sign without changing its sign is a faulty procedure.)
The wrong answers, classified
A Negatives and direction (Brown & Burton, 1978)
Adds the length to N's coordinate, 1 1/3 + 5 5/6 = 7 1/6, and makes it negative because M is on the left.
C Negatives and direction (Brown & Burton, 1978)
Computes 5 5/6 − 1 1/3, the right size, but keeps it positive, which would put M to the right of N.
D Numbers taken from the question (Hegarty, Mayer & Monk, 1995)
Adds the two numbers in the question, 1 1/3 + 5 5/6, placing M to the right of N against the figure.
Worked solution, step by step
Formulas used
- Distance on a number line
- On a number line, numbers grow as you move right. The distance between two points is the larger number minus the smaller one. That is the right point minus the left point, so a distance is never negative.
- Mixed number to fraction
- a is the whole number part, b is the top of the fraction, and c is the bottom. Each whole holds c pieces, so a wholes hold a times c pieces. Then add the b extra pieces.
Read the number line
Point N is at . Point M is to the left of N. MN means the distance from M to N, and it is .
You need the number at point M.
Decide which way to move
On a number line, numbers get smaller as you move left. M is left of N, so N is the right point.
So M is what you get when you take the distance away from N.
The distance is bigger than , so you will pass 0. M will be negative.
Change both numbers to sixths
To subtract, the fractions need the same bottom number. Use sixths, since 3 goes into 6. Change each mixed number to an improper fraction, a fraction whose top is bigger than its bottom.
Subtract and simplify
27 sixths is 4 wholes (24 sixths) and 3 sixths more. And . So M is .
Watch out: without the minus sign is choice C. That point would be to the right of N, not the left.
So the answer is B, .
Check your answer
Find the distance from your M to N. From to 0 is , or . From 0 to N is . Together, . That matches MN.
More questions like this
The original DOE question
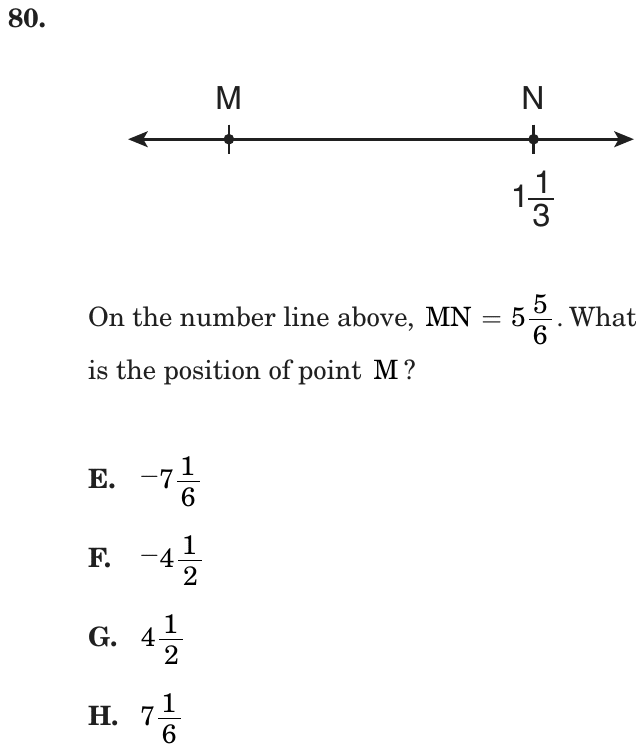
Question 41 of 42
2018 Test B Math, question 44Question
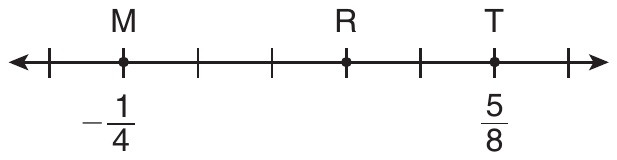
The hash marks on the number line above are evenly spaced. What is the coordinate of point ?
- A
- B
- C
- D
Show the answer
Correct answer: C
There are 5 sections between M and T. To find the length of one of these sections, find the distance between M and T and divide by 5:
R is 3 sections away from M, so add:
R is located at .
Question analysis
Students find the fraction at point R on a number line with evenly spaced hash marks, where M is at −1/4 and T is at 5/8. It tests fraction arithmetic with negative numbers. Working out the size of one gap and counting gaps from M to R takes several careful steps.
- NYS standards
- Grade level
- Grade 7 content, by NYS standard
- Compared with grade 7
- Above grade 7 Grade 7 students place fractions and negatives on number lines, but here they must subtract a negative fraction, divide by five, and then add back. Four fraction steps with unlike denominators make it harder than typical classwork.
- Estimated difficulty
- Hard: combines ideas, needs a plan, and has more than one tempting wrong answer.
- Thinking it demands
- Depth of knowledge 2, skills and concepts · mainly apply
- What makes it hard
- Error-prone arithmetic major
- Reading a figure, table or graph moderate
- Solution
- 4 steps
- Reading level
- Question and choices: about grade 6, 22 words.
- Students, last 30 days
- Not enough answers yet to show (it takes 10).
Why it is hard, traps and wrong answers (shows the answer)
Why it is hard
Fractions, a negative starting point and a count of spaces all have to come out right together. Students lose points by counting tick marks instead of spaces, by subtracting −1/4 as if it were positive, or by measuring R from 0 instead of from M. Converting both labels to fortieths first, −10/40 and 25/40, makes each gap a whole number of fortieths.
Error-prone arithmetic major Working it out
The gap length needs 5/8 − (−1/4) = 7/8, then 7/8 ÷ 5 = 7/40, then −10/40 + 21/40: negatives and three different denominators meet in one problem. (Brown & Burton, 1978; Junker & Sijtsma, 2001)
Reading a figure, table or graph moderate Understanding the question
The hash marks have to be counted as spaces: five from M to T, with R three spaces past M, while the unlabeled marks outside M and T play no part. (Lesh, Post & Behr, 1987; Kirsch & Mosenthal, 1990)
Strategy: Find the distance from M to T by subtracting their coordinates, divide it by the number of equal gaps, then step from M toward T by the right number of gaps.
Traps
- Stops one step early: A choice is a number from partway through the solution.
- Negatives and direction: Arithmetic with negative numbers, the order of a subtraction, or direction on a number line. (Moving a term across the equals sign without changing its sign is a faulty procedure.)
The wrong answers, classified
A Stops one step early (King et al., 2004; Gierl et al., 2017)
Finds the length of one gap, 7/8 ÷ 5 = 7/40, and gives it as R's coordinate without stepping from M.
B Negatives and direction (Brown & Burton, 1978)
Subtracts as 5/8 − 1/4 = 3/8 instead of adding, gets gaps of 3/40, and counts three gaps from 0.
D Stops one step early (King et al., 2004; Gierl et al., 2017)
Multiplies the 7/40 gap by 3 to get the distance from M to R, then forgets to add it to M's −1/4.
Worked solution, step by step
Formulas used
- Distance on a number line
- The right number is the point farther to the right on the number line. The left number is the other point. Subtracting tells how many units apart they are. Taking the left from the right keeps the answer positive.
- Dividing a fraction by a whole number
- a over b is the fraction, and c is the whole number you divide by. Splitting a fraction into c equal parts makes each part c times smaller. So you multiply the bottom number, b, by c.
Read the number line
M is at and T is at . The hash marks are evenly spaced, so every space is the same length. Count the spaces. From M to T there are 5 spaces. From M to R there are 3 spaces. You need the number at point R.
Find the distance from M to T
Use the distance formula. First write in eighths, as .
Taking away a negative is the same as adding. M and T are apart.
Find the length of one space
The 5 spaces are equal, so divide by 5.
Each space is long.
Watch out: this is the length of one space, not where R is. Stopping here gives choice A.
Step from M to R
R is 3 spaces to the right of M.
Now add that to M. Write as .
Watch out: is how far R is from M, not where R is. Choosing it gives choice D.
Give the answer
Point R is at , a little to the right of 0. So the answer is C, .
Check your answer
Go backward from T instead. T is 2 spaces past R, and . So R is at . Both ways give the same point.
More questions like this
The original DOE question
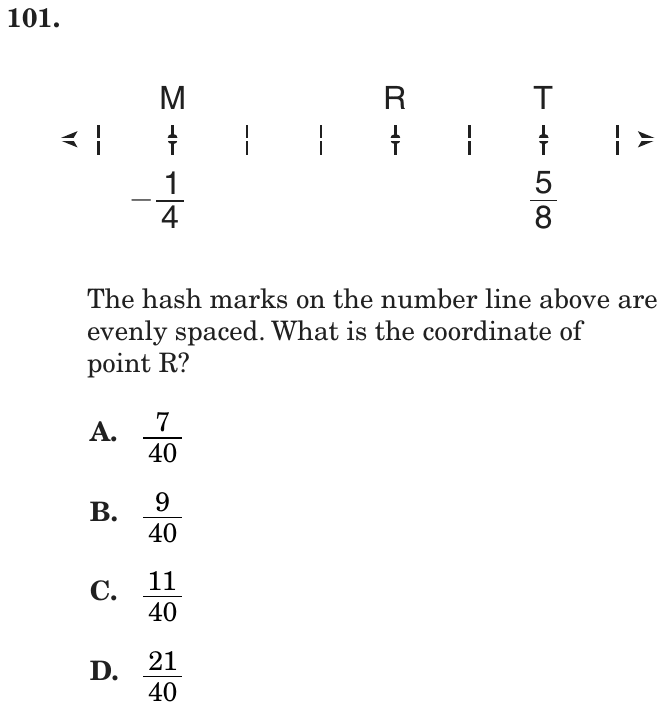
Question 42 of 42
2018 Test B Math, question 50Question
Which number line below shows the solution set for when ?
- A

- B

- C

- D

Show the answer
Correct answer: C
Separate the compound inequality into two pieces:
and
Substitute into each inequality and solve for :
The solution is the number line that shows that is greater than or equal to and less than or equal to .
Question analysis
Students substitute y = 1 into the compound inequality 2x − 2 ≤ y ≤ 4x + 10 and pick the number line that shows the values of x that work. It tests solving two-step inequalities and graphing the solution. The four graphs differ in their endpoints and in whether the shading is closed off on both sides, so each endpoint has to be found exactly.
- Grade level
- Grade 7 content, by NYS standard
- Compared with grade 7
- Above grade 7 Grade 7 students solve and graph one two-step inequality. This compound inequality in two variables requires substituting, solving two inequalities and combining them into one interval, a step toward algebra 1.
- Estimated difficulty
- Hard: combines ideas, needs a plan, and has more than one tempting wrong answer.
- Thinking it demands
- Depth of knowledge 2, skills and concepts · mainly apply
- What makes it hard
- Many steps moderate
- Error-prone arithmetic moderate
- Reading a figure, table or graph moderate
- A very close wrong answer minor
- Solution
- 4 steps
- Reading level
- Question and choices: about grade 9, 12 words.
- Students, last 30 days
- Not enough answers yet to show (it takes 10).
Why it is hard, traps and wrong answers (shows the answer)
Why it is hard
Substituting y = 1 is easy; the work is solving two inequalities and matching a fractional interval to a graph. Students who solve only the left inequality find a matching ray, and sign slips on either endpoint produce intervals that shift or flip across zero. The graphs differ by quarter-unit ticks, so reading them carefully matters as much as the algebra.
Many steps moderate Working it out
The compound inequality must be split into 2x − 2 ≤ 1 and 1 ≤ 4x + 10, each solved for x, and the two results joined into one interval. (Daniel & Embretson, 2010; Enright, Morley & Sheehan, 2002)
Error-prone arithmetic moderate Working it out
Both endpoints are fractions, 3/2 and −9/4, and the second comes from dividing −9 by 4, where a lost sign moves the endpoint across zero. (Brown & Burton, 1978; Junker & Sijtsma, 2001)
Reading a figure, table or graph moderate Understanding the question
The graphs are marked in quarter units, so −2 1/4 and 1 1/2 have to be found by counting small ticks between the labeled integers. (Lesh, Post & Behr, 1987; Kirsch & Mosenthal, 1990)
A very close wrong answer minor Choosing the answer
The ray ending at 1 1/2 looks almost like the right segment, sharing its right end; only the left end, an arrow instead of a closed dot at −2 1/4, separates them. (Embretson & Wetzel, 1987; Gorin & Embretson, 2006; Ascalon et al., 2007)
Strategy: Split the compound inequality into two separate inequalities, solve each for x after putting 1 in for y, then combine the two results into a single interval and match it to a graph.
Traps
- Negatives and direction: Arithmetic with negative numbers, the order of a subtraction, or direction on a number line. (Moving a term across the equals sign without changing its sign is a faulty procedure.)
- Stops one step early: A choice is a number from partway through the solution.
The wrong answers, classified
A Negatives and direction (Brown & Burton, 1978)
Gets the left endpoint −2 1/4 right but gives the right endpoint the wrong sign, ending the segment at −1 1/2 instead of 1 1/2.
B Negatives and direction (Brown & Burton, 1978)
Gives both endpoints the opposite sign, so the segment runs from −1 1/2 to 2 1/4, the true interval reflected across 0.
D Stops one step early (King et al., 2004; Gierl et al., 2017)
Solves only 2x − 2 ≤ 1 and graphs every x up to 1 1/2, leaving out the lower bound that 1 ≤ 4x + 10 sets.
Worked solution, step by step
Formulas used
- Solving an inequality
- a, b and c are numbers. The sign ≤ means is less than or equal to. Adding or subtracting the same number c on both sides keeps it true. Dividing both sides by the same positive number also keeps it true.
Sort out the question
The sign means is less than or equal to. An inequality compares two amounts that may not be equal. The statement is two inequalities joined together. You put 1 in place of . Then you need every that makes both parts true.
Split it into two parts
With , the statement becomes two inequalities.
The answer must make both of them true at the same time.
Solve the first part
Add 2 to both sides. Then divide both sides by 2.
So is at most . This is the right end of the answer.
Watch out: the right end is a positive number. Choice A ends its bar at instead.
Solve the second part
Subtract 10 from both sides. Then divide both sides by 4.
So is at least . This is the left end.
Watch out: keep the minus sign. Choice B uses the opposite signs and ends at .
Put the two parts together
The answer is every number from to , with both ends included. On the graph, that is a solid bar with a dot at each end. The small ticks are quarters. So count 1 tick left of −2 and 2 ticks right of 1.
Watch out: choice D uses only the first part. Its arrow goes left forever.
Give the answer
Choice C shows a bar from to , with dots at both ends. So the answer is C.
Check your answer
Test a number on the bar, like . Then and , and 1 is between them. Now test , which is off the bar. Then , and 1 is not less than −2. So the bar must stop on the left, which rules out D.
More questions like this
The original DOE question