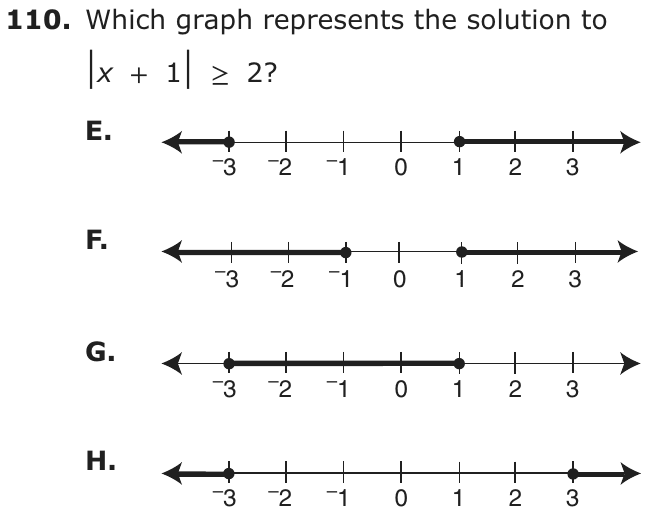
Question
Which graph represents the solution to ?
- A

- B

- C

- D

Show the answer
Correct answer: A
Since , either or .
Solving for x gives .
Solving for x gives .
A filled circle on a number line represents “or equal to.” So the correct number line representation has filled circles at −3 and 1, with the number line filled to the left of −3 for “less than” and to the right of 1 for “greater than.”
Question analysis
Students choose the number line graph that shows every solution of an inequality in which x + 1 sits inside absolute value bars. It tests absolute value as distance and graphing inequalities. The tricky part is turning one absolute value statement into two pieces and placing each boundary point and shaded ray correctly.
- NYS standards
- Grade level
- Grade 7 content, by NYS standard
- Compared with grade 7
- Above grade 7 Grade 7 students solve and graph two-step inequalities and know absolute value as distance. An inequality with an absolute value has to be split into two cases, which is outside the grade 6 to 8 standards and well above typical grade 7 work.
- Estimated difficulty
- Hard: combines ideas, needs a plan, and has more than one tempting wrong answer.
- Thinking it demands
- Depth of knowledge 2, skills and concepts · mainly apply
- What makes it hard
- Something you must already know moderate
- A very close wrong answer moderate
- Reading a figure, table or graph minor
- Solution
- 3 steps
- Reading level
- Question and choices: about grade 9, 7 words.
- Students, last 30 days
- Not enough answers yet to show (it takes 10).
Why it is hard, traps and wrong answers (shows the answer)
Why it is hard
Reading |x + 1| as the distance from x to −1 makes this quick: the points 2 units away are −3 and 1, and greater than or equal means outside them. Students who solve only one case and mirror it across 0 land on graphs centered on 0, and students who find both endpoints may still shade between them. The graphs differ in just one dot or one shading choice, so each must be read carefully.
Something you must already know moderate Working it out
Solving |x + 1| ≥ 2 needs two cases, x + 1 ≤ −2 or x + 1 ≥ 2, joined by or; absolute value inequalities go beyond grade 7, and the stem gives no hint. (Anderson & Krathwohl, 2001)
A very close wrong answer moderate Choosing the answer
The right graph and the segment from −3 to 1 share both filled endpoints, so only deciding between outside and between the boundaries separates them. (Embretson & Wetzel, 1987; Gorin & Embretson, 2006; Ascalon et al., 2007)
Reading a figure, table or graph minor Understanding the question
Four number lines must be read for filled dots and arrow directions, and two of them differ from the right one only in where a single dot sits. (Lesh, Post & Behr, 1987; Kirsch & Mosenthal, 1990)
Strategy: Read the absolute value as distance from −1 on the number line, find the points exactly 2 units away, and decide whether the solutions lie between or outside them.
Traps
- Misunderstands the concept: A wrong belief about a concept: that percents can be added, that area grows like length, that averages can be averaged, that a bigger denominator means a bigger fraction.
- Negatives and direction: Arithmetic with negative numbers, the order of a subtraction, or direction on a number line. (Moving a term across the equals sign without changing its sign is a faulty procedure.)
The wrong answers, classified
B Misunderstands the concept (Smith, diSessa & Roschelle, 1993; De Bock et al., 1998; Ni & Zhou, 2005)
Solves x + 1 ≥ 2 to get x ≥ 1, then mirrors it across 0 to x ≤ −1, as if the solution were centered on 0 rather than on −1.
C Negatives and direction (Brown & Burton, 1978)
Finds −3 and 1 but shades between them, the solution of |x + 1| ≤ 2, reversing which side of the boundaries lies at least 2 units from −1.
D Misunderstands the concept (Smith, diSessa & Roschelle, 1993; De Bock et al., 1998; Ni & Zhou, 2005)
Solves x + 1 ≤ −2 to get x ≤ −3, then mirrors it across 0 to x ≥ 3, assuming the boundaries are symmetric about 0.
Worked solution, step by step
Formulas used
- Absolute value as distance
- x and a are points on the number line. The bars mean absolute value. |x − a| is how far apart the two points are, which is never negative. Since x + 1 = x − (−1), |x + 1| is the distance from x to −1.
Sort out the question
You need the graph of every x that makes true. The sign ≥ means greater than or equal to. The bars mean absolute value.
On a number line, a filled dot means that point counts. A thick line with an arrow means all the numbers that way count too.
Read it as a distance
Adding 1 is the same as subtracting −1, so . By the formula, is the distance from x to −1.
So the inequality says that x is at least 2 units away from −1.
Find the two boundary points
Start at −1 and go 2 units each way.
At −3 and at 1, the distance is exactly 2. The words or equal to let them count, so they get filled dots.
Decide which side to shade
Being at least 2 away means being farther out. Numbers between −3 and 1 are too close to −1. For example, 0 is only 1 unit away. So shade to the left of −3 and to the right of 1.
In algebra, that is or . These give or .
Match the graph
Choice A has filled dots at −3 and 1, with arrows going outward. That matches.
Watch out: Choice C shades between −3 and 1. Those are the points within 2 of −1, the answer to . Choices B and D are centered on 0, but the center here is −1.
So the answer is A, the graph shaded outward from −3 and 1.
Check your answer
Test a point from each part. For x = 2, , and 3 is at least 2. For x = 0, , which is less than 2. For x = −3, , which counts. Graph A agrees with all three.
More questions like this
The original DOE question