Question
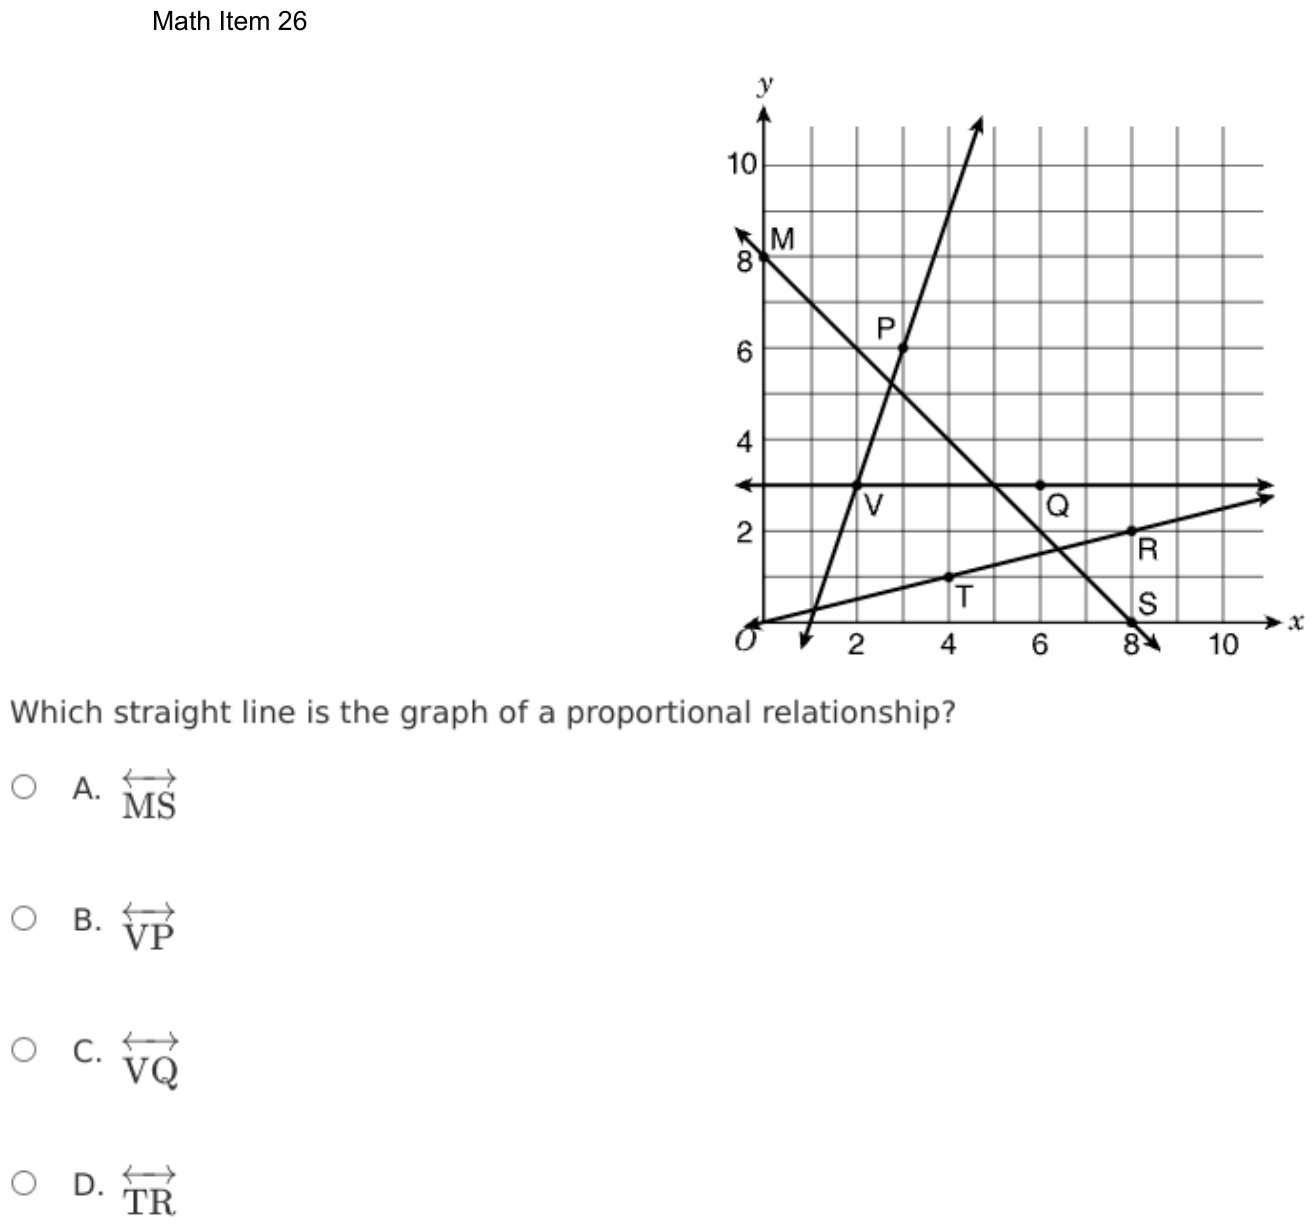
Which straight line is the graph of a proportional relationship?
- A
- B
- C
- D
Show the answer
Correct answer: D
The graph of any proportional line must intersect the origin, .
The only line on the coordinate plane that contains is .
Both point and point have a y-value that is of the x-value, and every point on the line fits the proportional equation .
When . So the line contains the origin, .
Question analysis
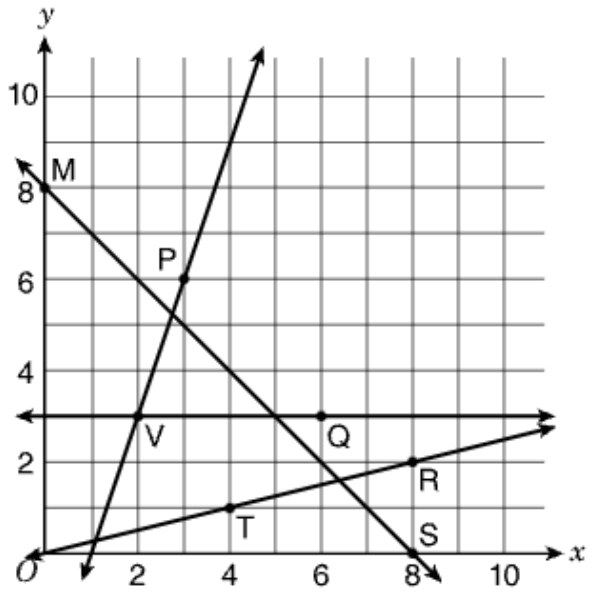
A coordinate grid shows four straight lines, each named by two labeled points such as M and S or V and Q, and students choose the one that is the graph of a proportional relationship. It tests recognizing proportional relationships on a graph. Every line is straight, so being straight is not enough, and the lines must be told apart by what defines proportionality.
- NYS standards
- 7.RP.2a testing for proportionality
- Grade level
- Grade 7 content, by NYS standard
- Compared with grade 7
- At grade 7 Deciding from a graph whether a relationship is proportional is a named grade 7 skill, and this is a typical case: four lines on a clean grid, each checked against the same rule, with no calculation needed.
- Estimated difficulty
- Routine: one familiar step, little to misread.
- Thinking it demands
- Depth of knowledge 1, recall and reproduction · mainly understand
- What makes it hard
- Solution
- 1 step
- Reading level
- Question and choices: about grade 9, 14 words.
- Corrected from the DOE handbook
- Coordinates and an equation in the explanation were corrected to match the graph.
- Students, last 30 days
- Not enough answers yet to show (it takes 10).
Why it is hard, traps and wrong answers (shows the answer)
Why it is hard
Once the origin rule is recalled, the graph answers the question at a glance: only the line from O through T and R starts at (0, 0). Students who think of proportional as any steady pattern have three other candidates, from the falling line through M and S to the flat line at height 3. The steep line through V and P is the closest call, because its lower end disappears near the corner where the axes meet.
Something you must already know minor Working it out
The rule that a proportional graph is a straight line through the origin is not printed, and all four lines are straight, so straightness alone rules none of them out. (Anderson & Krathwohl, 2001)
Reading a figure, table or graph minor Understanding the question
Line VP runs off the grid just right of O, crossing the x-axis at (1, 0), so whether it passes through the origin has to be read from the gridlines, not from its general direction. (Lesh, Post & Behr, 1987; Kirsch & Mosenthal, 1990)
Strategy: Recall what every proportional graph must look like, then test each line: see where it would be when x is 0, and whether y divided by x stays the same at both labeled points.
Traps
- Misunderstands the concept: A wrong belief about a concept: that percents can be added, that area grows like length, that averages can be averaged, that a bigger denominator means a bigger fraction.
- Misreads the figure: Reads a value, label or tick spacing in a figure, table or graph wrongly.
The wrong answers, classified
A Misunderstands the concept (Smith, diSessa & Roschelle, 1993; De Bock et al., 1998; Ni & Zhou, 2005)
Takes MS as proportional because it is straight and meets both axes, though it starts at (0, 8) and its y-values fall as x rises.
B Misreads the figure (Lesh, Post & Behr, 1987; Kirsch & Mosenthal, 1990)
Sees the steep line’s lower end vanish near O and assumes it passes through the origin, though VP crosses the x-axis at (1, 0).
C Misunderstands the concept (Smith, diSessa & Roschelle, 1993; De Bock et al., 1998; Ni & Zhou, 2005)
Mistakes the steady y-value of 3 along VQ for a constant of proportionality, though y ÷ x falls from 3/2 at V to 1/2 at Q.
What was corrected from the DOE handbook, and why
- Explanation: The DOE’s explanation says “Both point T (1, 4) and point R (2, 8) have a y-value that is 4 times the x-value, and every point on the line fits the proportional equation y = 4x”, and then “When x = 0, y = 4(0).” On the graph, T is at (4, 1) and R at (8, 2): each y-value is 1/4 of its x-value, and the line through the origin, T and R is y = (1/4)x. (The line y = 4x would pass through (1, 4) and (2, 8), which are not marked.) The 2022–23 guide, which first printed this question with the same graph, has the same slip. The site now gives T (4, 1) and R (8, 2), “a y-value that is 1/4 of the x-value”, y = (1/4)x, and y = (1/4)(0) at x = 0. The answer is unchanged: TR is still the only line through the origin.
Worked solution, step by step
Formulas used
- Proportional relationship
- y and x are two amounts that change together. k is the constant of proportionality: the number you always multiply x by to get y. When x is 0, y is k times 0, which is 0. So the graph is a straight line through the origin, the point (0, 0) where the axes meet.
Sort out the question
The grid shows four straight lines. Each one is named by two labeled points on it: line MS, line VP, line VQ and line TR.
You need the line that shows a proportional relationship. In that kind of relationship, y is always the same number times x. For example, y might always be 3 times x.
Recall what a proportional graph looks like
Use the rule . Put in 0 for x:
So every proportional graph goes through the origin. That is the corner point (0, 0), labeled O, where the two axes meet. The graph must also be a straight line.
All four lines here are straight. So being straight does not settle it. Look for the line through O.
Check where each line starts
- Line MS meets the y-axis at M (0, 8). When x is 0, y is 8, not 0.
- Line VP is steep. Its lower end crosses the x-axis at (1, 0), one unit to the right of O.
- Line VQ is flat at a height of 3. It never comes down to 0.
- Line TR starts at O and runs up through T and R.
Watch out: the lower end of line VP looks close to O. Follow it along the grid lines. It misses O by one unit, so choice B is wrong.
Test the ratio on line TR
In a proportional relationship, the ratio y ÷ x is the same at every point. T is at (4, 1) and R is at (8, 2):
Both give . So each y-value is of its x-value, and the line is .
Watch out: line VQ keeps the same y-value, 3, but not the same ratio. At V it is , and at Q it is . So choice C is wrong.
Give the answer
Line MS starts at 8 on the y-axis, so choice A is out too. Only line TR goes through the origin and keeps y ÷ x the same.
So the answer is D, line TR.
Check your answer
Put the origin into the rule for line TR: . So (0, 0) is on the line. Then test R: , which matches R (8, 2). The rule fits every labeled point on the line.
More questions like this
The original DOE question