Table
Question 1 of 35
2026 Practice Test B Math, question 16Question
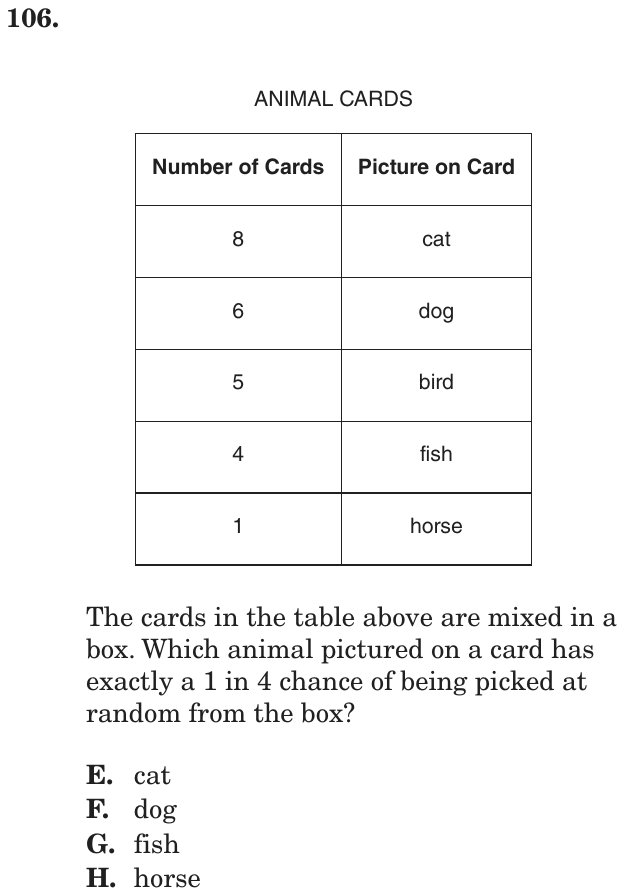
Which tables represent a proportional relationship between the number of books purchased and the total cost?
Select the two correct answers.
Choose every answer that is correct, then check. The DOE has not published how answers with several parts are scored; this site counts one right only when every part is right.
- A
Number of Books Purchased 10 15 20 25 Total Cost ($) 40 60 80 100 - B
Number of Books Purchased 10 15 20 25 Total Cost ($) 70 110 150 250 - C
Number of Books Purchased 10 15 20 25 Total Cost ($) 80 120 160 200 - D
Number of Books Purchased 10 15 20 25 Total Cost ($) 90 130 170 210 - E
Number of Books Purchased 10 15 20 25 Total Cost ($) 100 100 100 100
Show the answer
Correct answer: A and C
The two tables that represent a proportional relationship are tables A and C.
In table A, the total costs divided by the numbers of books for each set of quantities are:
These ratios are equivalent; therefore, these quantities are in a proportional relationship.
In table C, the total costs divided by the numbers of books for each set of quantities are:
These ratios are equivalent; therefore, these quantities are in a proportional relationship.
Question analysis
Five tables list the total cost of buying 10, 15, 20 and 25 books, and students select the two tables that show a proportional relationship between books and cost. It tests recognizing proportional relationships from a constant unit rate. A steady rise in cost is not enough on its own, so each pair of values has to be checked.
- Grade level
- Grade 7 content, by NYS standard
- Compared with grade 7
- At grade 7 Deciding from a table whether two quantities are proportional is a core grade 7 skill, and the divisions here are easy. The demand lies in checking every column of five tables rather than judging by how the costs change.
- Estimated difficulty
- Straightforward: two steps or one careful reading.
- Thinking it demands
- Depth of knowledge 2, skills and concepts · mainly apply
- What makes it hard
- A very close wrong answer moderate
- Every choice must be checked minor
- Something you must already know minor
- Solution
- 2 steps
- Reading level
- Question and choices: about grade 5, 51 words.
- Students, last 30 days
- Not enough answers yet to show (it takes 10).
Why it is hard, traps and wrong answers (shows the answer)
Why it is hard
The divisions are easy, so the question tests what proportional means. Three tables grow by the same amount for every 5 books, and the one with a $10 head start looks just as regular as the right one it copies; only its cost per book, drifting from $9 down to $8.40, gives it away. The flat $100 table and the one that jumps to $250 catch fewer students, and dividing the first and last column of each table is a quick, reliable check.
A very close wrong answer moderate Choosing the answer
The table running $90, $130, $170, $210 is the $80-to-$200 table with $10 added to every cost; both climb $40 for each 5 books, and only the cost per book separates them. (Embretson & Wetzel, 1987; Gorin & Embretson, 2006; Ascalon et al., 2007)
Every choice must be checked minor Choosing the answer
Five tables of four columns each have to be tested by dividing cost by books, and both right tables must be picked to score, so no table can be judged from one column. (Embretson & Wetzel, 1987)
Something you must already know minor Working it out
Students must know that proportional means the same cost per book in every column, a line through zero, not merely a cost that grows by the same amount each time. (Anderson & Krathwohl, 2001)
Strategy: Divide the total cost by the number of books in every column of each table; a table is proportional only when that cost per book stays the same all the way across.
Traps
- Misunderstands the concept: A wrong belief about a concept: that percents can be added, that area grows like length, that averages can be averaged, that a bigger denominator means a bigger fraction.
The wrong answers, classified
B Misunderstands the concept (Smith, diSessa & Roschelle, 1993; De Bock et al., 1998; Ni & Zhou, 2005)
Sees the cost climb $40 for each 5 books across the first three columns and stops checking, though the cost per book goes $7, about $7.33, $7.50, then $10.
D Misunderstands the concept (Smith, diSessa & Roschelle, 1993; De Bock et al., 1998; Ni & Zhou, 2005)
Takes the steady rise of $40 for every 5 books as proportional, but 90 ÷ 10 = 9 while 210 ÷ 25 = 8.4, so the cost per book is not constant.
E Misunderstands the concept (Smith, diSessa & Roschelle, 1993; De Bock et al., 1998; Ni & Zhou, 2005)
Mistakes a cost that never changes for a constant ratio, though $100 for 10 books is $10 a book and $100 for 25 books is $4 a book.
Worked solution, step by step
Formulas used
- Cost per book
- This is the unit rate, the price of one book. Divide the total cost in dollars by the number of books bought. If every book has the same price, this number comes out the same in every column.
- A proportional relationship
- x is the number of books, and y is the total cost in dollars. k is the cost per book, a number that never changes. In a proportional relationship, y is always k times x. So 0 books cost $0, and twice as many books cost twice as much.
Sort out the question
Each table shows the total cost of 10, 15, 20 and 25 books. Proportional means the cost per book is the same in every column. In other words, each book has one fixed price. You must pick the two tables where that is true.
Test the first table
Divide each total cost by its number of books. For table A:
Every column gives $4 per book. So table A is proportional.
Test the other four tables
Do the same division for every table. The numbers are dollars per book:
Table 10 books 15 books 20 books 25 books Same? A 4 4 4 4 Yes B 7 about 7.33 7.50 10 No C 8 8 8 8 Yes D 9 about 8.67 8.50 8.40 No E 10 about 6.67 5 4 No Only tables A and C keep the same price all the way across.
Watch for steady growth
Watch out: table D climbs $40 for every 5 more books, just like table C. That steady climb looks proportional, but it is not enough. D starts $10 higher than C, so its price per book slides from $9 down to $8.40.
Watch out: table E never changes. But $100 for 10 books is $10 each, and $100 for 25 books is $4 each. A total that stays the same is not a price that stays the same.
Name the two answers
Table A charges $4 per book and table C charges $8 per book, in every column. On the test, you check the box next to each of those tables. So the answers are A and C.
Check your answer
In a proportional table, twice the books cost twice as much. In table A, 10 books cost $40 and 20 books cost $80, which is double. In table C, $80 doubles to $160. In table D, $90 would have to double to $180, but the table shows $170. So D fails.
More questions like this
The original DOE question
Question 2 of 35
2026 Practice Test C Math, question 29Question
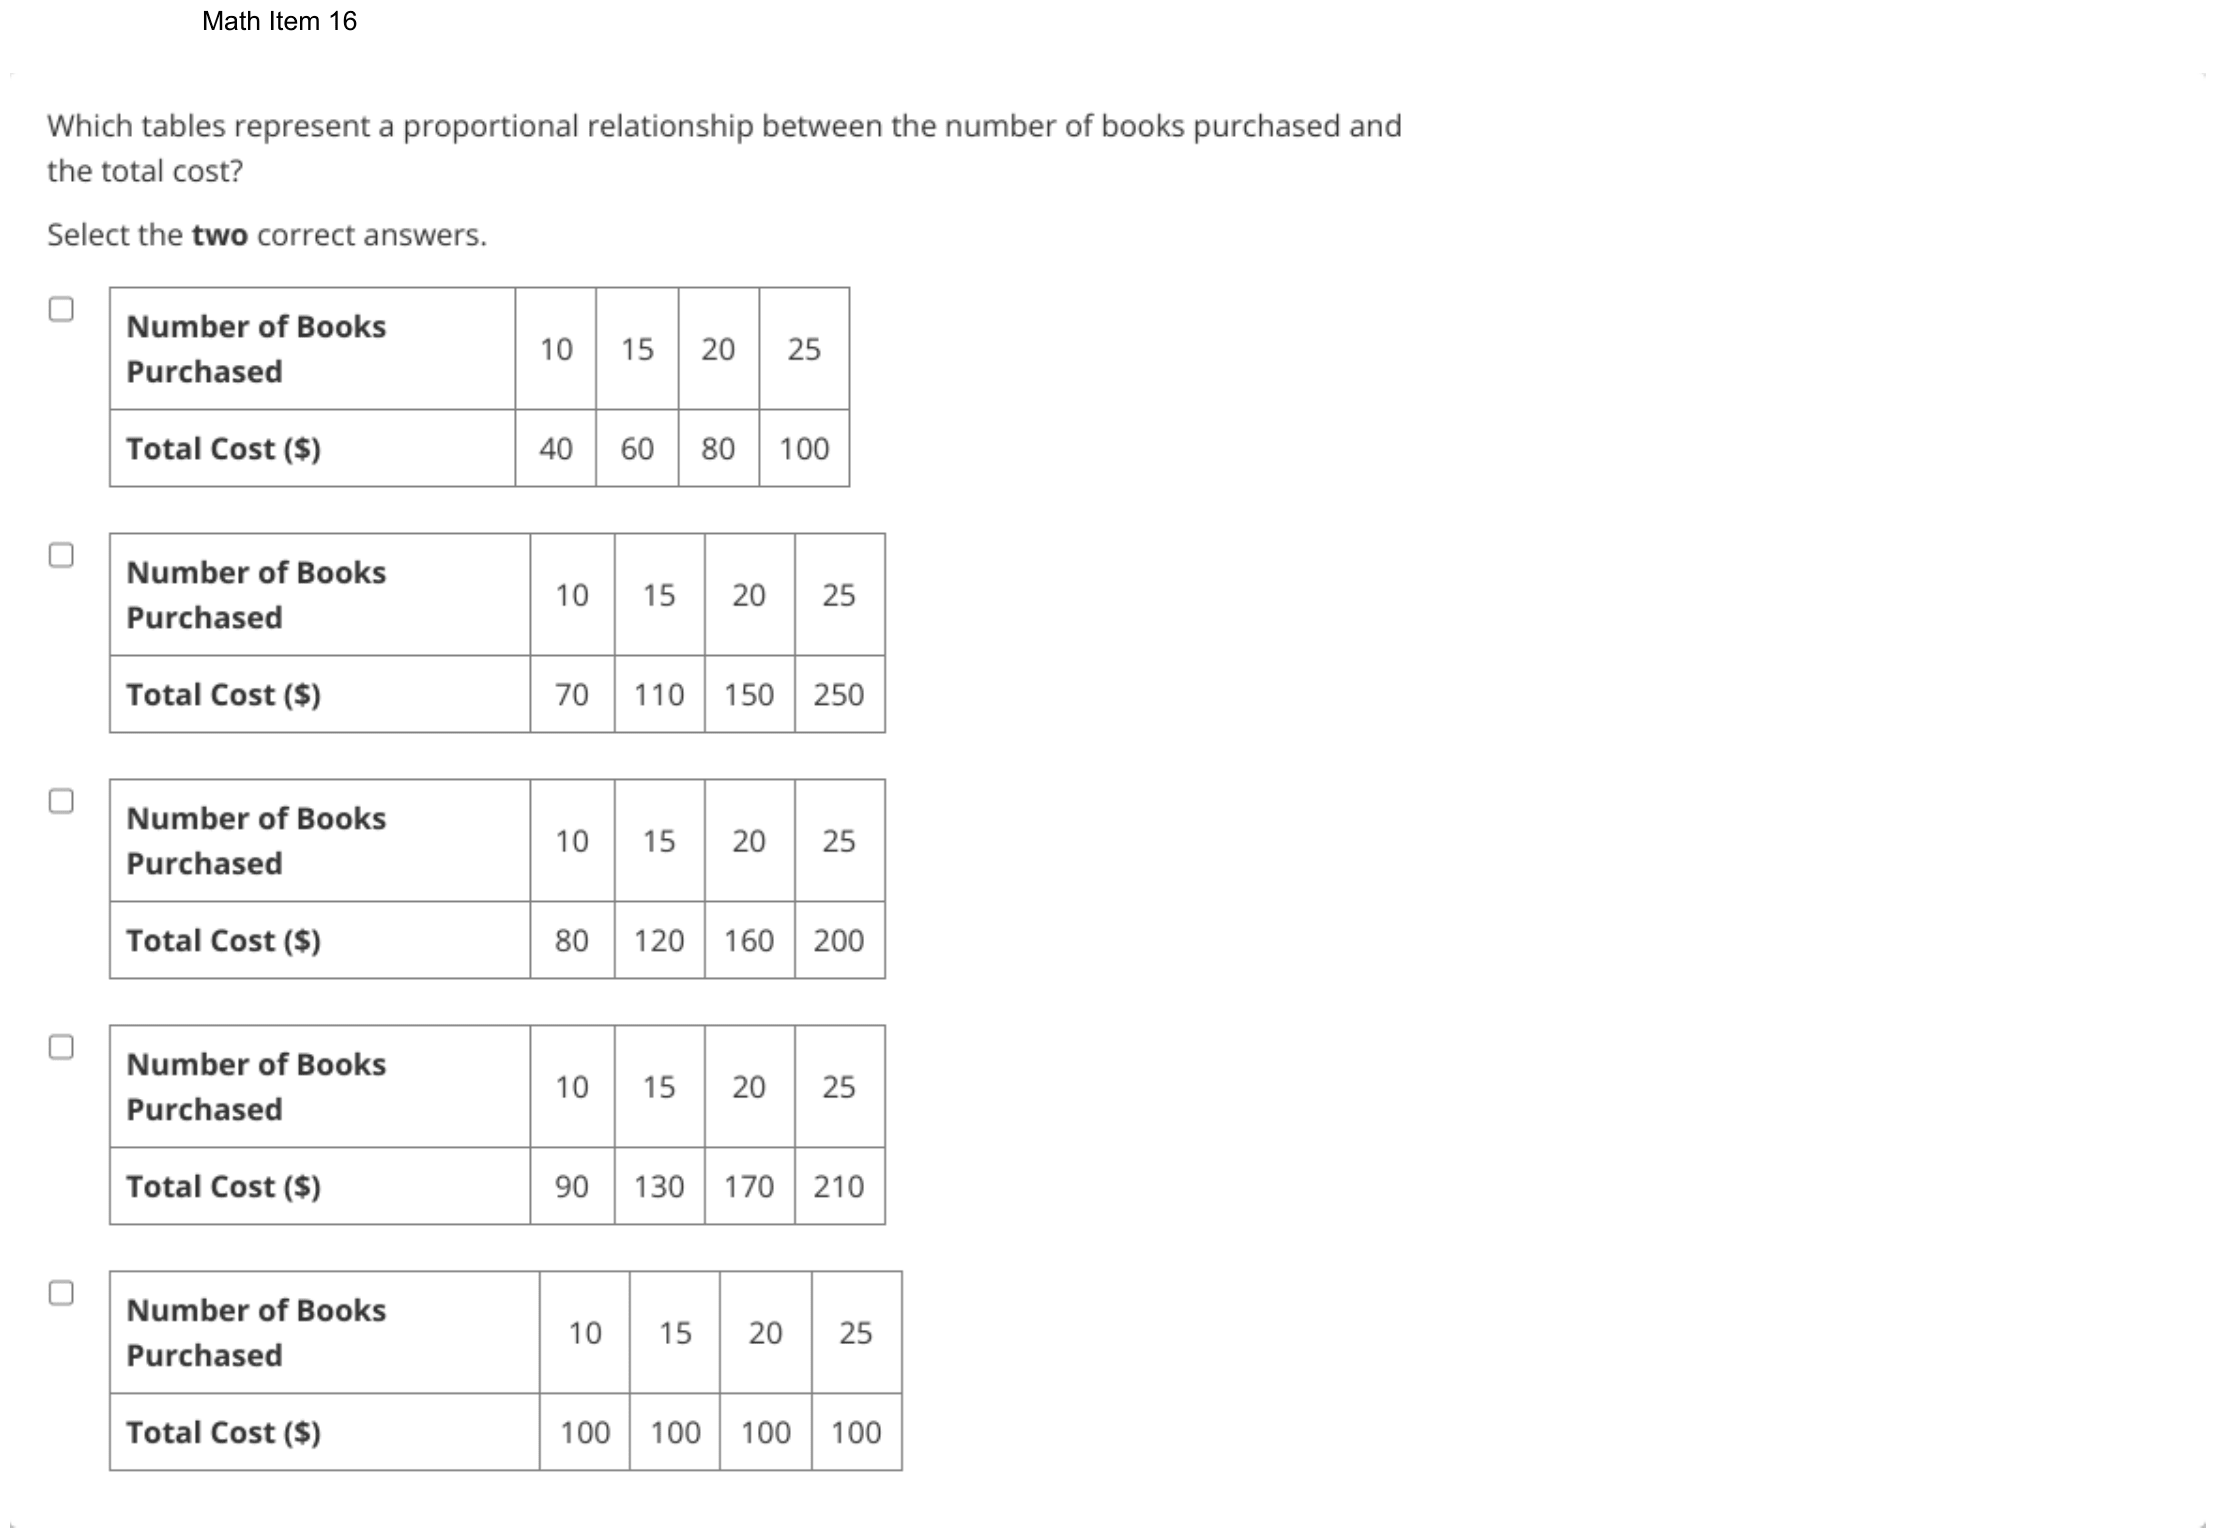
A smoothie shop uses a consistent ratio of fruit to yogurt in its recipes. The table shows the proportional relationship between the number of cups of fruit (x) and the number of cups of yogurt (y) in different smoothie batches.
SMOOTHIE RECIPE
| Cups of Fruit x | Cups of Yogurt y |
|---|---|
| 6 | 1.5 |
| 8 | 2.0 |
| 10 | 2.5 |
| 12 | 3.0 |
What is the constant of proportionality of the number of cups of yogurt to the number of cups of fruit?
Enter your answer in the space.
Fill-in question: work out the answer and type it as a number.
Show the answer
Correct answer: 0.25
To find p, the constant of proportionality of the number of cups of yogurt, y, to the number of cups of fruit, x, use the equation .
The table shows that there are 1.5 cups of yogurt for 6 cups of fruit.
The constant of proportionality is 0.25.
Question analysis
A smoothie shop's recipe table lists cups of fruit and cups of yogurt for four batches in a proportional relationship. Students type the constant of proportionality of yogurt to fruit. It tests finding a unit rate from a table, and since fruit is listed first while the question names yogurt first, the ratio is easy to take upside down.
- Grade level
- Grade 7 content, by NYS standard
- Compared with grade 7
- At grade 7 Finding the constant of proportionality in a table is a core grade 7 skill, and these values are friendly decimals. Typing the answer with no choices, and taking the ratio in the order the question gives, are the added demands.
- Estimated difficulty
- Straightforward: two steps or one careful reading.
- Thinking it demands
- Depth of knowledge 2, skills and concepts · mainly apply
- What makes it hard
- Turning words into math moderate
- An answer in an unexpected form minor
- Solution
- 1 step
- Reading level
- Question and choices: about grade 6, 75 words.
- Students, last 30 days
- Not enough answers yet to show (it takes 10).
Why it is hard, traps and wrong answers (shows the answer)
Why it is hard
Any row gives the answer with one division, and the values divide evenly, so the points are lost on direction. Fruit fills the first column and comes first in the stem’s own ratio, which invites dividing it by the yogurt. The table also climbs by a steady half cup of yogurt, a number that looks like a constant but ignores the 2 cups of fruit added each time. Checking that 0.25 times each fruit value gives its yogurt value settles it.
Turning words into math moderate Understanding the question
The opening sentence speaks of a ratio of fruit to yogurt, but the question asks for the constant of yogurt to fruit, so the division is y ÷ x, against the table’s column order. (Hegarty, Mayer & Monk, 1995; Koedinger & Nathan, 2004)
An answer in an unexpected form minor Choosing the answer
The constant is typed into a box with no choices, so 4, the ratio taken the other way round, is a believable entry that nothing on screen questions. (Enright, Morley & Sheehan, 2002)
Strategy: Check which quantity the question names first, divide that column by the other in any row, and confirm the quotient is the same in a second row.
Traps
- Wrong operation: Adds instead of multiplying, divides the wrong way round, turns a ratio or rate upside down, or undoes a step in the wrong direction (subtracts what should be added back).
- Misunderstands the concept: A wrong belief about a concept: that percents can be added, that area grows like length, that averages can be averaged, that a bigger denominator means a bigger fraction.
- Numbers taken from the question: Combines the numbers in the question without a model of the situation, or is simply a number that appears in the question.
The wrong answers, classified
4 Wrong operation (Hegarty, Mayer & Monk, 1995; King et al., 2004)
Divides cups of fruit by cups of yogurt, 6 ÷ 1.5 = 4, following the stem’s “ratio of fruit to yogurt” and turning the requested constant upside down.
0.5 Misunderstands the concept (Smith, diSessa & Roschelle, 1993; De Bock et al., 1998; Ni & Zhou, 2005)
Takes the steady rise of 0.5 cup of yogurt from row to row as the constant, ignoring that the fruit rises by 2 cups each time.
1.5 Numbers taken from the question (Hegarty, Mayer & Monk, 1995)
Gives 1.5, the first yogurt value in the table, as if the constant were an amount in one batch rather than a ratio of two amounts.
Worked solution, step by step
Formulas used
- Constant of proportionality
- k is the constant of proportionality. y and x are two matching amounts from the same row of the table. In a proportional relationship, y = kx, so y is always k times x. That is why dividing y by x gives the same k in every row.
Sort out the question
The table lists cups of fruit (x) and cups of yogurt (y) for four batches. You need the constant of proportionality of yogurt to fruit.
That is the number of cups of yogurt for each 1 cup of fruit. It is also the number you multiply x by to get y.
Divide yogurt by fruit
Use the first row: 6 cups of fruit and 1.5 cups of yogurt. Yogurt goes on top, because the question says yogurt to fruit:
So there is 0.25 cup, or one quarter of a cup, of yogurt for each cup of fruit.
Watch out: the first sentence says fruit to yogurt, but the question asks the other way. Dividing turns the answer upside down.
Check two more rows
The constant must be the same in every row. Test two more:
They match. Watch out: the yogurt goes up by 0.5 cup from row to row. That 0.5 is not the constant. The fruit goes up by 2 cups at the same time, and .
Enter the number
Type only the number in the box, with no units. You can type 0.25 or .25. On this site, 1/4 counts too.
So you would enter 0.25.
Check your answer
Multiply each amount of fruit by 0.25. , , and . Every result matches the yogurt column. Also, each batch has less yogurt than fruit, so the constant should be less than 1.
More questions like this
The original DOE question
Question 3 of 35
2026 Practice Test C Math, question 31Question
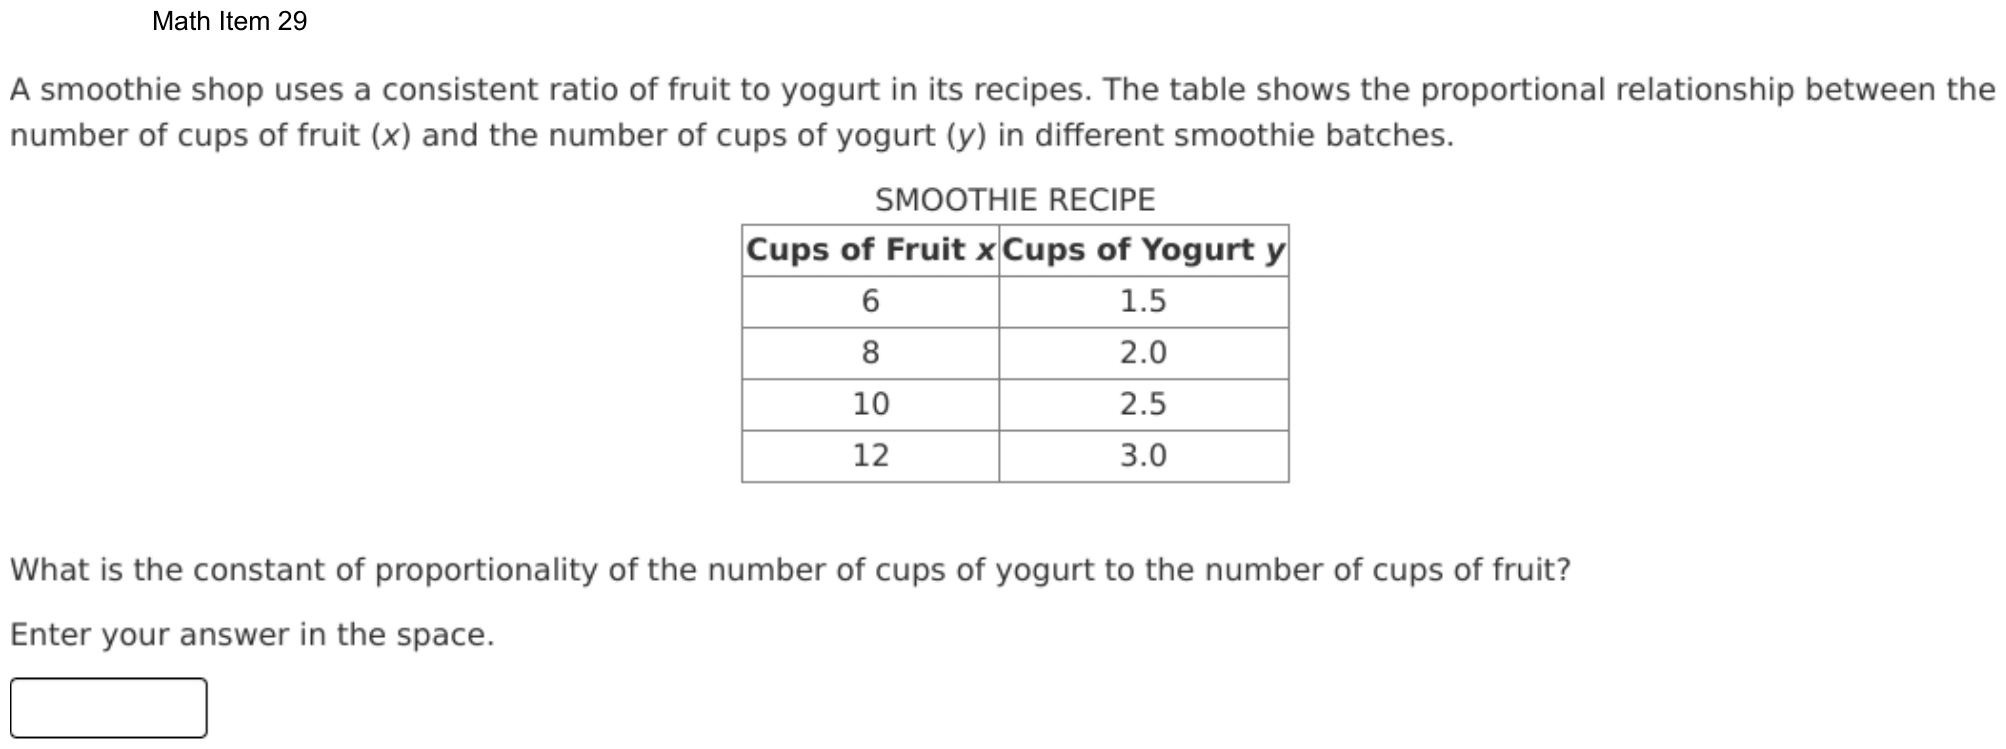
NUMBER OF VISITORS
TO BROOKSIDE ZOO
| Male | Female | |
|---|---|---|
| Children | 360 | 340 |
| Adults | 210 | 290 |
The table above shows the number of people who visited Brookside Zoo in one day. The largest of the four groups made up what percentage of all visitors on that day?
- A30%
- B28%
- C24%
- D17%
Show the answer
Correct answer: A
First, determine the total number of visitors.
The largest group is 360 (Male Children).
Find the percent that represents .
Question analysis
A two-way table counts one day's visitors to Brookside Zoo by age, children or adults, and by male or female. Students find what percent of all visitors the largest of the four groups made up. They must total every cell first, then make sure the count they divide is really the largest one.
- NYS standards
- 6.RP.3c percent as a rate per 100
- Grade level
- Grade 6 content, by NYS standard
- Compared with grade 7
- Below grade 7 Finding what percent one count is of a total is grade 6 work. A two-way table adds two quick steps, totaling the four groups and spotting the largest, but the numbers divide evenly, so it stays below grade 7 demand.
- Estimated difficulty
- Straightforward: two steps or one careful reading.
- Thinking it demands
- Depth of knowledge 1, recall and reproduction · mainly apply
- What makes it hard
- Reading a figure, table or graph minor
- Many steps minor
- Solution
- 3 steps
- Reading level
- Question and choices: about grade 5, 39 words.
- Students, last 30 days
- Not enough answers yet to show (it takes 10).
Why it is hard, traps and wrong answers (shows the answer)
Why it is hard
The arithmetic is friendly, since 360 over 1,200 reduces to 3 over 10, so the work is in reading the table. Two of its cells are close, 340 just below 360, and every wrong choice is the share of one of the other groups. Adding all four counts first, and circling the largest before dividing, keeps the right cell in play.
Reading a figure, table or graph minor Understanding the question
The two-way table gives four separate counts and no totals, so the 1,200 visitors must be added up from the cells and the largest group picked out of a grid. (Lesh, Post & Behr, 1987; Kirsch & Mosenthal, 1990)
Many steps minor Working it out
Three short steps run in order: total the four cells, pick the largest, and divide; using the wrong cell in the last step still gives a believable percent. (Daniel & Embretson, 2010; Enright, Morley & Sheehan, 2002)
Strategy: Add all four cells for the day's total, pick the biggest single cell, and divide it by the total; simplifying the fraction before dividing keeps the arithmetic short.
Traps
- Misreads the question: Misses or misreads a condition or a word in the question: "at least", "each", "remaining", "not".
- Answers a different question: A choice is right for another quantity: the other unknown, the rest instead of the part, the part instead of the whole.
- Misreads the figure: Reads a value, label or tick spacing in a figure, table or graph wrongly.
The wrong answers, classified
B Misreads the figure (Lesh, Post & Behr, 1987; Kirsch & Mosenthal, 1990)
Takes 340, the female children, as the largest cell, misjudging it against the 360 male children beside it, so 340 ÷ 1,200 ≈ 28%.
C Answers a different question (King et al., 2004; Hegarty, Mayer & Monk, 1995)
Answers for the larger adult group, the 290 female adults, as if the question were about adults, so 290 ÷ 1,200 ≈ 24%.
D Misreads the question (Hegarty, Mayer & Monk, 1995)
Reads largest as smallest and uses the 210 male adults, so 210 ÷ 1,200 = 17.5%, and takes the nearest choice.
Worked solution, step by step
Formulas used
- Percent of a whole
- The part is the one group you care about. The whole is everyone. The fraction tells what share of everyone the group is. Multiplying by 100 turns that share into a percent, which means out of 100.
Sort out the question
The table splits one day’s visitors into four groups:
Male Female Children 360 340 Adults 210 290 You need the largest group as a percent of all the visitors. The table gives no total, so you must find it.
Add up all the visitors
Add all four groups to get the whole:
So 1,200 people visited the zoo that day.
Find the largest group
Compare the four numbers. The biggest is 360, the male children.
Watch out: 340 is close to 360, but it is smaller. Using 340 gives about 28%, choice B. Using the 290 female adults gives about 24%, choice C. And 210 is the smallest group, which gives 17.5%, near choice D.
Find the percent
Put the part over the whole. Then simplify by dividing the top and bottom by 120:
Now multiply by 100 to get a percent:
So the male children made up 30% of the visitors.
Give the answer
The largest group, 360 male children, is 30% of all 1,200 visitors.
So the answer is A, 30%.
Check your answer
Work backward. 30% of 1,200 is , the male children. Also, with four groups an even split would be 25% each. The largest group should be a bit more than 25%, and 30% is.
More questions like this
The original DOE question
Question 4 of 35
2026 Practice Test C Math, question 37Question
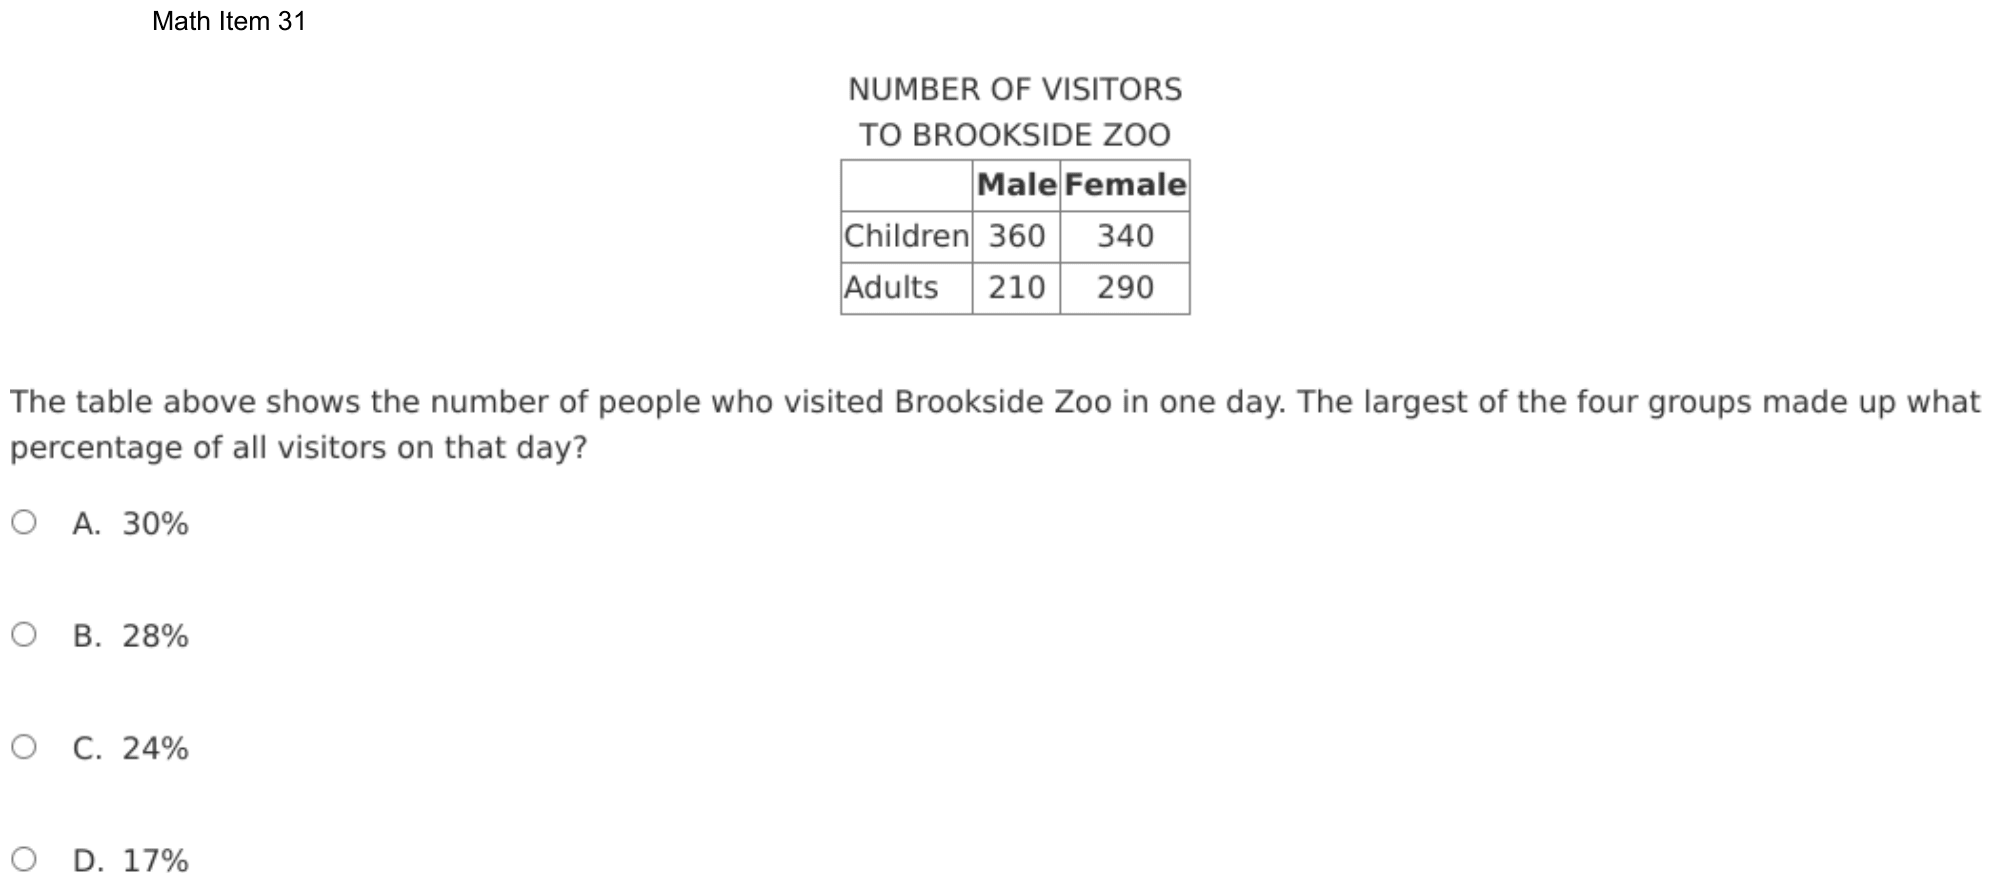
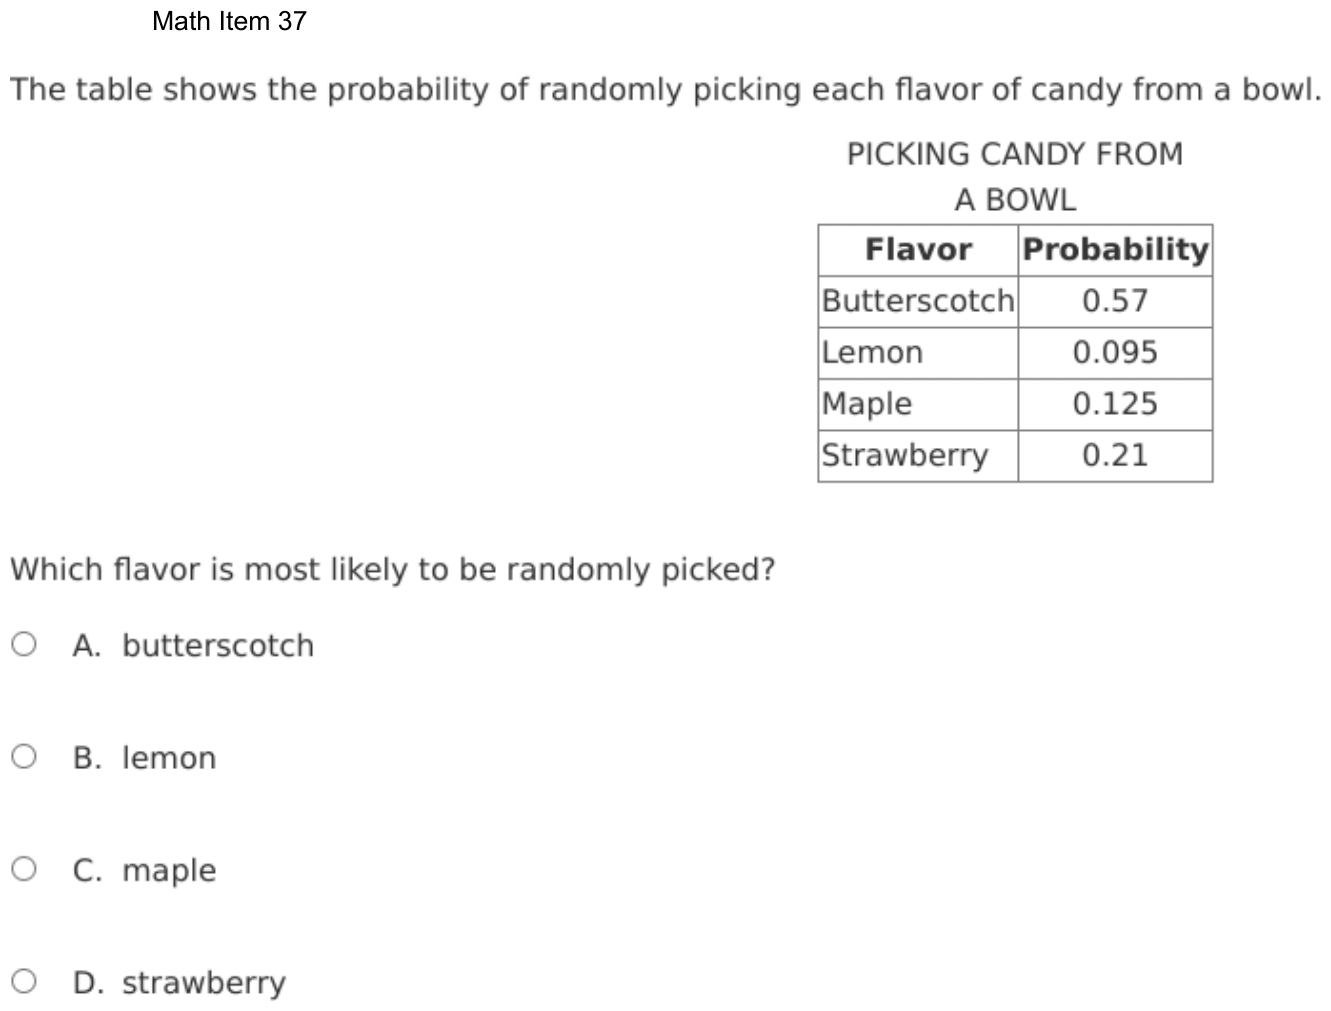
The table shows the probability of randomly picking each flavor of candy from a bowl.
PICKING CANDY FROM
A BOWL
| Flavor | Probability |
|---|---|
| Butterscotch | 0.57 |
| Lemon | 0.095 |
| Maple | 0.125 |
| Strawberry | 0.21 |
Which flavor is most likely to be randomly picked?
- Abutterscotch
- Blemon
- Cmaple
- Dstrawberry
Show the answer
Correct answer: A
The flavor most likely to be picked at random is butterscotch, because its probability is the greatest of the probabilities in the list. More than half the candies in the bowl are butterscotch.
Question analysis
A table lists the probability of picking butterscotch, lemon, maple or strawberry candy at random from a bowl, each as a decimal. Students decide which flavor is most likely to be picked. It tests the meaning of probability and comparing decimals, which have different numbers of digits here and must be compared by place value.
- Grade level
- Grade 6 content, by NYS standard
- Compared with grade 7
- Below grade 7 Reading probabilities as likelihoods is grade 6 content, and this needs only a comparison of four decimals. The one demand is comparing decimals with different numbers of digits, a skill from earlier grades.
- Estimated difficulty
- Routine: one familiar step, little to misread.
- Thinking it demands
- Depth of knowledge 1, recall and reproduction · mainly understand
- What makes it hard
- Error-prone arithmetic minor
- Solution
- 1 step
- Reading level
- Question and choices: about grade 9, 37 words.
- Students, last 30 days
- Not enough answers yet to show (it takes 10).
Why it is hard, traps and wrong answers (shows the answer)
Why it is hard
One idea answers the question: the most likely flavor has the greatest probability. The only obstacle is comparing decimals of different lengths, where 0.125 and 0.095 look bigger than 0.57 to students who count digits. Writing each as thousandths, 570, 95, 125 and 210, or noticing that 0.57 alone is more than one half, makes the order plain.
Error-prone arithmetic minor Working it out
The probabilities have two and three decimal places, 0.57 beside 0.095 and 0.125, so comparing them by length, or by their digits as whole numbers, ranks them wrongly. (Brown & Burton, 1978; Junker & Sijtsma, 2001)
Strategy: Line the four decimals up by place value, adding zeros so each has three decimal places, and compare them digit by digit starting from the tenths place.
Traps
- Misunderstands the concept: A wrong belief about a concept: that percents can be added, that area grows like length, that averages can be averaged, that a bigger denominator means a bigger fraction.
The wrong answers, classified
B Misreads the figure (Lesh, Post & Behr, 1987; Kirsch & Mosenthal, 1990)
Reads lemon’s 0.095 as 0.95, overlooking the 0 in the tenths place, so it looks almost certain and larger than 0.57.
C Misunderstands the concept (Smith, diSessa & Roschelle, 1993; De Bock et al., 1998; Ni & Zhou, 2005)
Treats the decimal with more digits as the larger, or compares 125 with 57 as whole numbers, so 0.125 seems bigger than 0.57.
D Little reason to choose it (Haladyna & Downing, 1993; Rodriguez, 2005)
No common misreading makes 0.21 the largest, since it is neither the longest decimal nor the one with the biggest digits, so it mostly draws guesses.
Worked solution, step by step
Formulas used
- Probability
- P is the probability of picking a flavor. It is a number from 0 to 1. The more candies of a flavor there are, the bigger its probability. So the flavor with the greatest probability is the most likely to be picked.
Sort out the question
The table gives the probability of picking each of four flavors. You need the flavor that is most likely to be picked.
The greater the probability, the more likely the pick. So you need the greatest of the four decimals.
Line up the decimals
The decimals have different numbers of digits. Add zeros at the end so each has three decimal places. This does not change their values:
Flavor Probability Butterscotch 0.570 Lemon 0.095 Maple 0.125 Strawberry 0.210 Compare the tenths digits
Start with the first digit after the decimal point, the tenths place. The tenths digits are 5, 0, 1 and 2. The biggest is 5, so 0.570 is the greatest.
Watch out: 0.125 has more digits than 0.57, but it is smaller. Compare place by place, not by length. That mistake leads to choice C. Also, lemon is 0.095, not 0.95, so choice B is out.
Give the answer
Butterscotch has the greatest probability, 0.57. So it is the flavor most likely to be picked.
So the answer is A, butterscotch.
Check your answer
0.57 is more than 0.5, which is one half. So more than half the candies are butterscotch. The other three flavors add up to , less than half. So butterscotch must be the most likely.
More questions like this
The original DOE question
Question 5 of 35
2026 Practice Test C Math, question 48Question
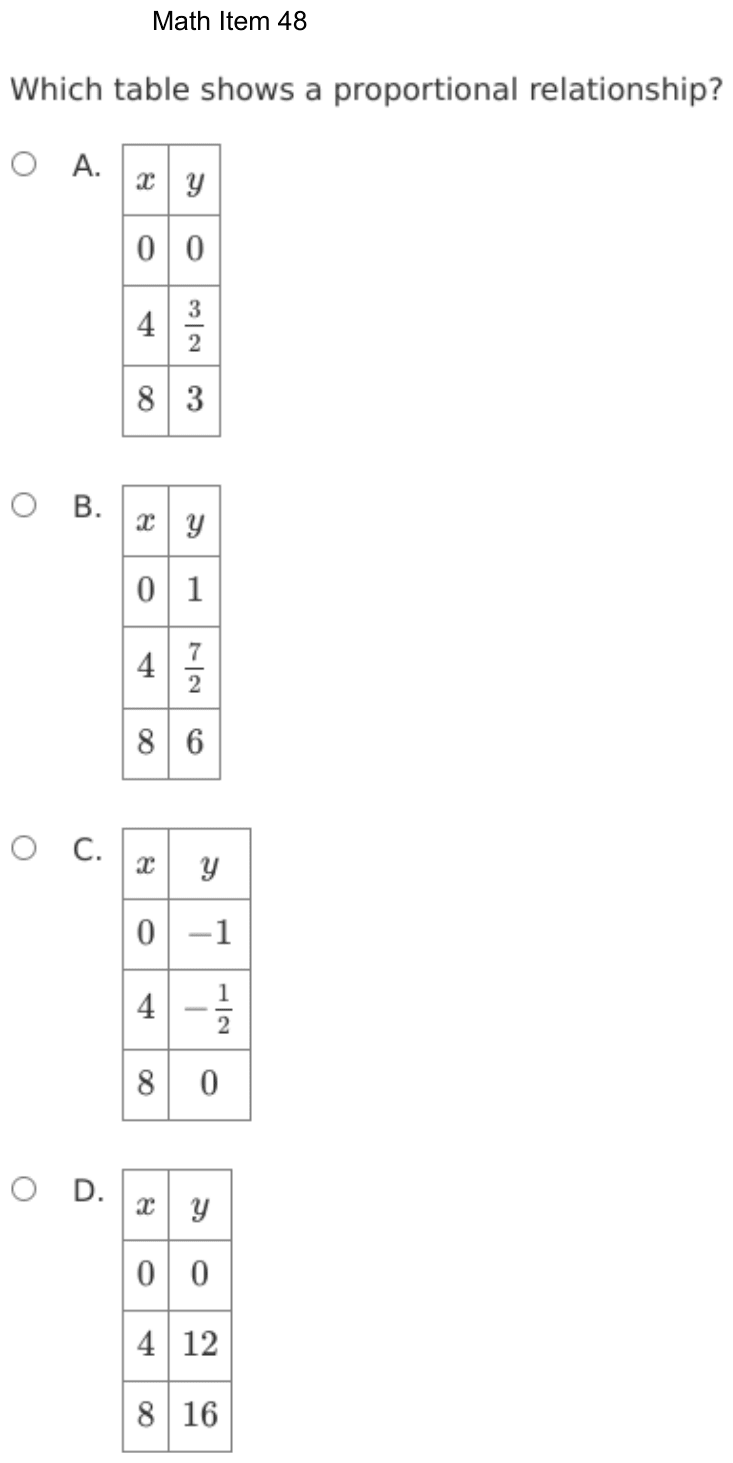
Which table shows a proportional relationship?
- A
x y 0 0 4 8 3 - B
x y 0 1 4 8 6 - C
x y 0 −1 4 8 0 - D
x y 0 0 4 12 8 16
Show the answer
Correct answer: A
The first table is the only one with a constant of proportionality, .
In each ordered pair, .
Question analysis
Four tables each give y for x = 0, 4 and 8, with some values written as fractions or negatives. Students choose the table that shows a proportional relationship. It tests recognizing proportional relationships from a table, which means checking every row against one rule rather than judging by the pattern.
- Grade level
- Grade 7 content, by NYS standard
- Compared with grade 7
- At grade 7 Deciding from a table whether a relationship is proportional is a core grade 7 skill. The fractions and negative values in the tables make each ratio a careful check rather than a glance.
- Estimated difficulty
- Straightforward: two steps or one careful reading.
- Thinking it demands
- Depth of knowledge 2, skills and concepts · mainly apply
- What makes it hard
- Every choice must be checked moderate
- Error-prone arithmetic minor
- Solution
- 2 steps
- Reading level
- Question and choices: about grade 9, 13 words.
- Students, last 30 days
- Not enough answers yet to show (it takes 10).
Why it is hard, traps and wrong answers (shows the answer)
Why it is hard
Two quick tests decide proportionality, and the tables are built so that each test alone lets a wrong table through. The last table starts at (0, 0) like the right one, while the middle two grow by equal steps like the right one. Only checking that y ÷ x is the same in every row with x not 0 separates the one table whose ratio stays at 3/8.
Every choice must be checked moderate Choosing the answer
Each table has to be tested row by row, and two of them start at (0, 0), so the opening row settles nothing; only y ÷ x in the other rows separates them. (Embretson & Wetzel, 1987)
Error-prone arithmetic minor Working it out
The y-values include 3/2, 7/2 and −1/2, so the ratios mean dividing fractions by 4, such as (3/2) ÷ 4 = 3/8, and comparing them with 3 ÷ 8. (Brown & Burton, 1978; Junker & Sijtsma, 2001)
Strategy: For each table, divide y by x in every row where x is not zero, and check that the quotient never changes and that y is 0 when x is 0.
Traps
- Misunderstands the concept: A wrong belief about a concept: that percents can be added, that area grows like length, that averages can be averaged, that a bigger denominator means a bigger fraction.
- Checks only one number: Tries one value in each choice and takes the first that works, when that value happens to work for a wrong choice too; a second value would rule it out.
The wrong answers, classified
B Misunderstands the concept (Smith, diSessa & Roschelle, 1993; De Bock et al., 1998; Ni & Zhou, 2005)
Sees y rise by the same 5/2 each time x rises by 4 and takes the steady change as proportional, missing that y is 1 when x is 0.
C Misreads the figure (Lesh, Post & Behr, 1987; Kirsch & Mosenthal, 1990)
Spots a 0 in the y column and a steady rise of 1/2, but that 0 belongs to x = 8, while at x = 0 the table gives −1.
D Checks only one number (Schoenfeld, 1985)
Checks only the row (0, 0), which every proportional table has, or only 12 ÷ 4 = 3, without testing 16 ÷ 8 = 2 in the last row.
Worked solution, step by step
Formulas used
- Proportional relationship
- y and x are the two amounts in each row. k is the constant of proportionality, the same number in every row. Two tests follow from it. When x is 0, y must be 0. And y ÷ x must equal k in every row where x is not 0.
Sort out the question
Each table gives y for x = 0, 4 and 8. You need the one that shows a proportional relationship. That means y is always the same number times x.
Use two tests. First, y must be 0 when x is 0. Second, y ÷ x must be the same in the other rows.
Test the row where x is 0
Look at the top row of each table:
- Table A: y = 0. It passes.
- Table B: y = 1. It fails.
- Table C: y = −1. It fails.
- Table D: y = 0. It passes.
Watch out: tables B and C go up by equal steps. Steady steps are not enough, because they do not start at 0. Table C does have a 0, but it is next to x = 8.
Test the ratio in table A
Divide y by x. Dividing by 4 is the same as multiplying by :
Both rows give . Table A passes both tests.
Test the ratio in table D
Divide y by x in the same way:
The ratios are different, so table D is not proportional.
Watch out: table D starts at (0, 0) like a proportional table. If you check only that row, or only the row with 4, you will pick choice D.
Give the answer
Only table A starts at (0, 0) and keeps y ÷ x the same.
So the answer is A, the table with y = 0, and 3.
Check your answer
Use the rule for table A, . When x = 4, . When x = 8, . Both match. Doubling x from 4 to 8 also doubles y.
More questions like this
The original DOE question
Question 6 of 35
2026 Practice Test D Math, question 16Question
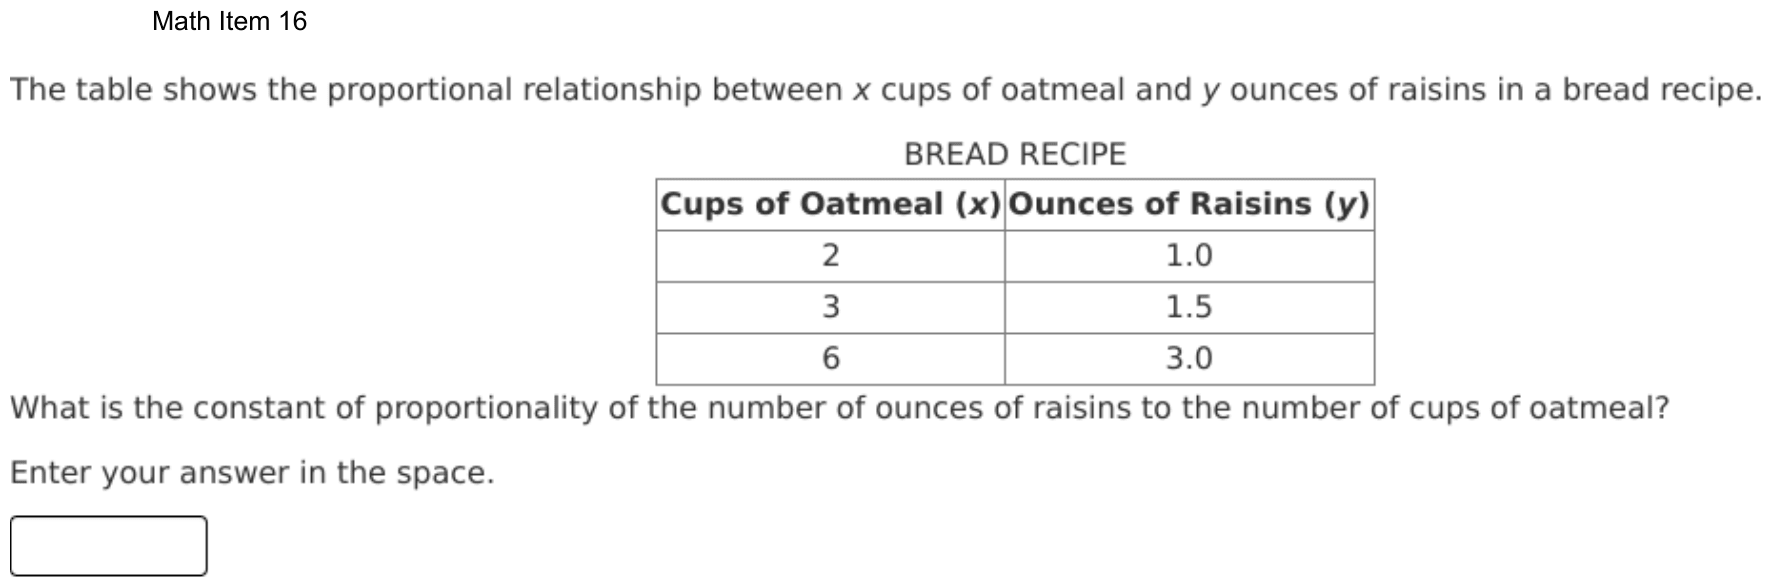
The table shows the proportional relationship between x cups of oatmeal and y ounces of raisins in a bread recipe.
BREAD RECIPE
| Cups of Oatmeal (x) | Ounces of Raisins (y) |
|---|---|
| 2 | 1.0 |
| 3 | 1.5 |
| 6 | 3.0 |
What is the constant of proportionality of the number of ounces of raisins to the number of cups of oatmeal?
Enter your answer in the space.
Fill-in question: work out the answer and type it as a number.
Show the answer
Correct answer: 0.5
To find p, the constant of proportionality of ounces of raisins, y, to cups of oatmeal, x, use the equation .
The table shows that there is 1 ounce of raisins for 2 cups of oatmeal.
The constant of proportionality is 0.5.
Question analysis
A table for a bread recipe lists cups of oatmeal and the ounces of raisins that go with them, in a proportional relationship. Students type the constant of proportionality of raisins to oatmeal. It tests reading a unit rate from a table, and the order in which the question names the two quantities matters.
- NYS standards
- 7.RP.2b constant of proportionality
- Grade level
- Grade 7 content, by NYS standard
- Compared with grade 7
- Below grade 7 Finding a constant of proportionality from a table is a grade 7 standard, and here a single division in one row gives it. The demand is lighter than typical grade 7 work; the order of the ratio in the wording needs the most care.
- Estimated difficulty
- Straightforward: two steps or one careful reading.
- Thinking it demands
- Depth of knowledge 1, recall and reproduction · mainly apply
- What makes it hard
- Turning words into math moderate
- An answer in an unexpected form minor
- Solution
- 1 step
- Reading level
- Question and choices: about grade 6, 56 words.
- Students, last 30 days
- Not enough answers yet to show (it takes 10).
Why it is hard, traps and wrong answers (shows the answer)
Why it is hard
Every row gives the same ratio, so the division itself is easy; the question tests which quantity goes on top. Because oatmeal comes first in the table and its numbers are the larger ones, dividing cups by ounces feels natural and produces a clean whole number. Writing the relationship as y = kx, raisins equal k times oatmeal, and checking it on a second row such as 3 cups and 1.5 ounces fixes the order.
Turning words into math moderate Understanding the question
The phrase “of the number of ounces of raisins to the number of cups of oatmeal” fixes the order y ÷ x, while the table lists oatmeal first, inviting 2 ÷ 1.0. (Hegarty, Mayer & Monk, 1995; Koedinger & Nathan, 2004)
An answer in an unexpected form minor Choosing the answer
The constant is typed in with no choices, so an upside-down ratio of 2, a whole number, looks as finished as the decimal the table actually gives. (Enright, Morley & Sheehan, 2002)
Strategy: Divide an ounces-of-raisins value by the cups of oatmeal in the same row, in the order the question names them, and check that every row gives the same value.
Traps
- Wrong operation: Adds instead of multiplying, divides the wrong way round, turns a ratio or rate upside down, or undoes a step in the wrong direction (subtracts what should be added back).
- Numbers taken from the question: Combines the numbers in the question without a model of the situation, or is simply a number that appears in the question.
The wrong answers, classified
2 Wrong operation (Hegarty, Mayer & Monk, 1995; King et al., 2004)
Divides cups of oatmeal by ounces of raisins, 2 ÷ 1.0, turning the ratio upside down: cups per ounce instead of ounces per cup.
1 Numbers taken from the question (Hegarty, Mayer & Monk, 1995)
Reads the first raisin amount, 1.0 ounce, as the constant without dividing it by the 2 cups of oatmeal in the same row.
Worked solution, step by step
Formulas used
- Constant of proportionality
- x and y are two amounts that grow together at the same rate. k is the constant of proportionality, the number you always multiply x by to get y. Here y is ounces of raisins and x is cups of oatmeal, so k is ounces of raisins per cup of oatmeal.
Sort out the question
The table shows cups of oatmeal, x, and ounces of raisins, y. Proportional means the raisins are always the same multiple of the oatmeal. That multiple is the constant of proportionality. The question asks for raisins to oatmeal. So you want ounces of raisins for each cup of oatmeal: y ÷ x.
Divide y by x in one row
Use the first row of the table: 2 cups of oatmeal go with 1.0 ounce of raisins.
So there is 0.5 ounce of raisins for each cup of oatmeal.
Check the other rows
A constant must be the same in every row:
Every row gives 0.5, so the rule is .
Watch out: the table lists oatmeal first, which tempts you to divide 2 by 1.0. That gives 2, which is cups per ounce, the ratio upside down. And 1.0 alone is just one raisin amount, not the constant.
Enter the answer
Type the constant in the box as a number, with no units. On this site, 0.5, .5 and 1/2 all count.
So you would enter 0.5.
Check your answer
Multiply each oatmeal amount by 0.5: 2 × 0.5 = 1.0, 3 × 0.5 = 1.5 and 6 × 0.5 = 3.0. Each result matches the raisins in its row. Also, every raisin number is smaller than its oatmeal number, so the constant must be less than 1.
More questions like this
The original DOE question
Question 7 of 35
2026 Practice Test D Math, question 36Question
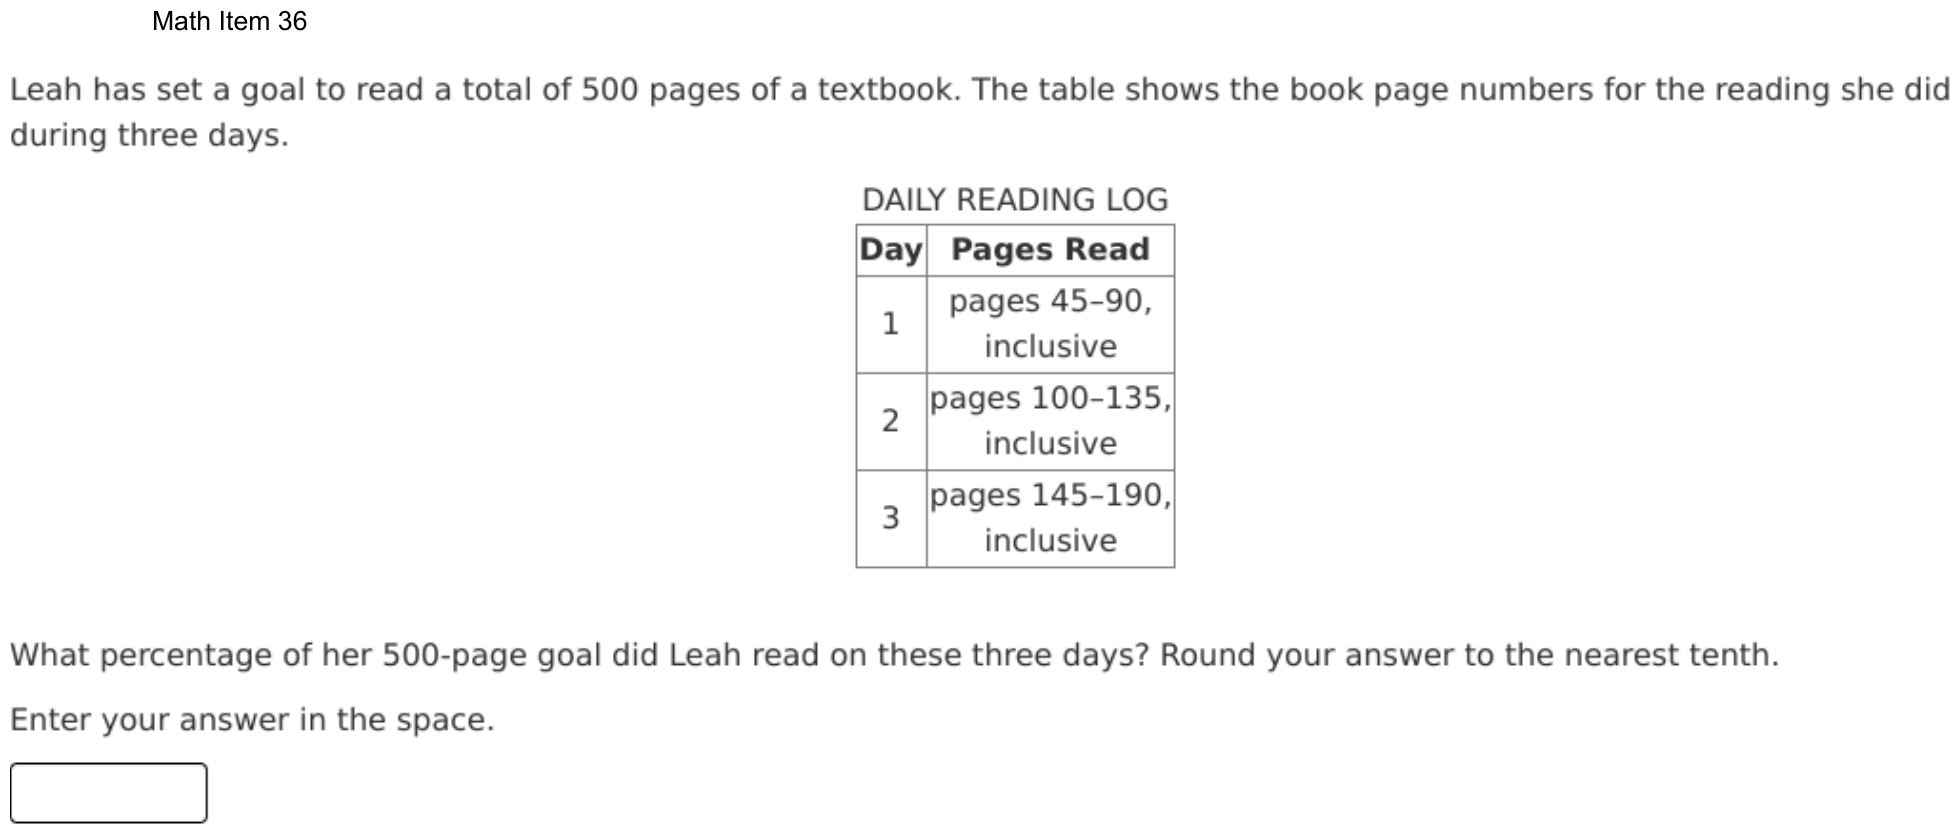
Leah has set a goal to read a total of 500 pages of a textbook. The table shows the book page numbers for the reading she did during three days.
DAILY READING LOG
| Day | Pages Read |
|---|---|
| 1 | pages 45–90, inclusive |
| 2 | pages 100–135, inclusive |
| 3 | pages 145–190, inclusive |
What percentage of her 500-page goal did Leah read on these three days? Round your answer to the nearest tenth.
Enter your answer in the space.
Fill-in question: work out the answer and type it as a number.
Show the answer
Correct answer: 25.6%
First, determine the number of pages read each day. Since the pages per assignment are inclusive, subtract the first page from the last page assigned and then add 1 to determine the pages read for each day.
Day 1: pages
Day 2: pages
Day 3: pages
Leah read a total of 128 pages, since .
To determine the percent, express 128 pages out of 500 pages as a fraction.
Question analysis
Leah's daily reading log lists three ranges of textbook pages, each marked inclusive, and her goal is 500 pages. This percent question asks what percentage of the goal she read over the three days, rounded to the nearest tenth and typed in. Counting the pages in each inclusive range correctly is the tricky step before the percent.
- Grade level
- Grade 7 content, by NYS standard
- Compared with grade 7
- Above grade 7 Finding what percent one number is of another is grade 6 and 7 work. This adds three inclusive page ranges to count, which takes more care than subtracting, then a rounding step, all typed with no choices to check against.
- Estimated difficulty
- Hard: combines ideas, needs a plan, and has more than one tempting wrong answer.
- Thinking it demands
- Depth of knowledge 2, skills and concepts · mainly apply
- What makes it hard
- Something you must already know moderate
- Many steps moderate
- An answer in an unexpected form minor
- Solution
- 4 steps
- Reading level
- Question and choices: about grade 3, 66 words.
- Students, last 30 days
- Not enough answers yet to show (it takes 10).
Why it is hard, traps and wrong answers (shows the answer)
Why it is hard
Counting pages in a range is the whole difficulty; the percent at the end is routine once the total is right. Subtracting first from last feels natural, and here it even rewards the student with a round 25%, so nothing looks wrong. Checking the rule on a tiny range, pages 1 to 3, which is 3 pages and not 2, fixes the count, and the instruction to round to the nearest tenth hints that the answer is not a whole number.
Something you must already know moderate Working it out
Every row says inclusive, but nothing says that pages 45 to 90 hold 90 − 45 + 1 = 46 pages; subtracting alone loses one page on each of the three days. (Anderson & Krathwohl, 2001)
Many steps moderate Working it out
Three page counts, a sum, a division by 500 and a change to a percent come in sequence, and a one-page error in each count carries through to the end. (Daniel & Embretson, 2010; Enright, Morley & Sheehan, 2002)
An answer in an unexpected form minor Choosing the answer
The answer is typed with no choices, and the miscounted total, 125 pages, gives a tidy 25% that looks more finished than the right value with its tenth. (Enright, Morley & Sheehan, 2002)
Strategy: Count each day's pages carefully, testing your method on a short range such as pages 1–3, add the three days, divide by 500, and write the result as a percent to the nearest tenth.
Traps
- Counting the ends: Inclusive or exclusive ends, fence posts, consecutive numbers: an answer that is one too many or too few, or an endpoint drawn open where it belongs closed (or the reverse).
- Stops one step early: A choice is a number from partway through the solution.
- Misreads the question: Misses or misreads a condition or a word in the question: "at least", "each", "remaining", "not".
The wrong answers, classified
25 Counting the ends (Brown & Burton, 1978)
Subtracts the first page from the last for each day, 45 + 35 + 45 = 125 pages, forgetting that an inclusive range counts both end pages, so 125 ÷ 500 = 25%.
0.256 Stops one step early (King et al., 2004; Gierl et al., 2017)
Counts the 128 pages and divides by 500 correctly, then enters the decimal 0.256, one step short of multiplying by 100 to make a percent.
26 Misreads the question (Hegarty, Mayer & Monk, 1995)
Finds 25.6% correctly but rounds it to the nearest whole percent, overlooking the instruction to round to the nearest tenth.
Worked solution, step by step
Formulas used
- Counting pages in an inclusive range
- Inclusive means the first and last pages are both read. Subtracting counts the steps from the first page to the last. That misses one page, so add 1. Test it: pages 1 to 3 are 3 pages, and 3 − 1 + 1 = 3.
- Percent of a total
- The part is the amount you have, here the pages read. The whole is the amount you compare with, here the 500-page goal. Dividing gives a decimal. Multiplying by 100 turns it into a percent, a number out of 100.
Sort out the question
Leah’s goal is 500 pages. The log shows three days:
- Day 1: pages 45 to 90
- Day 2: pages 100 to 135
- Day 3: pages 145 to 190
Each range is inclusive. You need the percent of 500 pages she read, rounded to the nearest tenth.
Count the pages each day
Use the rule for an inclusive range: last page minus first page, plus 1.
Watch out: subtracting alone gives 45, 35 and 45 pages. That is 125 pages, which is exactly 25%. A round answer like that can hide the mistake.
Add the three days
Add the pages from all three days to get her total:
Leah read 128 pages in all. This is the part you compare with the goal.
Change to a percent
Divide the pages read by the goal, then multiply by 100:
Leah read 25.6% of her goal. That already ends in tenths, so no rounding is needed.
Watch out: 0.256 is a decimal, not a percent. And 26 rounds to a whole number, not to the nearest tenth.
Enter the answer
The box has no % sign, but the question asks for a percentage, so the number in the box is the percent. Type it with its decimal point. Typing 25.6% also counts on this site. So you would enter 25.6.
Check your answer
Estimate. 10% of 500 pages is 50 pages. 128 pages is a bit more than 2 × 50 = 100, so the answer is between 20% and 30%. Then check exactly: pages. It matches.
More questions like this
The original DOE question
Question 8 of 35
2026 Practice Test D Math, question 39Question
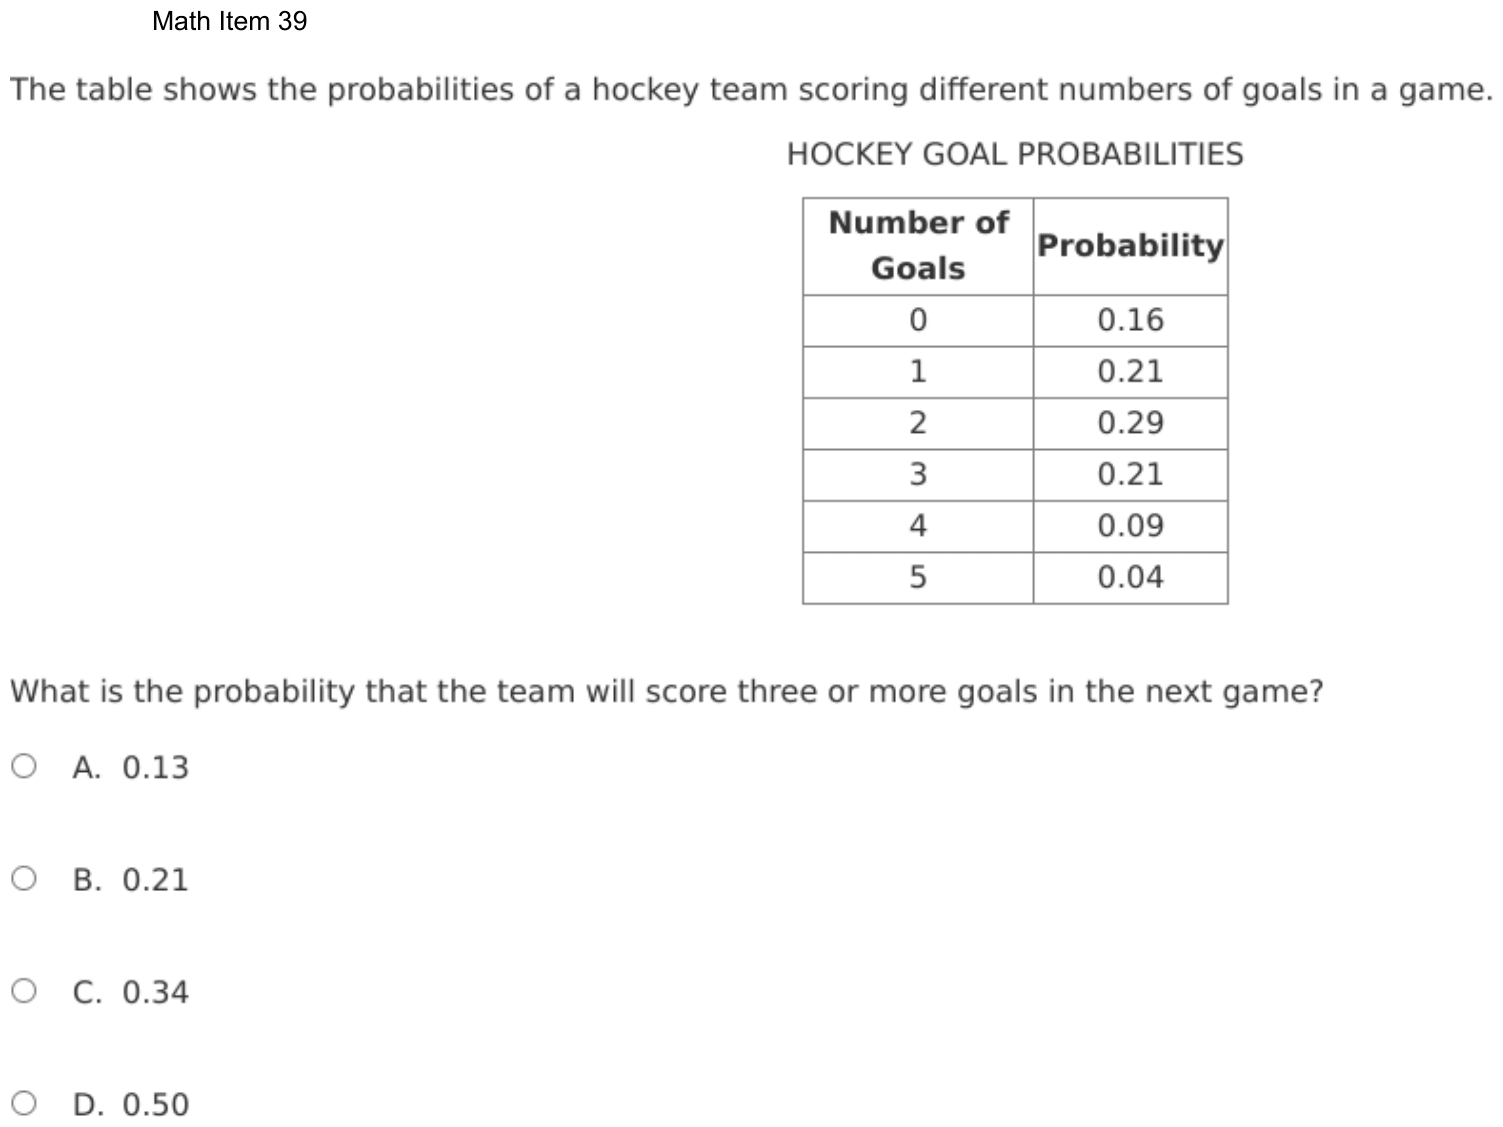
The table shows the probabilities of a hockey team scoring different numbers of goals in a game.
HOCKEY GOAL PROBABILITIES
| Number of Goals | Probability |
|---|---|
| 0 | 0.16 |
| 1 | 0.21 |
| 2 | 0.29 |
| 3 | 0.21 |
| 4 | 0.09 |
| 5 | 0.04 |
What is the probability that the team will score three or more goals in the next game?
- A0.13
- B0.21
- C0.34
- D0.50
Show the answer
Correct answer: C
To find the probability that any one of several mutually exclusive events occurs, use the addition rule, and add the probabilities of each event:
Using the data in the table, the probability that the team will score 3 or more goals in the next game is represented by
Question analysis
A table gives the probabilities of a hockey team scoring 0 to 5 goals in a game, and students find the chance that it scores three or more goals in the next one. This probability question tests adding the probabilities of separate outcomes. Reading exactly which rows the phrase covers is the main point of care.
- Grade level
- Grade 6 content, by NYS standard
- Compared with grade 7
- Below grade 7 Finding the probability of an event from a given probability model is grade 6 work in New York. Here the model is a table, and the task is choosing the right rows and adding decimals, shorter than typical grade 7 work.
- Estimated difficulty
- Routine: one familiar step, little to misread.
- Thinking it demands
- Depth of knowledge 1, recall and reproduction · mainly apply
- What makes it hard
- Solution
- 2 steps
- Reading level
- Question and choices: about grade 8, 40 words.
- Students, last 30 days
- Not enough answers yet to show (it takes 10).
Why it is hard, traps and wrong answers (shows the answer)
Why it is hard
Adding three decimals is easy, so the question turns on which rows the words cover. Including the 3-goal row, and not stopping at it, are the two decisions, and each misreading gives a listed choice. Checking the complement, 1 − (0.16 + 0.21 + 0.29), confirms both the sum and the choice of rows.
Turning words into math minor Understanding the question
The phrase “three or more goals” has to become the three rows for 3, 4 and 5 goals, starting at the 3-goal row itself. (Hegarty, Mayer & Monk, 1995; Koedinger & Nathan, 2004)
Reading a figure, table or graph minor Understanding the question
The table lists six probabilities, two of them both 0.21, so the rows for 3, 4 and 5 goals must be picked out by their goal counts, not by their values. (Lesh, Post & Behr, 1987; Kirsch & Mosenthal, 1990)
Strategy: Decide which rows the words "three or more" cover, add their probabilities, and check by subtracting the total of the other rows from 1.
Traps
- Counting the ends: Inclusive or exclusive ends, fence posts, consecutive numbers: an answer that is one too many or too few, or an endpoint drawn open where it belongs closed (or the reverse).
- Misreads the question: Misses or misreads a condition or a word in the question: "at least", "each", "remaining", "not".
- Misunderstands the concept: A wrong belief about a concept: that percents can be added, that area grows like length, that averages can be averaged, that a bigger denominator means a bigger fraction.
The wrong answers, classified
A Counting the ends (Brown & Burton, 1978)
Adds only the rows for 4 and 5 goals, 0.09 + 0.04 = 0.13, reading three or more as more than three and leaving out the end row.
B Misreads the question (Hegarty, Mayer & Monk, 1995)
Reads only the row for exactly 3 goals, 0.21, overlooking the words “or more” and the two rows below it.
D Misunderstands the concept (Smith, diSessa & Roschelle, 1993; De Bock et al., 1998; Ni & Zhou, 2005)
Counts 3 of the 6 rows, for 3, 4 and 5 goals, as half the outcomes, ignoring that the table gives them different probabilities.
Worked solution, step by step
Formulas used
- Adding probabilities
- A and B are two events that cannot both happen at once, like scoring exactly 3 goals and exactly 4 goals. The chance that one or the other happens is the sum of their chances.
- The chance it does not happen
- The chances of all possible outcomes add up to 1. So the chance an event does not happen is 1 minus the chance it does. Use it to check an answer from the other side.
Sort out the question
The table gives the chance of each number of goals, from 0 to 5. You need the chance the team scores three or more goals in the next game.
Pick the right rows
Three or more means 3 goals, 4 goals or 5 goals. The row for 3 counts too. Read those three rows:
- 3 goals: 0.21
- 4 goals: 0.09
- 5 goals: 0.04
Watch out: leaving out the 3-goal row gives 0.09 + 0.04 = 0.13, choice A. Using only the 3-goal row gives 0.21, choice B.
Add the chances
A game can end with only one number of goals. So add the three chances:
Watch out: three of the six rows is half the rows, but that does not make the chance 0.50, choice D. The rows have different chances.
So the answer is C, 0.34.
Check your answer
Find the chance of fewer than 3 goals, the other rows: . Then the chance of 3 or more is . Both ways give 0.34.
More questions like this
The original DOE question
Question 9 of 35
2026 Practice Test D Math, question 46Question
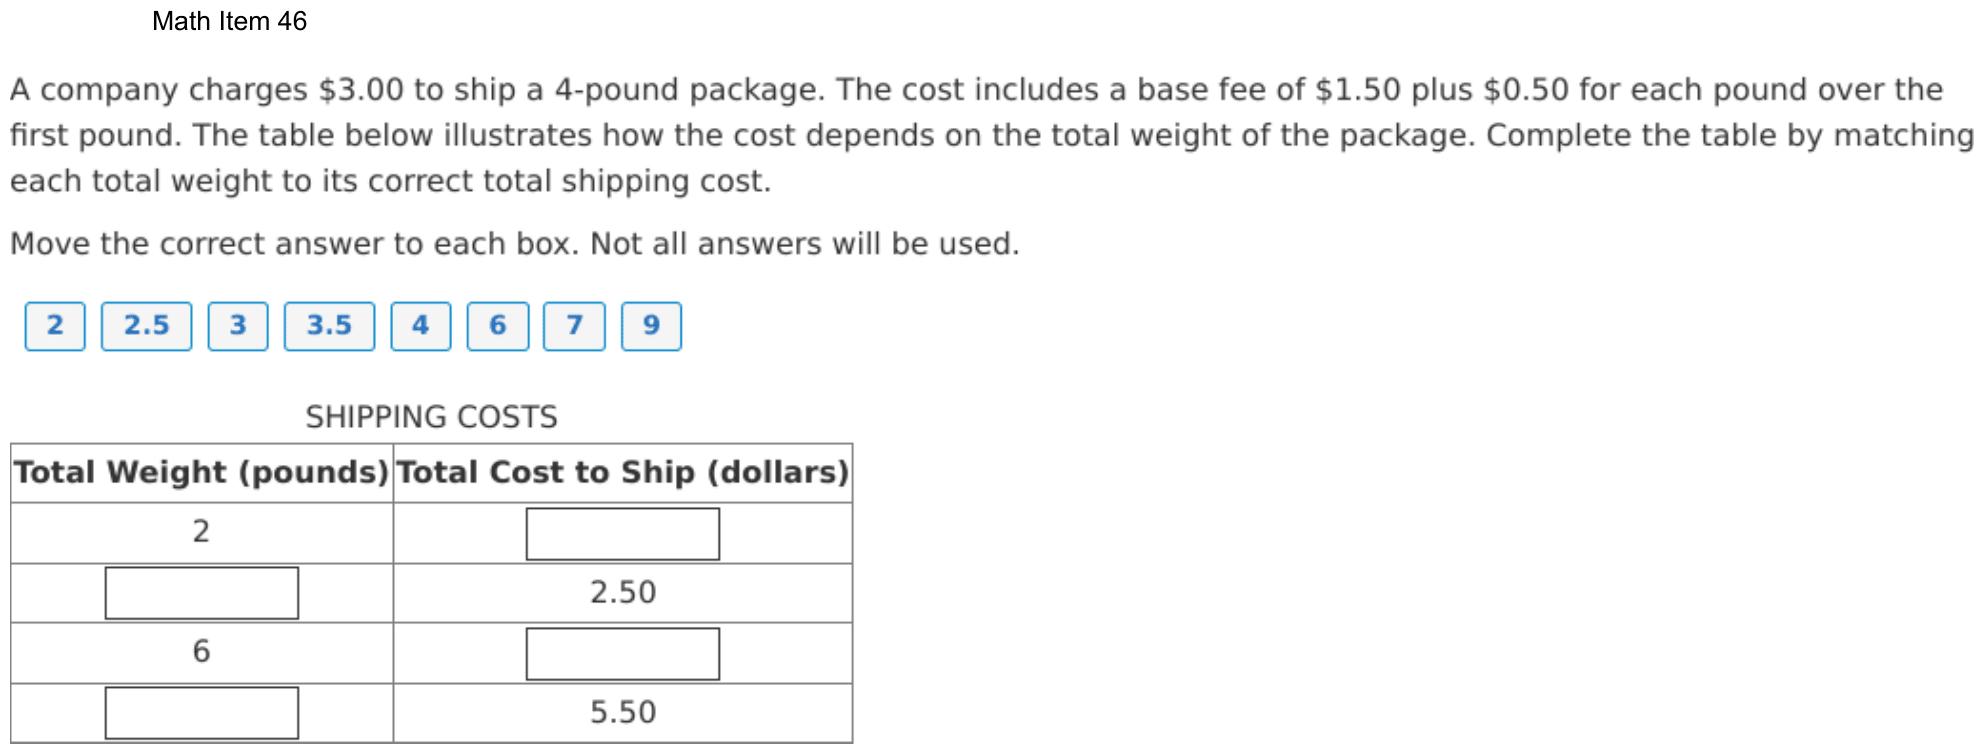
A company charges $3.00 to ship a 4-pound package. The cost includes a base fee of $1.50 plus $0.50 for each pound over the first pound. The table below illustrates how the cost depends on the total weight of the package. Complete the table by matching each total weight to its correct total shipping cost.
Move the correct answer to each box. Not all answers will be used.
SHIPPING COSTS
| Total Weight (pounds) | Total Cost to Ship (dollars) |
|---|---|
| 2 | |
| 2.50 | |
| 6 | |
| 5.50 |
On the test you drag tiles into the boxes; here, choose each box’s tile from its menu. Each tile can be used once. The DOE has not published how answers with several parts are scored; this site counts one right only when every part is right.
Show the answer
Correct answer: blank 1: 2; blank 2: 3; blank 3: 4; blank 4: 9
| Total Weight (pounds) | Total Cost to Ship (dollars) |
|---|---|
| 2 | 2 |
| 3 | 2.50 |
| 6 | 4 |
| 9 | 5.50 |
Let x represent the weight of the package in pounds. The first pound is included in the base fee of $1.50, so represents the number of pounds that cost $0.50 each.
The cost equation can be written as
- The cost for a 2-pound package is
- The cost for a 6-pound package is
-
The weight of a package that costs $2.50 to ship can be found by solving
-
The weight of a package that costs $5.50 to ship can be found by solving
To check:
Given that the total cost is $3.00 for the initial package
pounds fits the linear pattern of the table
Question analysis
A shipping company charges a base fee plus 50 cents for each pound over the first, and a 4-pound package costs $3.00. Students drag number tiles into a table to complete two costs and two weights, with some tiles left unused. It tests building and using a linear rule, and the wording about the first pound must be applied in every row.
- Grade level
- Grade 7 content, by NYS standard
- Compared with grade 7
- At grade 7 Grade 7 students solve word problems with equations like p(x + q) = r. This table needs that rule four times, twice run backward from a cost to a weight, and the phrase about the first pound must be applied every time.
- Estimated difficulty
- Moderate: several steps, or a close reading with one strong distractor.
- Thinking it demands
- Depth of knowledge 2, skills and concepts · mainly apply
- What makes it hard
- Turning words into math moderate
- Many steps minor
- Solution
- 4 steps
- Reading level
- Question and choices: about grade 4, 75 words.
- Students, last 30 days
- Not enough answers yet to show (it takes 10).
Why it is hard, traps and wrong answers (shows the answer)
Why it is hard
The rule is stated in words and confirmed by the 4-pound example, so the work is applying it consistently in both directions. Charging every pound breaks the $3.00 example at once, since 4 pounds would cost $3.50, and models that ignore the wording leave costs or weights with no matching tile. A shortcut helps: each extra pound adds $0.50 to the $3.00, so the table can be filled by counting up or down from 4 pounds.
Turning words into math moderate Understanding the question
The phrase “$0.50 for each pound over the first pound” means the first pound is covered by the $1.50 fee, so a package of x pounds pays for only x − 1 of them. (Hegarty, Mayer & Monk, 1995; Koedinger & Nathan, 2004)
Many steps minor Working it out
Four boxes must all be right, two found forward from a weight and two backward from a cost, and the backward rows need the first pound added back. (Daniel & Embretson, 2010; Enright, Morley & Sheehan, 2002)
Strategy: Write the rule as the base fee plus $0.50 times the pounds after the first, check it against the 4-pound example, then use it forward for the costs and backward for the weights.
Traps
- Misreads the question: Misses or misreads a condition or a word in the question: "at least", "each", "remaining", "not".
- Misunderstands the concept: A wrong belief about a concept: that percents can be added, that area grows like length, that averages can be averaged, that a bigger denominator means a bigger fraction.
- Stops one step early: A choice is a number from partway through the solution.
The wrong answers, classified
BAEH Misreads the question (Hegarty, Mayer & Monk, 1995)
Charges $0.50 for every pound, first included, so 2 pounds cost $2.50 and $2.50 ships 2 pounds; no tile fits its $4.50 or 8, so it settles for 4 and 9.
ACFH Misunderstands the concept (Smith, diSessa & Roschelle, 1993; De Bock et al., 1998; Ni & Zhou, 2005)
Triples the 2-pound cost for the 6-pound package, $2 × 3 = $6, treating the cost as proportional to weight though the base fee is paid only once.
ACBH Stops one step early (King et al., 2004; Gierl et al., 2017)
Charges $0.50 for each of the 5 pounds over the first for the 6-pound package but stops there, leaving out the $1.50 base fee and entering 2.5.
Worked solution, step by step
Formulas used
- Shipping cost
- C is the total cost in dollars, and w is the weight in pounds. The $1.50 base fee is paid once, and it covers the first pound. Each pound after the first costs $0.50. There are w − 1 of those pounds.
Sort out the question
The base fee of $1.50 covers the first pound. Each pound over the first adds $0.50. A 4-pound package costs $3.00.
You fill four boxes: the costs for 2 and 6 pounds, and the weights that cost $2.50 and $5.50. Each tile is used once at most, and four tiles are not used.
Test the rule on 4 pounds
Check the rule with the example. A 4-pound package has 3 pounds over the first:
That is $3.00, so the rule fits.
Watch out: charging $0.50 for every pound, the first one too, gives $3.50 for 4 pounds. That does not match.
Find the two costs
For 2 pounds, 1 pound is over the first:
For 6 pounds, 5 pounds are over the first:
The costs are the tiles 2 and 4.
Watch out: 6 pounds is 3 times 2 pounds, but the cost is not 3 times $2. The base fee is paid once. Tripling gives the tile 6. Leaving out the base fee gives the tile 2.5.
Work back to the two weights
For $2.50, take off the base fee: . At $0.50 a pound, $1.00 pays for 2 extra pounds. Add the first pound: pounds.
For $5.50: . $4.00 pays for 8 extra pounds. Add the first pound: pounds.
Watch out: forgetting to add back the first pound gives 2 and 8.
Fill in the four boxes
From top to bottom, the boxes get 2, 3, 4 and 9. The tiles 2.5, 3.5, 6 and 7 are not used. On the test, you drag each tile into its box. On this site, you choose it from the box’s menu.
Check your answer
Each extra pound adds $0.50, so count from 4 pounds at $3.00. Going down: 3 pounds cost $2.50 and 2 pounds cost $2.00. Going up: 5 pounds $3.50, 6 pounds $4.00, 7 pounds $4.50, 8 pounds $5.00 and 9 pounds $5.50. All four boxes match.
More questions like this
The original DOE question
Question 10 of 35
2026 Practice Test D Math, question 50Question
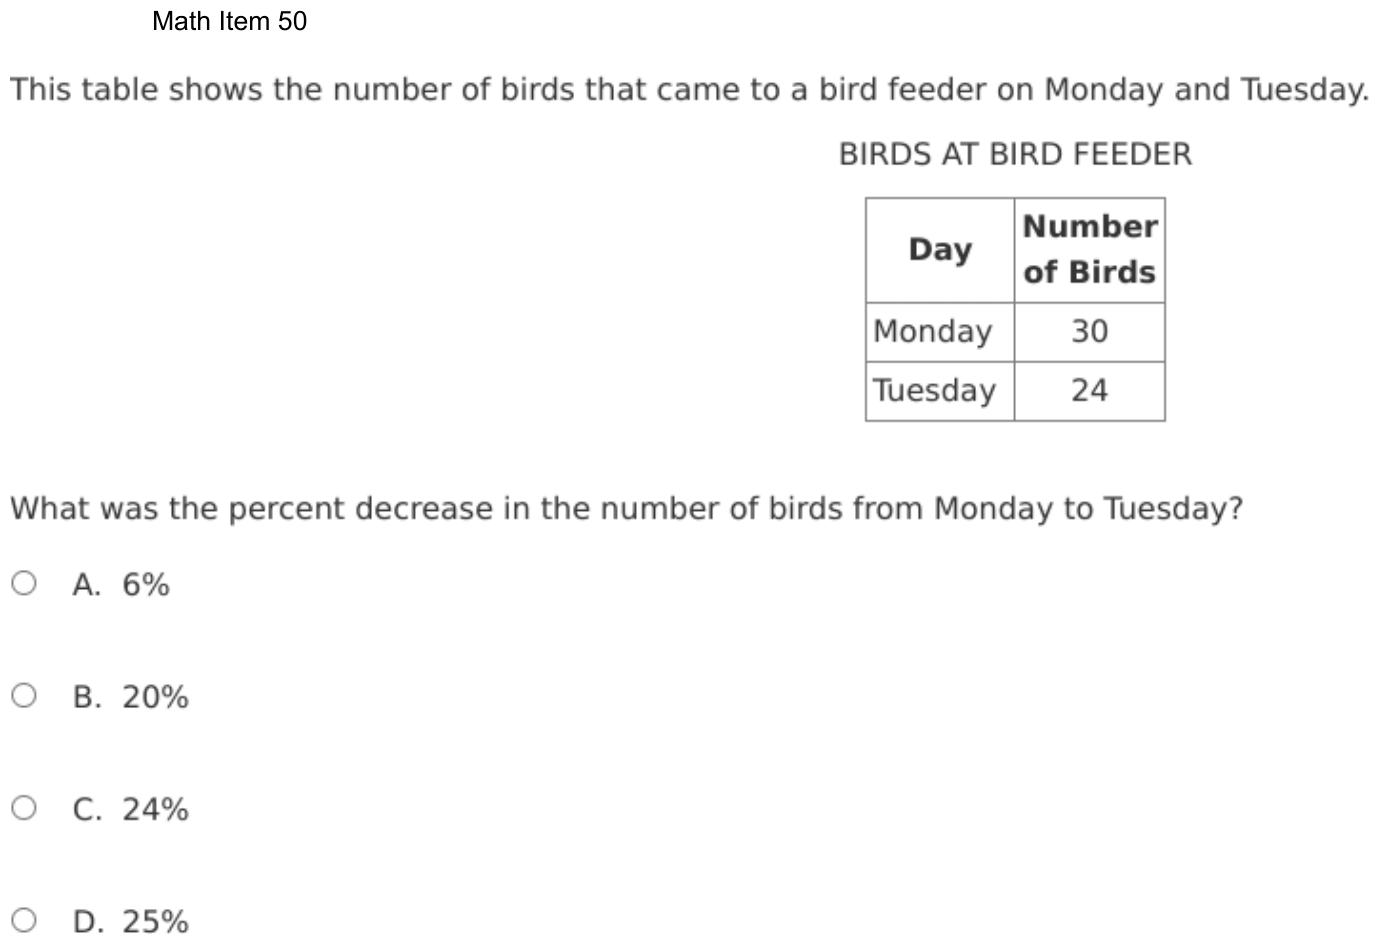
This table shows the number of birds that came to a bird feeder on Monday and Tuesday.
BIRDS AT BIRD FEEDER
| Day | Number of Birds |
|---|---|
| Monday | 30 |
| Tuesday | 24 |
What was the percent decrease in the number of birds from Monday to Tuesday?
- A6%
- B20%
- C24%
- D25%
Show the answer
Correct answer: B
To determine the percent decrease from Monday to Tuesday, first calculate the decrease in the number of birds at the feeder.
The difference in the number of birds at the feeder divided by the number of birds on Monday will yield the percent decrease from Monday to Tuesday.
0.20 represents 20%.
There was a 20% decrease from Monday to Tuesday.
Question analysis
A table shows that 30 birds came to a bird feeder on Monday and 24 on Tuesday. This percent change question asks for the percent decrease from Monday to Tuesday. Students find the change and compare it with one day's count, and choosing the right day as the base decides the result.
- NYS standards
- 7.RP.3 multistep ratio and percent problems
- Grade level
- Grade 7 content, by NYS standard
- Compared with grade 7
- At grade 7 Percent decrease is core grade 7 work, and this is a plain example: one subtraction and one division with friendly numbers. The only real demand is measuring the change against the right day's count.
- Estimated difficulty
- Straightforward: two steps or one careful reading.
- Thinking it demands
- Depth of knowledge 2, skills and concepts · mainly apply
- What makes it hard
- Solution
- 2 steps
- Reading level
- Question and choices: about grade 3, 40 words.
- Students, last 30 days
- Not enough answers yet to show (it takes 10).
Why it is hard, traps and wrong answers (shows the answer)
Why it is hard
The subtraction is trivial, so the question is about the base. Both counts sit in the table, and dividing by the later one gives an equally neat percent that is easy to accept. Saying “a decrease from Monday” and putting Monday’s 30 under the change avoids it, and checking that 20% of 30 is 6 confirms the result.
A very close wrong answer minor Choosing the answer
Dividing the drop of 6 by Monday’s 30 gives 20% and by Tuesday’s 24 gives 25%, two round, listed percents only 5 points apart, so only the choice of base separates them. (Embretson & Wetzel, 1987; Gorin & Embretson, 2006; Ascalon et al., 2007)
Something you must already know minor Working it out
Students must know that a percent decrease is the change divided by the starting amount, here Monday’s count, a rule the question does not state. (Anderson & Krathwohl, 2001)
Strategy: Subtract to find how many fewer birds came on Tuesday, divide by Monday's count, the starting amount, and change the fraction to a percent.
Traps
- Percent of the wrong amount: Finding the whole from a part, or a percent change measured from the wrong starting amount.
- Misunderstands the concept: A wrong belief about a concept: that percents can be added, that area grows like length, that averages can be averaged, that a bigger denominator means a bigger fraction.
- Numbers taken from the question: Combines the numbers in the question without a model of the situation, or is simply a number that appears in the question.
The wrong answers, classified
A Misunderstands the concept (Smith, diSessa & Roschelle, 1993; De Bock et al., 1998; Ni & Zhou, 2005)
Finds the decrease of 6 birds and reads it as 6 percent, as if the count had dropped from 100 rather than from 30.
C Numbers taken from the question (Hegarty, Mayer & Monk, 1995)
Reads Tuesday’s 24 birds as a percent, taking a number straight from the table without working out the change at all.
D Percent of the wrong amount (Parker & Leinhardt, 1995)
Divides the decrease of 6 by Tuesday’s 24 birds instead of Monday’s 30, measuring the change from the later day: 6/24 = 25%.
Worked solution, step by step
Formulas used
- Percent decrease
- Old is the starting amount, here Monday’s count. New is the later amount, Tuesday’s count. The top is how much it dropped. You divide by the starting amount because a change is measured from where you started.
Sort out the question
The table shows 30 birds on Monday and 24 birds on Tuesday. You need the percent decrease from Monday to Tuesday. From Monday means Monday is the starting amount.
Find the drop
Subtract Tuesday’s count from Monday’s:
There were 6 fewer birds.
Watch out: 6 is a number of birds, not a percent. Calling it 6% leads to choice A.
Compare the drop with Monday
Use the formula. Divide the drop by Monday’s count, then multiply by 100:
The number of birds went down by 20%.
Watch out: dividing by Tuesday’s 24 gives , or 25%, choice D. Measure the change from the starting day. Choice C, 24%, just copies a number from the table.
So the answer is B, 20%.
Check your answer
Take 20% of Monday’s count: . Then , which is Tuesday’s count. The answer checks out.
More questions like this
The original DOE question
Question 11 of 35
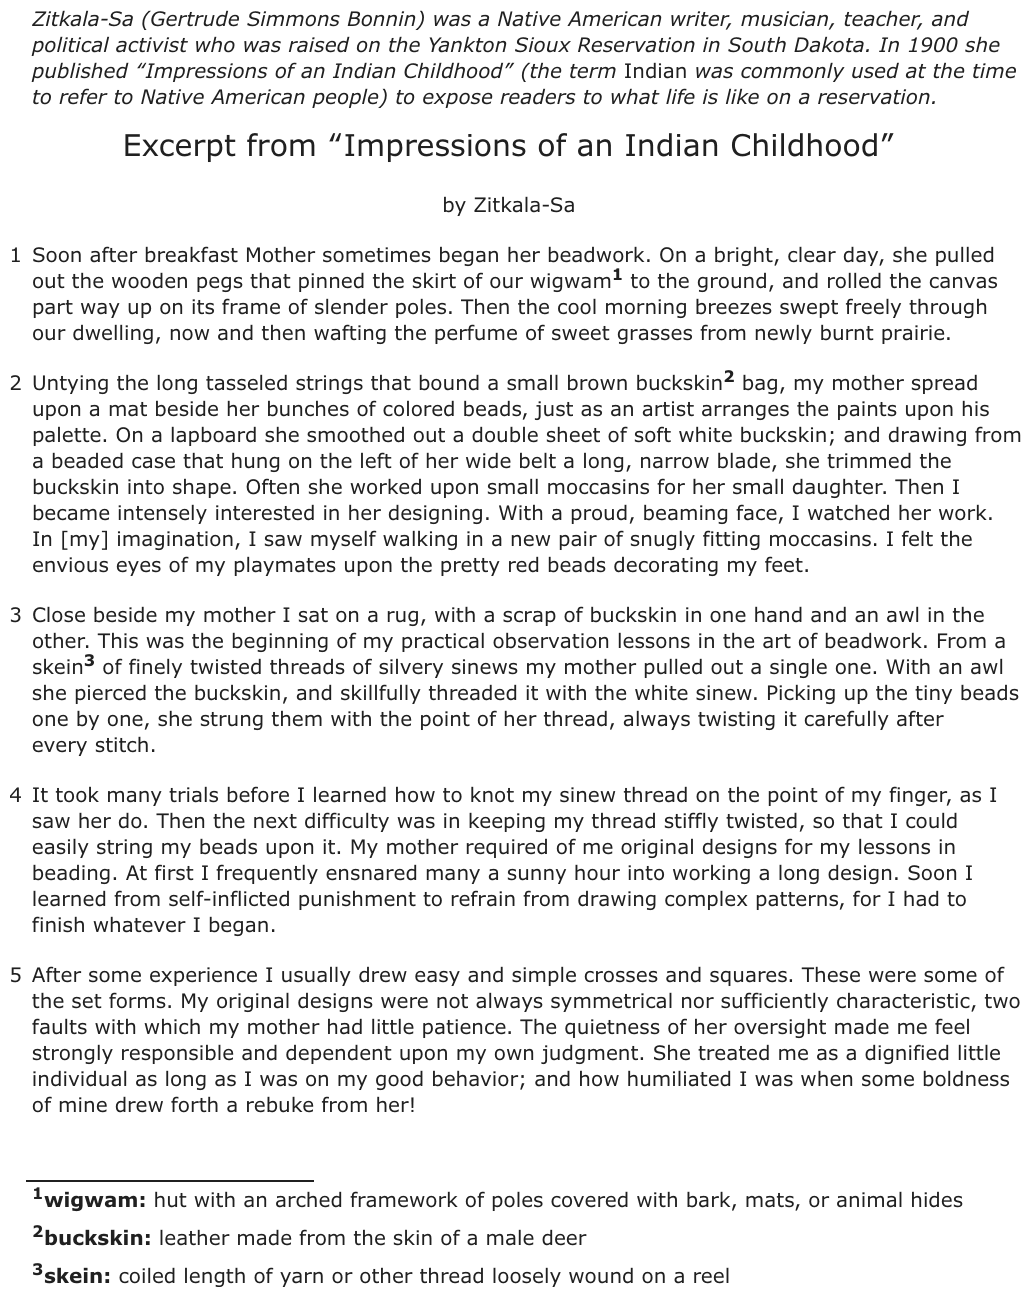
2024 Test A English, question 18Passage Excerpt from “Impressions of an Indian Childhood”
Excerpt from “Impressions of an Indian Childhood”
by Zitkala-Sa
Zitkala-Sa (Gertrude Simmons Bonnin) was a Native American writer, musician, teacher, and political activist who was raised on the Yankton Sioux Reservation in South Dakota. In 1900 she published “Impressions of an Indian Childhood” (the term Indian was commonly used at the time to refer to Native American people) to expose readers to what life is like on a reservation.
Soon after breakfast Mother sometimes began her beadwork. On a bright, clear day, she pulled out the wooden pegs that pinned the skirt of our wigwam1 to the ground, and rolled the canvas part way up on its frame of slender poles. Then the cool morning breezes swept freely through our dwelling, now and then wafting the perfume of sweet grasses from newly burnt prairie.
Untying the long tasseled strings that bound a small brown buckskin2 bag, my mother spread upon a mat beside her bunches of colored beads, just as an artist arranges the paints upon his palette. On a lapboard she smoothed out a double sheet of soft white buckskin; and drawing from a beaded case that hung on the left of her wide belt a long, narrow blade, she trimmed the buckskin into shape. Often she worked upon small moccasins for her small daughter. Then I became intensely interested in her designing. With a proud, beaming face, I watched her work. In [my] imagination, I saw myself walking in a new pair of snugly fitting moccasins. I felt the envious eyes of my playmates upon the pretty red beads decorating my feet.
Close beside my mother I sat on a rug, with a scrap of buckskin in one hand and an awl in the other. This was the beginning of my practical observation lessons in the art of beadwork. From a skein3 of finely twisted threads of silvery sinews my mother pulled out a single one. With an awl she pierced the buckskin, and skillfully threaded it with the white sinew. Picking up the tiny beads one by one, she strung them with the point of her thread, always twisting it carefully after every stitch.
It took many trials before I learned how to knot my sinew thread on the point of my finger, as I saw her do. Then the next difficulty was in keeping my thread stiffly twisted, so that I could easily string my beads upon it. My mother required of me original designs for my lessons in beading. At first I frequently ensnared many a sunny hour into working a long design. Soon I learned from self-inflicted punishment to refrain from drawing complex patterns, for I had to finish whatever I began.
After some experience I usually drew easy and simple crosses and squares. These were some of the set forms. My original designs were not always symmetrical nor sufficiently characteristic, two faults with which my mother had little patience. The quietness of her oversight made me feel strongly responsible and dependent upon my own judgment. She treated me as a dignified little individual as long as I was on my good behavior; and how humiliated I was when some boldness of mine drew forth a rebuke from her!
In the choice of colors she left me to my own taste. I was pleased with an outline of yellow upon a background of dark blue, or a combination of red and myrtle-green. There was another of red with a bluish-gray that was more conventionally used. When I became a little familiar with designing and the various pleasing combinations of color, a harder lesson was given me. It was the sewing on, instead of beads, some tinted porcupine quills, moistened and flattened between the nails of the thumb and forefinger. My mother cut off the prickly ends and burned them at once in the centre fire. These sharp points were poisonous, and worked into the flesh wherever they lodged. For this reason, my mother said, I should not do much alone in quills until I was as tall as my cousin Warca-Ziwin.
Always after these confining lessons I was wild with surplus spirits, and found joyous relief in running loose in the open again. Many a summer afternoon a party of four or five of my playmates roamed over the hills with me. We each carried a light sharpened rod about four feet long, with which we pried up certain sweet roots. When we had eaten all the choice roots we chanced upon, we shouldered our rods and strayed off into patches of a stalky plant under whose yellow blossoms we found little crystal drops of gum. Drop by drop we gathered this nature’s rock-candy, until each of us could boast of a lump the size of a small bird’s egg. Soon satiated with its woody flavor, we tossed away our gum, to return again to the sweet roots.
From “Impressions of an Indian Childhood” by Zitkala-Sa—Public Domain
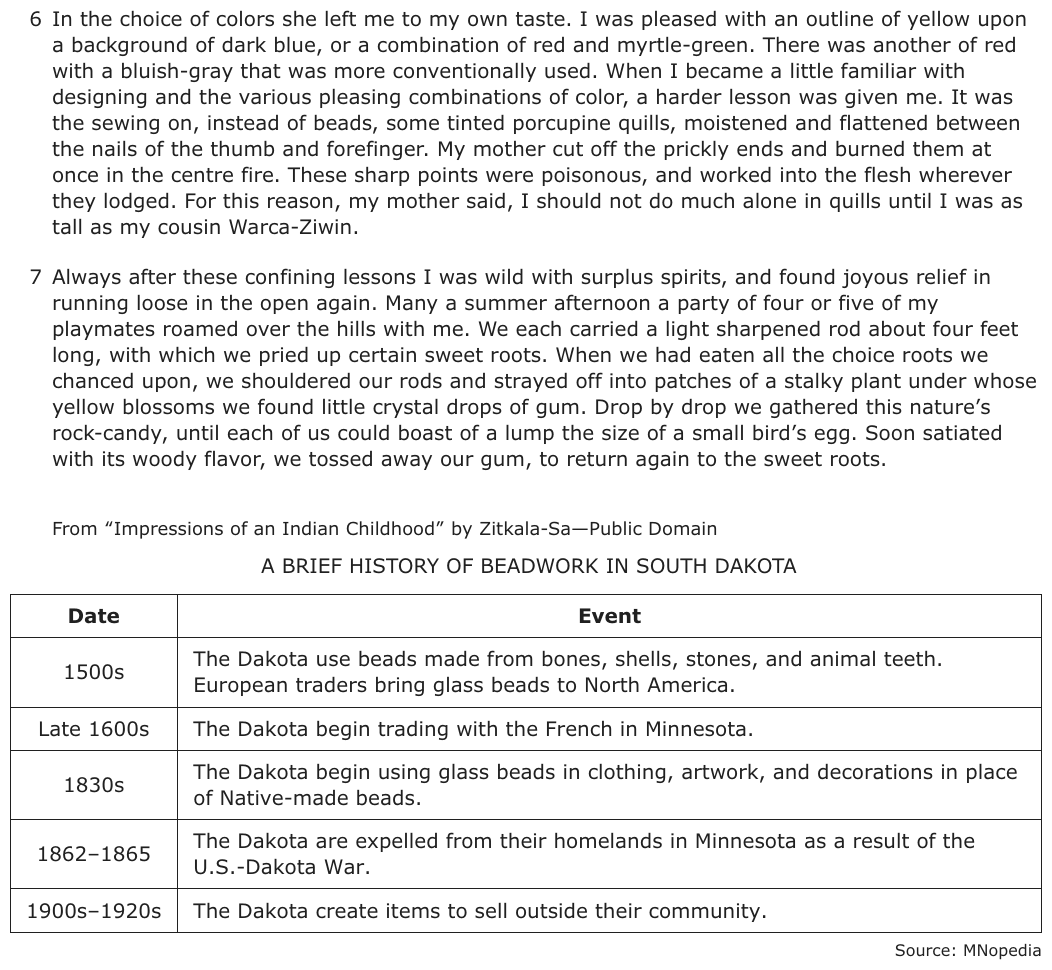
A BRIEF HISTORY OF BEADWORK IN SOUTH DAKOTA
| Date | Event |
|---|---|
| 1500s | The Dakota use beads made from bones, shells, stones, and animal teeth. European traders bring glass beads to North America. |
| Late 1600s | The Dakota begin trading with the French in Minnesota. |
| 1830s | The Dakota begin using glass beads in clothing, artwork, and decorations in place of Native-made beads. |
| 1862–1865 | The Dakota are expelled from their homelands in Minnesota as a result of the U.S.-Dakota War. |
| 1900s–1920s | The Dakota create items to sell outside their community. |
Source: MNopedia
1wigwam: hut with an arched framework of poles covered with bark, mats, or animal hides
2buckskin: leather made from the skin of a male deer
3skein: coiled length of yarn or other thread loosely wound on a reel
Question
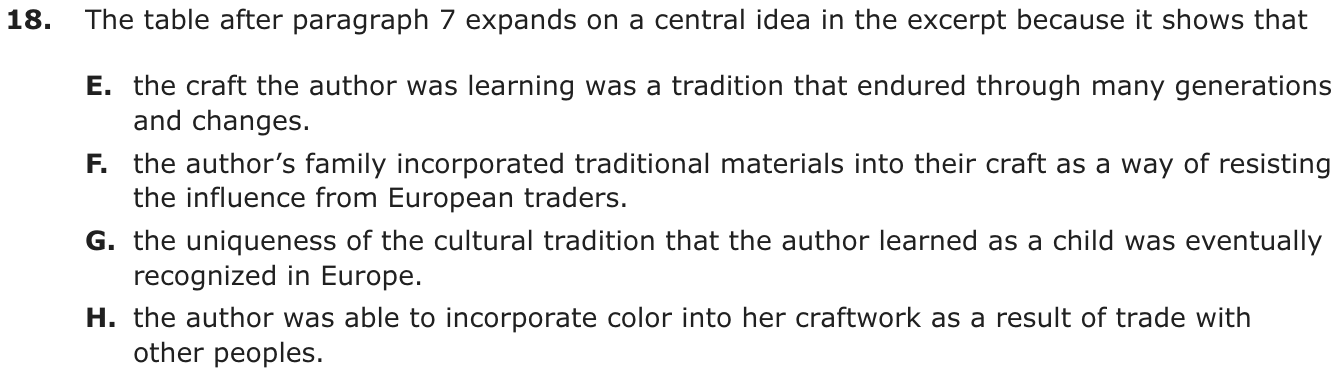
The table after paragraph 7 expands on a central idea in the excerpt because it shows that
- Athe craft the author was learning was a tradition that endured through many generations and changes.
- Bthe author’s family incorporated traditional materials into their craft as a way of resisting the influence from European traders.
- Cthe uniqueness of the cultural tradition that the author learned as a child was eventually recognized in Europe.
- Dthe author was able to incorporate color into her craftwork as a result of trade with other peoples.
Show the answer
Correct answer: A
The question asks how the table after paragraph 7 expands on a central idea in the excerpt.
A. CORRECT. The table provides the chronology from the 1500s, when the Dakota created beadwork using “beads made from bones, shells, stones, and animal teeth,” to the 1830s, when the Dakota began “using glass beads,” and the 1900s, when they created items to “sell outside their community.” Thus, the table helps expand on a central idea by showing that the craft the author was learning is a tradition that has endured through many generations.
B. Incorrect. Although the table shows that the Dakota used “beads made from bones, shells, stones, and animal teeth” in the 1500s and that by the 1830s began “using glass beads in clothing, artwork, and decorations in place of Native-made beads,” it does not provide any information about the type of materials used by the author’s family.
C. Incorrect. While the information included in the table states that “European traders [brought] glass beads to North America” in the 1500s and that by the 1920s the Dakota created “items to sell outside their community,” there is no mention of whether the uniqueness of Dakota beadwork was recognized in Europe.
D. Incorrect. The table indicates that by the late 1600s the Dakota began trading with French traders from Europe who brought glass beads to the Americas and that by the 1830s the Dakota were “using glass beads in clothing, artwork, and decorations in place of Native-made beads.” However, the table provides no information about whether this work incorporated color. Therefore, the table does not show that the author was able to incorporate color into her craftwork as a result of trade with other peoples.
Question analysis
This reading question asks how a table titled A Brief History of Beadwork in South Dakota, printed after Zitkala-Sa's excerpt, expands on one of its central ideas. Students must read a short timeline of beads, trade and war and connect it to a girl learning beadwork, while avoiding choices that sound historically likely but go beyond the table.
- Grade level
- Grade 7 reading and task
- Compared with grade 7
- At grade 7 Connecting a table to a text's central idea is grade 7 work. The table is short and plainly worded, and linking a people's history to one girl's lessons is a typical grade 7 step.
- Estimated difficulty
- Moderate: several steps, or a close reading with one strong distractor.
- Thinking it demands
- Depth of knowledge 3, strategic thinking · mainly analyze
- What makes it hard
- Reading a figure, table or graph moderate
- Combines ideas moderate
- Reading between the lines minor
- Evidence
- Answered from several paragraphs or stanzas
- Reading level
- Passage: about grade 8, 946 words; question and choices: about grade 11, 87 words.
- Corrected from the DOE handbook
- A date in the explanation was corrected to match the table.
- Students, last 30 days
- Not enough answers yet to show (it takes 10).
Why it is hard, traps and wrong answers (shows the answer)
Why it is hard
The table holds plenty of tempting raw material: European traders, glass beads, sales outside the community. Wrong answers build unsupported stories out of it, about resistance, European recognition or the arrival of color, and the last is the hardest to resist because the excerpt is full of colored beads. Students who sum up the table in one phrase, a craft carried on through centuries of change, can check each choice against what the rows actually say.
Reading a figure, table or graph moderate Understanding the question
The table runs from the 1500s to the 1920s, and its point appears only when the five rows are read as a timeline: new beads, trade, war and expulsion, yet the beadwork goes on. (Lesh, Post & Behr, 1987; Kirsch & Mosenthal, 1990)
Combines ideas moderate Working it out
Students must join the table's history of the Dakota to one girl's lessons in paragraphs 3–6 and see that the craft she learns belongs to that long line. (Embretson, 1998; Daniel & Embretson, 2010)
Reading between the lines minor Working it out
Endurance is never stated; it has to be drawn from a beadwork history that spans four centuries, from bone and shell beads to items made for sale, through every change between. (Graesser, Singer & Trabasso, 1994; Kintsch, 1998)
Strategy: Read the table from top to bottom and say in a few words what it shows over time, then pick the choice that fits that pattern and also connects to the excerpt.
Traps
- Reads too much in: A reasonable-sounding conclusion that goes further than the text allows.
- Outside knowledge: A choice is plausible in the real world but not supported by this text.
- Twists what the text says: Uses the text's topic and ideas but changes what it says: who did it, how much, when, or why.
The wrong answers, classified
B Twists what the text says (King et al., 2004)
Imagines the family holding to traditional materials to resist traders, though the 1830s row shows the Dakota taking up glass beads in place of Native-made ones.
C Reads too much in (Graesser, Singer & Trabasso, 1994)
Joins the European traders of the first row to the sales outside the community in the last and concludes that Europe recognized the craft, which no row states.
D Outside knowledge (King et al., 2004; Recht & Leslie, 1988)
Links the excerpt's colored beads to the glass beads traders brought and assumes trade supplied the color, but the table never mentions color, so that link comes from outside it.
What was corrected from the DOE handbook, and why
- Explanation: In rejecting choice D, the handbook says that “by 1830” the Dakota were using glass beads in clothing, artwork and decorations. The table places that change in the 1830s (“The Dakota begin using glass beads …”), and the handbook’s own reason for rejecting choice B says “by the 1830s.” The explanation now reads “by the 1830s.”
Working it out, step by step
Figure out what the question asks
The excerpt ends with a table, a chart of facts in rows. You need to see how the table adds to a central idea of the excerpt. A central idea is an important message.
Read the table as a timeline
- 1500s: the Dakota make beads from bones, shells, stones and teeth.
- Late 1600s: they begin trading with the French.
- 1830s: they use glass beads “in place of Native-made beads.”
- 1862–1865: a war forces them out of their homelands.
- 1900s–1920s: they make items to sell outside their community.
Find the pattern
The beads change. Trade begins. A war drives the people from their land. But through all of it, the beadwork goes on for hundreds of years. The girl in the excerpt is learning this same craft from her mother. So the table shows her craft is a tradition, a custom passed down through many generations.
Check each choice
- A is right. The craft lasted through many changes over hundreds of years.
- B is wrong. The table shows the Dakota took up glass beads, not that they resisted traders.
- C is wrong. No row says Europe ever praised the craft.
- D is wrong. The table never mentions color.
Watch out: D is tempting because the excerpt is full of colored beads, and traders brought glass beads. But the link to color is a guess. The table doesn’t say it.
Choose the answer
The table shows beadwork lasting through centuries of change, just like the craft the girl learns. So the answer is A.
Why this answer and not the closest wrong one
D is the closest wrong answer. Traders did bring glass beads, and the girl’s beads are colorful. But no row of the table says trade gave the Dakota color. Nothing ties it to the author’s own work either. A sums up what the rows actually show: a craft that went on through change.
More questions like this
The original DOE question
The passage “Excerpt from “Impressions of an Indian Childhood”” as printed (pages 42–43)
Question 12 of 35
2024 Test A English, question 34Passage Champion of the Channel
Champion of the Channel
In 1926 an editor at the London Daily News predicted that Gertrude Ederle, an American swimmer with eighteen world records and three Olympic medals, would fail in her attempt to swim across the English Channel. He claimed that “even the most uncompromising champion of the rights and capacities of women must admit that in contests of physical skill, speed and endurance they must remain forever the weaker sex.” Yet, at only nineteen years old, Ederle not only became the first woman to accomplish this feat, she also broke the men’s record by two hours. Gertrude Ederle’s triumphant swim across the English Channel was a testimony to her determination, innovative spirit, and passion for swimming.
Crossing the English Channel is a daunting task for any swimmer. At its narrowest point, the channel measures twenty-one miles across. Its icy waters hover around sixty degrees Fahrenheit, and its unruly tides and currents toss swimmers about like bobbing corks. Stinging jellyfish, seaweed, and floating debris from shipwrecks and lost cargoes present added hazards.
For decades the channel’s perils have defeated countless swimmers. Ederle, too, failed in her first attempt to cross the channel in 1925. Just six miles short of finishing, she became ill, and her coach had to haul her out of the water. Undeterred, Ederle decided to try again. Ederle knew that if she did not complete the challenge this time, she might never get the opportunity to set this record, because a rival female swimmer was preparing to make her second attempt at the crossing as well.
To prepare for the marathon swim, Ederle found ways to improve her equipment. She and her sister Meg discovered that melted candle wax perfectly sealed goggle edges, effectively waterproofing Ederle’s goggles against hammering waves. The sisters also designed a two-piece silk swimsuit for Ederle. During her first channel-crossing attempt she had worn a standard one-piece swimsuit that, after the lengthy hours of swimming across the channel, had stretched out, filling with water and creating drag, making an already challenging task almost insurmountable. Unlike the cumbersome typical bathing suit, this silk invention weighed little and allowed for easy movement.
On August 6, 1926, Ederle waded into the channel near Cape Gris-Nez, France. At first she shivered in the bone-chilling water even though she had covered her body in eight layers of grease for insulation. Her limbs felt stiff. Her strokes were irregular. Driving forward, she fought to clear her mind and find what she called her “sphere,” a place where the sea became her only companion and the shrieks of gulls and the humming of boat engines faded away. Using a new overhand stroke called the American crawl, Ederle eventually settled into a steady pace, briskly breaking through waves.
Throughout Ederle’s swim, two tugboats accompanied her. One carried newspaper reporters who wired dispatches of her progress to shore. The other, displaying a sign that read “This way, ole kid!” with an arrow pointing forward, transported her coach, family, and friends. Her coach played songs, such as “Yes, We Have No Bananas,” on a phonograph so that Ederle could time her strokes to the rhythm. Using a net, her coach also passed her baby bottles of broth for nourishment.
For hours Ederle swam, dodging debris with an amused smile. However, as she neared the English shore, a sudden fierce storm erupted. The tides and waves forced Ederle backward, and she fought the stubborn swells for several hours. The salty water caused her tongue to swell and inflamed her ears. Yet Ederle felt indescribably happy as she churned through the sea. Finally, as she neared the English shore, the storm abated, and the tide turned. No longer fighting against her, the sea pushed her toward the shore and victory.
After fourteen hours and thirty-one minutes, Ederle, on wobbly legs, stepped onto the English shore. The waiting crowd roared, honked their automobile horns, blasted their tugboat whistles, and set off flares that flashed in the sky. Ederle had swum into history.
When Ederle returned to New York, she received a parade, where thousands of people shouted “Trudy!” Not only were everyday American citizens proud of Ederle, but she also inspired them to be more active. Over the next few years, more than 60,000 people credited her with motivating them to earn their American Red Cross swimming certificates. Gertrude Ederle’s accomplishment proved to the world that with determination and passion, it was possible for a person to achieve his or her goals.
SOLO SWIMS ACROSS THE ENGLISH CHANNEL
|
Earliest Speed Records |
||
| Year | Swimmer | Time |
| 1875 | Matthew Webb (M) | 21 hours, 45 minutes |
| 1923 | Enrico Tiraboschi (M) | 16 hours, 33 minutes |
| 1926 | Gertrude Ederle (F) | 14 hours, 31 minutes |
| 1926 | Arnst Vierkotter (M) | 12 hours, 38 minutes |
| Current Speed Records | ||
| Year | Swimmer | Time |
| 2012 | Trent Grimsey (M) | 6 hours, 55 minutes |
| 2006 | Yvetta Hlavacova (F) | 7 hours, 25 minutes |
Question
The table builds on the information in the passage mainly by
- Aemphasizing that people have continued to swim across the channel and have significantly improved the speed record.
- Bsuggesting that Ederle inspired many women to swim across the channel to attempt to break the current speed record.
- Crevealing that other women competed with Ederle to set a record time for swimming across the English Channel.
- Dproviding a comparison between the earliest channel-swimming records and the current record times.
Show the answer
Correct answer: A
The question asks how the table mainly builds on the information in the passage.
A. CORRECT. The table supports the information in the passage by showing that people have continued to swim the channel and have significantly improved on past records. The information in the table about records set by those who came after Ederle builds on the idea that “Gertrude Ederle’s accomplishment proved to the world that with determination and passion, it was possible for a person to achieve his or her goals” (paragraph 9).
B. Incorrect. Even though paragraph 9 states that Ederle “inspired [everyday American citizens] to be more active” and the table presents the time for the current female record holder, there is no indication in the passage or in the table that the subsequent female record holders were inspired to swim across the channel by Ederle.
C. Incorrect. Although paragraph 3 mentions that Ederle had a female rival and the table includes the speed record of another female swimmer, the passage does not provide information about other female swimmers competing with Ederle to set the channel-swim record.
D. Incorrect. Although paragraph 1 mentions that Ederle “broke the men’s record by two hours” and the table allows for comparisons between the earliest speed records and those of the present day, the passage mentions no channel-swim records set after Ederle’s swim, so it says nothing about current record times. The table allows for comparison, but this aspect of the table does not build on the information presented in the passage.
Question analysis
This question asks how a table of English Channel speed records, from Matthew Webb's 1875 crossing to a 2012 record, builds on the passage about Gertrude Ederle. Students must read times from two eras and decide what the table adds to the text, while the choices mix accurate observations about the table with claims neither source supports.
- Grade level
- Grade 8 reading and task
- Compared with grade 7
- Above grade 7 Relating a table to a passage is within grade 7 standards, but here the student must compare records from two eras, connect them to ideas in the text and choose among closely worded statements, well above typical grade 7 demand.
- Estimated difficulty
- Among the hardest on the SHSAT: a non-obvious approach, heavy reading, or a well-hidden trap.
- Thinking it demands
- Depth of knowledge 3, strategic thinking · mainly analyze
- What makes it hard
- A very close wrong answer major
- Reading a figure, table or graph moderate
- How, not what moderate
- Evidence
- Answered from the whole text
- Reading level
- Passage: about grade 9, 790 words; question and choices: about grade 11, 78 words.
- Corrected from the DOE handbook
- A self-contradictory statement in the explanation was corrected.
- Students, last 30 days
- Not enough answers yet to show (it takes 10).
Why it is hard, traps and wrong answers (shows the answer)
Why it is hard
This is one of the hardest questions on the test because a wrong choice describes the table exactly, in its own words. The passage stops with Ederle's 1926 record, and what the table adds is the rest of the story: swimmers kept crossing, and the record fell to under seven hours. Students who describe what the table contains, rather than what it tells a reader who has finished the passage, lose the point.
A very close wrong answer major Choosing the answer
The comparison choice repeats the table's own headings, “Earliest Speed Records” and “Current Speed Records”, and is literally true; only the stem's “builds on the information in the passage” and “mainly” separate it from the choice about the falling record. (Embretson & Wetzel, 1987; Gorin & Embretson, 2006; Ascalon et al., 2007)
Reading a figure, table or graph moderate Understanding the question
The student must compare times across the table's two sections, from Webb's 21 hours 45 minutes in 1875 and Ederle's 14 hours 31 minutes to Grimsey's 6 hours 55 minutes in 2012. (Lesh, Post & Behr, 1987; Kirsch & Mosenthal, 1990)
How, not what moderate Working it out
The question asks what the table adds to a passage that ends in 1926, so the student must say what its later rows extend, not what its layout holds. (Anderson & Krathwohl, 2001)
Strategy: Read both sections of the table and say what it adds to Ederle's story, then keep only a choice that the table shows and that connects to an idea the passage itself develops.
Traps
- Wrong purpose or structure: Names a purpose, structure or effect that the part does not serve, or describes what a part says when the question asks what it does.
- Reads too much in: A reasonable-sounding conclusion that goes further than the text allows.
- Twists what the text says: Uses the text's topic and ideas but changes what it says: who did it, how much, when, or why.
The wrong answers, classified
B Reads too much in (Graesser, Singer & Trabasso, 1994)
Assumes Ederle inspired many women to chase the record, but the table lists one later woman, Yvetta Hlavacova in 2006, and nothing links her or anyone else to Ederle.
C Twists what the text says (King et al., 2004)
Joins the rival female swimmer of paragraph 3 to Hlavacova's 2006 time, inventing a contest among women in Ederle's day that neither the table nor the passage shows.
D Wrong purpose or structure (Anderson & Krathwohl, 2001)
Describes the table's layout, earliest records beside current ones, which is accurate, but stops at what it contains instead of saying what the comparison adds to Ederle's story.
What was corrected from the DOE handbook, and why
- Explanation: In rejecting choice D, the handbook notes that paragraph 1 says Ederle “broke the men’s record by two hours,” and then says “there is no mention in the passage of past, present, or future channel-swim records.” Paragraph 1 does mention a past record: the one Ederle broke. What the passage never mentions is a record set after hers, which is what the table’s “Current Speed Records” add. The explanation now says the passage mentions no channel-swim records set after Ederle’s swim, so it says nothing about current record times. The reason for rejecting D is otherwise unchanged.
Working it out, step by step
Understand the question
To build on something means to add to it. So this asks what the table adds to what the passage already tells you. Don’t just describe what is in the table. Ask what a reader learns from it after finishing the passage.
Read the table’s two parts
The table has two parts, “Earliest Speed Records” and “Current Speed Records.” These rows matter most:
Year Swimmer Time 1875 Matthew Webb 21 hours, 45 minutes 1926 Gertrude Ederle 14 hours, 31 minutes 2012 Trent Grimsey 6 hours, 55 minutes Compare the times
Ederle swam for 14 hours and 31 minutes. Half of her time would be about 7 hours and 15 minutes. Grimsey’s 2012 time, 6 hours and 55 minutes, is even faster than that. So people kept swimming the channel after 1926, and the record got much faster.
See what the passage leaves out
The passage does mention one record. In paragraph 1, Ederle “broke the men’s record by two hours.” But the passage stops in 1926. It never tells of any record set after her swim. The table adds that later part of the story: swimmers kept crossing, and the record kept falling.
Check each choice
- A fits: people kept crossing and “significantly improved the speed record,” and significantly means by a lot.
- B is wrong because nothing links any later woman to Ederle, and the table lists only one later woman.
- C is wrong because Ederle is the only woman of her time in the table, and Hlavacova swam 80 years later, in 2006.
- D is wrong because it only names what the table holds, not what the comparison adds to Ederle’s story.
Watch out: D uses the table’s own headings, so it sounds right. But the question asks what the table adds, not how it is laid out.
Choose the answer
The table carries the story past 1926 and shows the record falling far below Ederle’s time. So the answer is A.
Why this answer and not the closest wrong one
D comes closest, because the table really does set the earliest and current records side by side. But D stops at describing the table. A says what that comparison shows a reader who has finished the passage: the record kept falling, from Ederle’s 14 hours and 31 minutes to under 7 hours.
More questions like this
The original DOE question
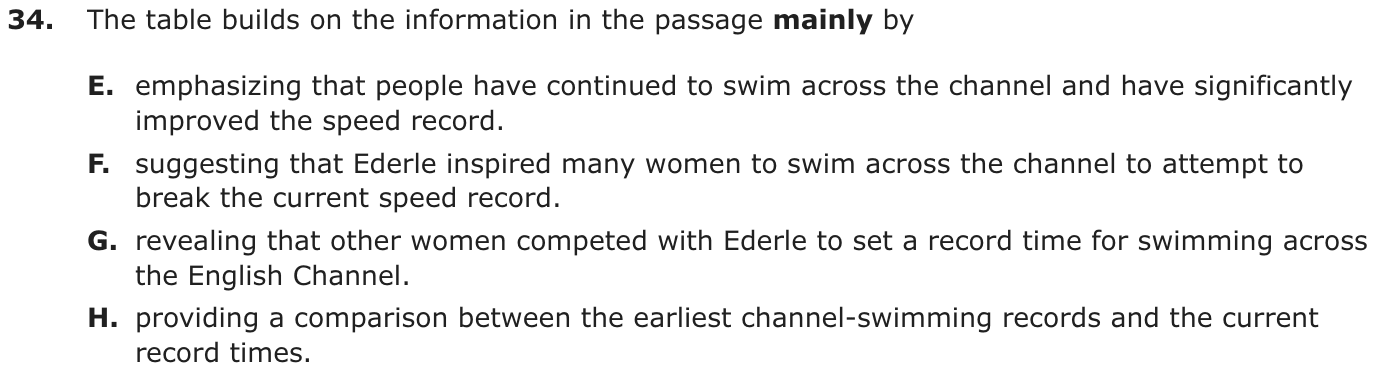
The passage “Champion of the Channel” as printed (pages 56–57)
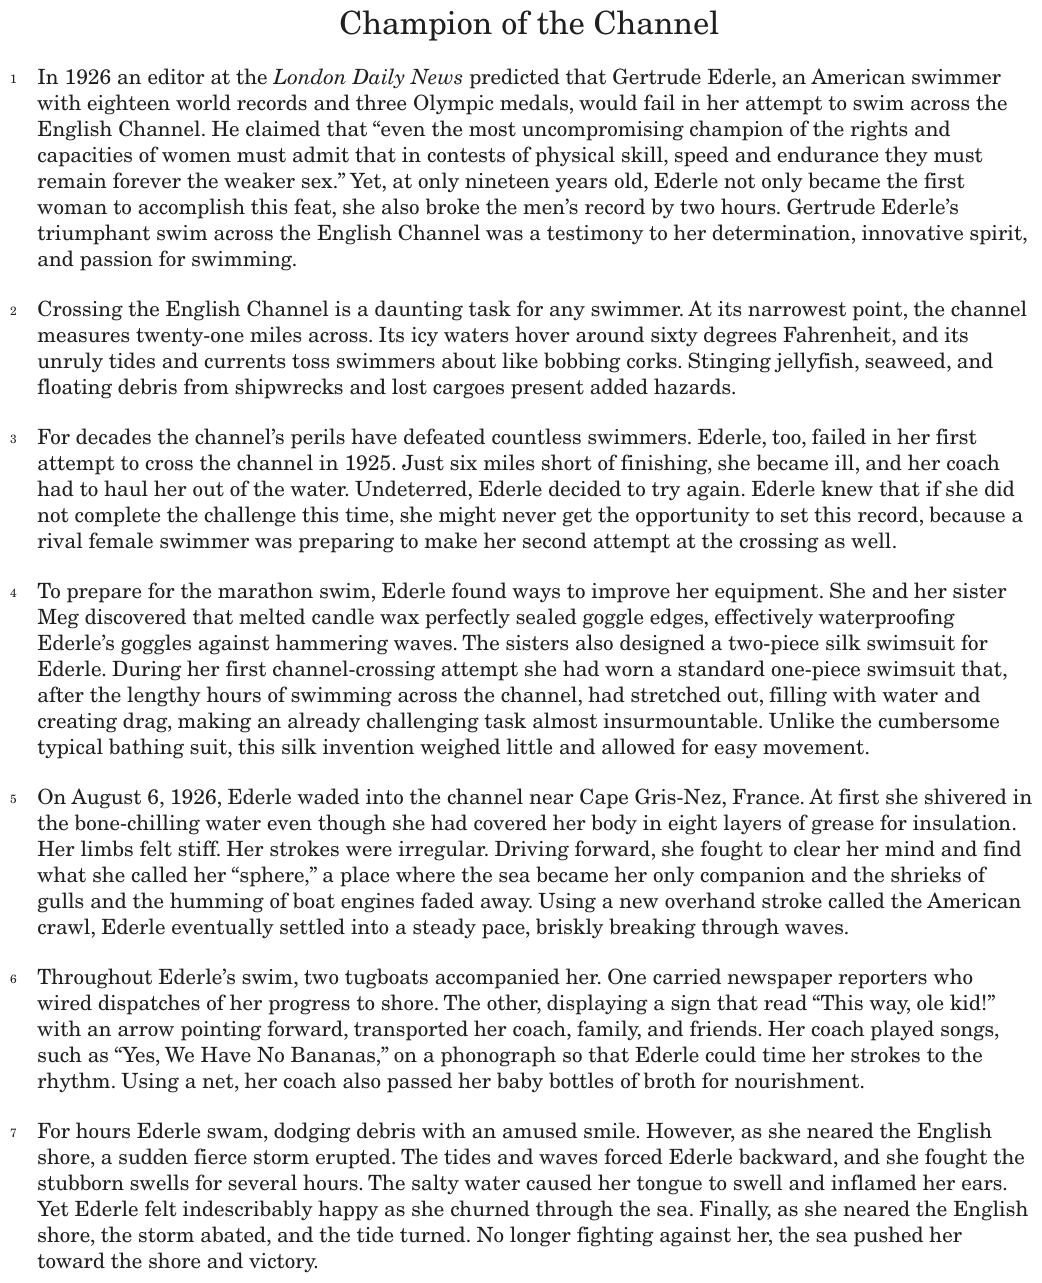
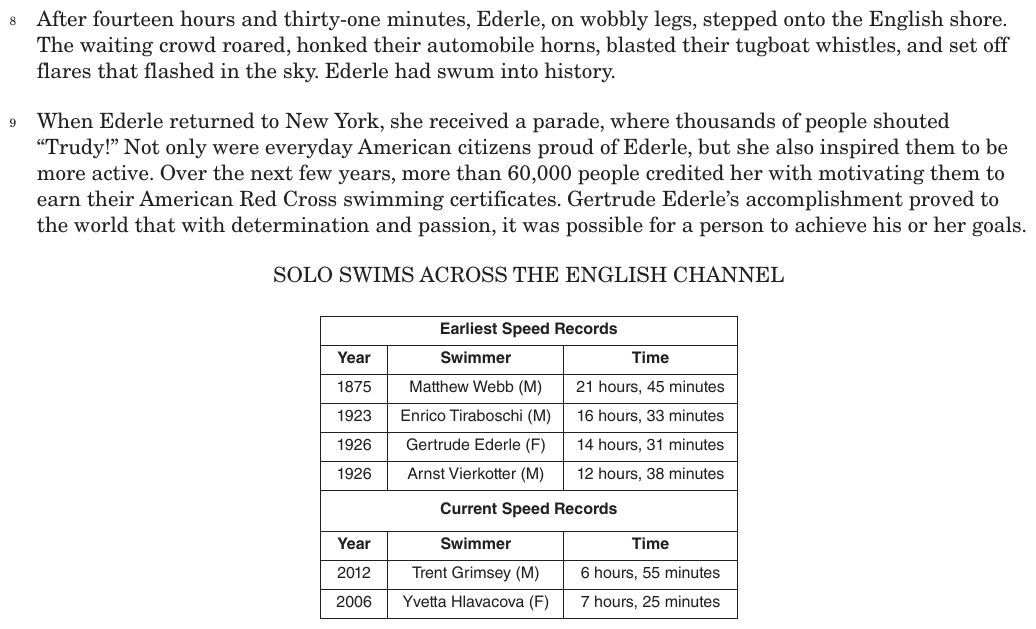
Question 13 of 35
2024 Test A Math, question 5Question
RESULTS FROM SURVEY OF 110 FAMILIES
| Number of Children in the Family | Number of Families |
|---|---|
| 0 | 45 |
| 1 | 32 |
| 2 | 19 |
| 3 | 8 |
| 4 | 6 |
The table above shows the number of children in each of 110 families. What is the median number of children in these families?
Grid-in question: work out the answer and enter it as a number.
Show the answer
Correct answer: 1
Since 110 families were surveyed, the median will have 55 values less than or equal to it, and 55 values greater than or equal to it.
If the values in the table were listed in order, they would look like this:
The first row of the table indicates that 45 families had 0 children.
The second row of the table indicates that 32 families had 1 child.
So 77 families had either 0 children or 1 child, and 45 families had 0 children.
Since 55 is between 45 and 77, the median must be a value in the second row of the table.
So the median is 1.
Question analysis
This statistics grid-in gives a frequency table from a survey of 110 families, showing how many families have each number of children from none to four. Students find the median number of children per family. The table lists counts rather than the 110 data values themselves, so locating the middle value takes a running total of the families.
- Grade level
- Grade 6 content, by NYS standard
- Compared with grade 7
- Above grade 7 Grade 7 median problems usually list a dozen or so values. Here 110 values are hidden in a frequency table, so students must reason about positions with a running count, a less familiar and more error-prone task.
- Estimated difficulty
- Hard: combines ideas, needs a plan, and has more than one tempting wrong answer.
- Thinking it demands
- Depth of knowledge 2, skills and concepts · mainly apply
- What makes it hard
- Reading a figure, table or graph major
- No obvious method moderate
- An answer in an unexpected form minor
- Solution
- 3 steps
- Reading level
- Question and choices: about grade 7, 35 words.
- Students, last 30 days
- Not enough answers yet to show (it takes 10).
Why it is hard, traps and wrong answers (shows the answer)
Why it is hard
Students know a median as the middle of a list, but here the list is never written out. Treating the table's columns as the data gives quick, confident answers, 2 from the middle of the children column or 19 from the middle of the family counts, and neither can be checked against choices. The question rewards counting positions: 45 families have no children, so the 55th and 56th families both fall among the 32 with one child.
Reading a figure, table or graph major Understanding the question
The table hides 110 data values in five rows: the 0 to 4 column lists the possible values, and 45, 32, 19, 8 and 6 say how many families have each. (Lesh, Post & Behr, 1987; Kirsch & Mosenthal, 1990)
No obvious method moderate Working it out
The median of 110 values lies between the 55th and 56th; finding them takes a running count of families, 45 and then 77, a method seldom practiced with tables. (Schoenfeld, 1985)
An answer in an unexpected form minor Choosing the answer
As a grid-in there are no choices to compare, so a student who takes the middle row's 2 has nothing on the page to suggest it is wrong. (Enright, Morley & Sheehan, 2002)
Strategy: With 110 values the median sits between the 55th and 56th; add the family counts row by row until the running total passes 55, and read that row's number of children.
Traps
- Misunderstands the concept: A wrong belief about a concept: that percents can be added, that area grows like length, that averages can be averaged, that a bigger denominator means a bigger fraction.
- Answers a different question: A choice is right for another quantity: the other unknown, the rest instead of the part, the part instead of the whole.
The wrong answers, classified
2 Misunderstands the concept (Smith, diSessa & Roschelle, 1993; De Bock et al., 1998; Ni & Zhou, 2005)
Takes the middle entry of the children column, 0 to 4, ignoring that each number of children belongs to a different number of families.
19 Answers a different question (King et al., 2004; Hegarty, Mayer & Monk, 1995)
Finds the median of the Number of Families column, 6, 8, 19, 32 and 45, a middle family count rather than a number of children.
1.07 Answers a different question (King et al., 2004; Hegarty, Mayer & Monk, 1995)
Computes the mean instead, 118 children among 110 families, about 1.07, a different measure of center from the median asked for.
Worked solution, step by step
Formulas used
- Spot of the median
- The median is the middle value when all the values are put in order. n is how many values there are. This gives the spot of the middle value, with the same number of values before and after it. If it ends in a half, the median is halfway between the two values on either side.
Sort out the table
The table covers 110 families. The left column is a number of children. The right column says how many families have that many children. For example, 45 families have 0 children. You need the median number of children. The median is the middle value when all the values are in order.
Picture the values in order
Think of a list with one number for each family: how many children it has. The list has 45 zeros, then 32 ones, then 19 twos, then 8 threes, then 6 fours. It is already in order, from least to most.
There are 110 values. Watch out: the median is not the middle row, 2. Each row stands for a different number of families.
Find the middle spot
Use the median rule with n = 110.
The middle is halfway between the 55th and 56th values. So you need those two values in the list.
Count down the list
Keep a running total of families, row by row. The zeros fill spots 1 to 45. Now add the 32 families with 1 child.
So the ones fill spots 46 to 77. Spot 55 and spot 56 are both in that range. So both values are 1.
Give the median
The 55th and 56th values are both 1. Halfway between 1 and 1 is 1. So the median is 1 child. Watch out: the median is a number of children, not of families. Gridding 19, from the families column, is wrong. So is the mean, or average, which is about 1.07. So you would grid 1.
Check your answer
Half of 110 is 55. Families with 0 children: 45, which is less than half. So the median is not 0. Families with 0 or 1 child: 77, which is more than half. So the median is not more than 1. It must be 1.
More questions like this
The original DOE question
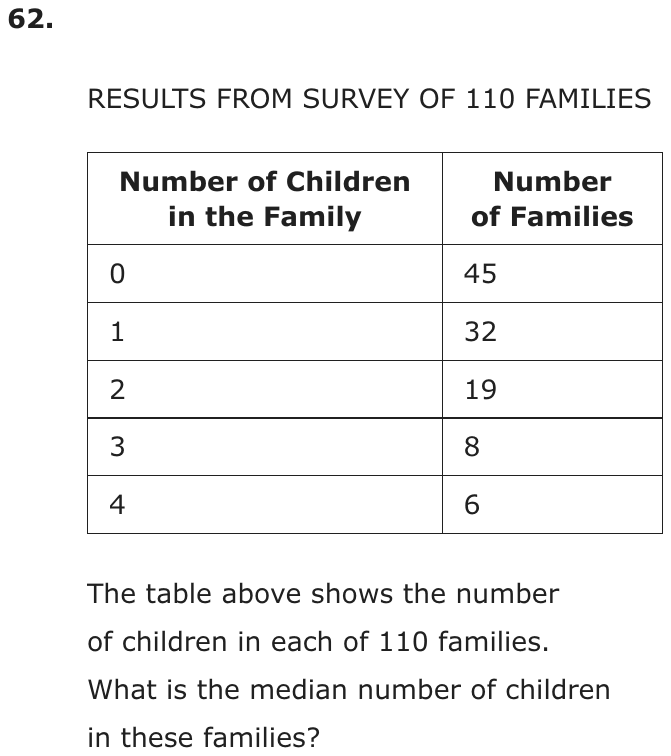
Question 14 of 35
2024 Test A Math, question 28Question
QUIZ SCORES IN
MRS. ARCH’S CLASS
| Quiz Score | Number of Students |
|---|---|
| 60 | 9 |
| 70 | 7 |
| 80 | 4 |
| 90 | 5 |
| 100 | 3 |
In the table above, what is the mean quiz score?
- A60
- B70
- C75
- D80
Show the answer
Correct answer: C
First, find the total number of students who took the quiz.
Multiply each quiz score by the number of students who received that score. Add those products together to find the total number of points scored.
To find the mean quiz score, divide the total number of points by the number of students who took the quiz.
Question analysis
A frequency table question: the table lists five quiz scores from 60 to 100 and how many students in Mrs. Arch's class earned each. Students find the mean quiz score for the whole class. Each score has to count once for every student who earned it, and the class size has to be added up from the table.
- Grade level
- Grade 6 content, by NYS standard
- Compared with grade 7
- At grade 7 A mean from a frequency table is grade 6 content in a three-step form that grade 7 students meet regularly. Five rows of products make it slightly longer than a typical exercise, but the arithmetic is friendly.
- Estimated difficulty
- Moderate: several steps, or a close reading with one strong distractor.
- Thinking it demands
- Depth of knowledge 2, skills and concepts · mainly apply
- What makes it hard
- Reading a figure, table or graph moderate
- Many steps minor
- Error-prone arithmetic minor
- Solution
- 3 steps
- Reading level
- Question and choices: about grade 2, 19 words.
- Students, last 30 days
- Not enough answers yet to show (it takes 10).
Why it is hard, traps and wrong answers (shows the answer)
Why it is hard
The table invites a shortcut: average the five scores in the first column and get a round number that is a choice. That ignores the fact that more students earned the low scores than the high ones, which pulls the true mean down. Weighting each score by its count is a five-row calculation with friendly numbers, and the other choices catch students who confuse the mean with the most common or the middle score.
Reading a figure, table or graph moderate Understanding the question
Each row of the table stands for several students, 9 with 60, 7 with 70 and so on, so a score counts once per student and the class size, 28, must be added up. (Lesh, Post & Behr, 1987; Kirsch & Mosenthal, 1990)
Many steps minor Working it out
Five products, 540, 490, 320, 450 and 300, must be found and added to 2,100 before dividing by the 28 students. (Daniel & Embretson, 2010; Enright, Morley & Sheehan, 2002)
Error-prone arithmetic minor Working it out
The last step, 2,100 ÷ 28, is not a familiar fact; noticing that 28 × 75 = 2,100, or testing the choices, keeps it quick. (Brown & Burton, 1978; Junker & Sijtsma, 2001)
Strategy: Multiply each score by its number of students, add the products for the total points, add the student counts, and divide the points by the students.
Traps
- Misunderstands the concept: A wrong belief about a concept: that percents can be added, that area grows like length, that averages can be averaged, that a bigger denominator means a bigger fraction.
- Answers a different question: A choice is right for another quantity: the other unknown, the rest instead of the part, the part instead of the whole.
The wrong answers, classified
A Answers a different question (King et al., 2004; Hegarty, Mayer & Monk, 1995)
Picks the score that the most students earned, 60, the mode of the class, instead of computing the mean.
B Answers a different question (King et al., 2004; Hegarty, Mayer & Monk, 1995)
Finds the median instead: in the ordered list of 28 scores, the 14th and 15th are both 70.
D Misunderstands the concept (Smith, diSessa & Roschelle, 1993; De Bock et al., 1998; Ni & Zhou, 2005)
Averages the five listed scores, (60 + 70 + 80 + 90 + 100) ÷ 5 = 80, without weighting each by its number of students.
Worked solution, step by step
Formulas used
- Mean from a table
- The mean is the average score. Total points is every student’s score added up. Each score in the table counts once for every student who got it. Number of students is how many took the quiz.
Sort out the table
The left column lists quiz scores. The right column says how many students got each score. For example, 9 students scored 60. You need the mean quiz score, which is the average.
Count the students
28 students took the quiz. So there are 28 scores in all, not just 5.
Find the total points
Each score counts once for each student who got it. So multiply each score by its number of students.
Score Students Points 60 9 70 7 80 4 90 5 100 3 The class scored 2,100 points in all.
Divide to find the mean
To divide, try . That leaves , and . So the mean is . Watch out: do not just average the five scores in the table. That gives 80, choice D. Also, 70 is the median and 60 is the most common score, choices B and A. So the answer is C, 75.
Check your answer
More students scored low, 60 or 70, than high. So the mean should be below 80, the middle of the listed scores. 75 is below 80. Also, , the total points.
More questions like this
The original DOE question
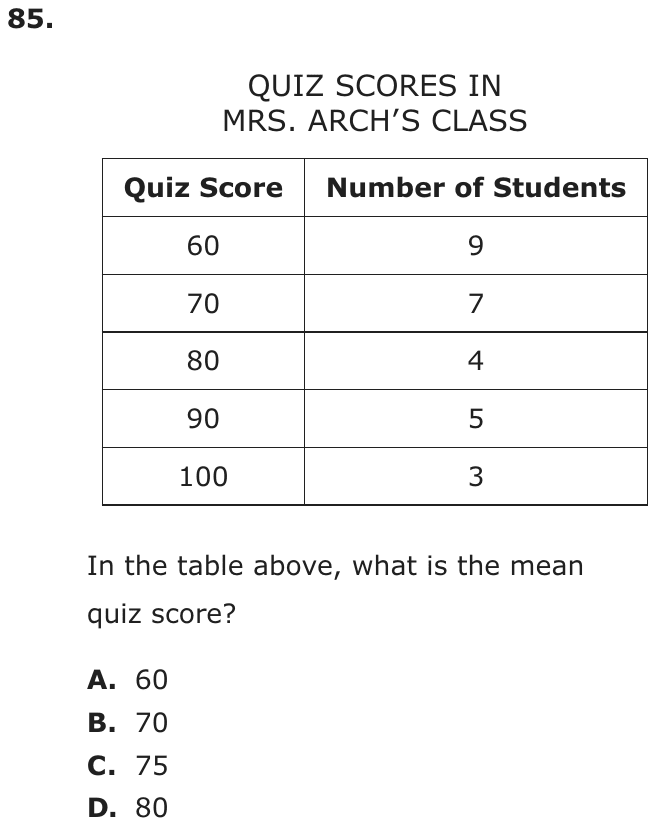
Question 15 of 35
2024 Test A Math, question 32Question
INGREDIENTS FOR 4 SERVINGS OF OATMEAL
| Ingredient | Cups |
|---|---|
| Oats | |
| Water |
The table shows the cups of ingredients used to make 4 servings of oatmeal. What is the unit rate for cups of oats per cup of water?
- A
- B
- C
- D
Show the answer
Correct answer: B
The unit rate for cups of oats per cup of water can be found by dividing the number of cups of oats by the number of cups of water:
The denominator can be rewritten as .
The quotient can be rewritten as:
Therefore, the unit rate for cups of oats per cup of water is .
Question analysis
This unit rate question uses a recipe table for 4 servings of oatmeal, with 2/3 cup of oats and 3 1/4 cups of water, and asks for cups of oats per cup of water. Students divide one fraction by another, including a mixed number. Deciding which quantity goes on top, and whether the number of servings matters, is the tricky part.
- Grade level
- Grade 7 content, by NYS standard
- Compared with grade 7
- At grade 7 Unit rates from fractions, such as 1/2 mile in 1/4 hour, are exactly grade 7 work. This one adds a mixed number, a fraction divided by a fraction, and a table titled for 4 servings, so students must decide which numbers the rate uses.
- Estimated difficulty
- Moderate: several steps, or a close reading with one strong distractor.
- Thinking it demands
- Depth of knowledge 2, skills and concepts · mainly apply
- What makes it hard
- Error-prone arithmetic moderate
- Turning words into math moderate
- Reading a figure, table or graph minor
- Solution
- 3 steps
- Reading level
- Question and choices: about grade 6, 40 words.
- Students, last 30 days
- Not enough answers yet to show (it takes 10).
Why it is hard, traps and wrong answers (shows the answer)
Why it is hard
The question rewards reading the rate's wording exactly and then carrying out a fraction division without slips. The 4 servings in the title is the hook: dividing by 4 gives a per-serving amount that sounds like a unit rate and is listed. Students who write oats over water as one fraction, convert the mixed number and multiply by the reciprocal finish in a few lines.
Error-prone arithmetic moderate Working it out
The rate is a fraction over a mixed number, 2/3 ÷ 3 1/4, so 3 1/4 must become 13/4 and the division a multiplication by 4/13. (Brown & Burton, 1978; Junker & Sijtsma, 2001)
Turning words into math moderate Understanding the question
In "cups of oats per cup of water" the quantity before "per" goes on top; reading the phrase loosely puts water over oats or brings in servings. (Hegarty, Mayer & Monk, 1995; Koedinger & Nathan, 2004)
Reading a figure, table or graph minor Understanding the question
The table's title, "for 4 servings", supplies the only other number on the page, and it plays no part in a rate of oats to water. (Lesh, Post & Behr, 1987; Kirsch & Mosenthal, 1990)
Strategy: Write the rate as cups of oats over cups of water, change the mixed number to an improper fraction, and divide by multiplying by its reciprocal.
Traps
- Information you don't need: The question gives numbers or facts that play no part in the answer.
- Answers a different question: A choice is right for another quantity: the other unknown, the rest instead of the part, the part instead of the whole.
- Wrong operation: Adds instead of multiplying, divides the wrong way round, turns a ratio or rate upside down, or undoes a step in the wrong direction (subtracts what should be added back).
The wrong answers, classified
A Answers a different question (King et al., 2004; Hegarty, Mayer & Monk, 1995)
Divides the 2/3 cup of oats by the 4 servings, 2/3 ÷ 4 = 1/6, giving oats per serving instead of oats per cup of water.
C Answers a different question (King et al., 2004; Hegarty, Mayer & Monk, 1995)
Divides the 3 1/4 cups of water by the 4 servings, 13/4 ÷ 4 = 13/16, leaving the oats out altogether.
D Wrong operation (Hegarty, Mayer & Monk, 1995; King et al., 2004)
Turns the rate upside down, water over oats, and also drops the 3 of 2/3, dividing 13/4 by 2 to get 13/8.
Worked solution, step by step
Formulas used
- Unit rate
- A unit rate tells how much of the first amount goes with 1 of the second amount. The word per means for each. The amount named before per goes on top, and the amount after it goes on the bottom.
- Mixed number to fraction
- a is the whole number part, b is the top of the fraction, and c is the bottom. Each whole holds c pieces, so a wholes hold a times c pieces. Then add the b extra pieces.
- Dividing by a fraction
- a over b is the number you divide. c over d is the number you divide by. To divide by a fraction, multiply by its reciprocal, the fraction flipped upside down. This works because dividing by a number undoes multiplying by it.
Sort out the question
The table shows cup of oats and cups of water. You need the unit rate for “cups of oats per cup of water.” That is how many cups of oats go with 1 cup of water.
Watch out: the 4 servings play no part here. Dividing the oats by 4 servings gives cup for each serving, choice A.Set up the rate
Oats comes before per, so oats goes on top. Water goes on the bottom.
Watch out: water over oats flips the rate. That gives a number bigger than 1, like choice D.Change the mixed number
A mixed number is a whole number plus a fraction. Change to a fraction so you can divide.
So 3 and one quarter cups is 13 quarters of a cup.
Divide by multiplying
To divide by , multiply by its reciprocal, .
No whole number bigger than 1 divides both 8 and 39, so the fraction can’t be made simpler. The rate is cup of oats per cup of water.
So the answer is B, .
Check your answer
There is much more water than oats. So the oats for 1 cup of water should be small, and is about 0.2. Also multiply back: . That is the cups of oats in the table.
More questions like this
The original DOE question
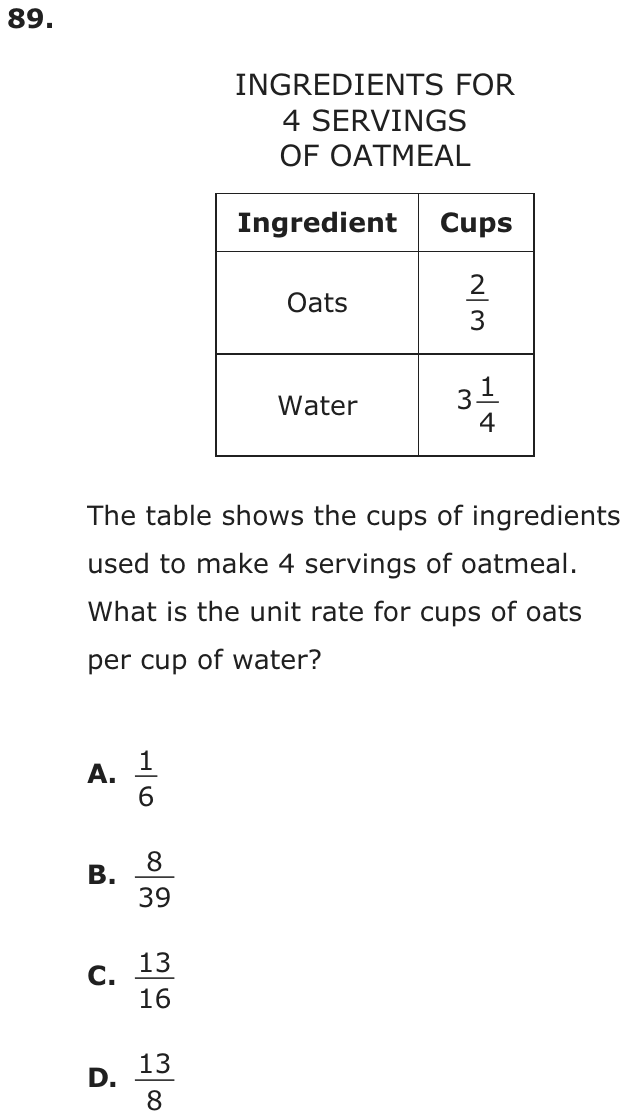
Question 16 of 35
2024 Test A Math, question 36Question
CELL PHONE SALES BY COLOR
| Color | Percentage of Cell Phones Sold |
|---|---|
| White | |
| Black | 30 |
| Blue | |
| Red | |
| Total | 100 |
The table above shows cell phone sales by color. What percentage of the cell phones sold were blue?
- A18%
- B20%
- C22%
- D28%
Show the answer
Correct answer: B
First, use the information given in the table and properties of equations to determine the value of k:
Then, determine the percentage of cell phones sold that were blue by finding the value of the expression (given in the table), when :
The percentage of cell phones sold that were blue is 20%.
Question analysis
A table of cell phone sales by color gives each color's percentage as an expression in k, such as 8k for white and 30 − 2k for blue, with a total of 100. Students write and solve an equation for k, then find the percentage for blue. Combining terms with a negative coefficient, and remembering that k itself is not the answer, both need care.
- Grade level
- Grade 7 content, by NYS standard
- Compared with grade 7
- At grade 7 Grade 7 students solve two-step equations that are written out for them. Here the equation must be built from a table whose percentages total 100, with like terms to combine, and the value found must then be substituted back.
- Estimated difficulty
- Moderate: several steps, or a close reading with one strong distractor.
- Thinking it demands
- Depth of knowledge 2, skills and concepts · mainly apply
- What makes it hard
- Many steps moderate
- Reading a figure, table or graph minor
- Error-prone arithmetic minor
- Solution
- 4 steps
- Reading level
- Question and choices: about grade 4, 36 words.
- Students, last 30 days
- Not enough answers yet to show (it takes 10).
Why it is hard, traps and wrong answers (shows the answer)
Why it is hard
The question hides an equation in a table, and the key insight is that the four percentages must add to 100. After that the algebra is routine, and no listed choice rewards stopping early, since neither k nor any other color's percentage appears. The wrong choices sit near the answer or use the blue expression with k ignored, so students who cannot set up the equation are left guessing.
Many steps moderate Working it out
The answer needs a chain: add the four expressions, set the sum to 100, collect 8k − 2k + k into 7k, solve for k, then substitute into 30 − 2k. (Daniel & Embretson, 2010; Enright, Morley & Sheehan, 2002)
Reading a figure, table or graph minor Understanding the question
No equation is printed; the table's Total row of 100 is what turns the four percentages written in k into one equation to solve. (Lesh, Post & Behr, 1987; Kirsch & Mosenthal, 1990)
Error-prone arithmetic minor Working it out
Collecting like terms includes the negative coefficient in the blue row, −2k, and the constants 30, 30 and 5 have to be gathered too. (Brown & Burton, 1978; Junker & Sijtsma, 2001)
Strategy: Add the four color expressions and set the sum equal to 100, combine like terms to solve for k, then substitute k into the blue row's expression.
Traps
- Numbers taken from the question: Combines the numbers in the question without a model of the situation, or is simply a number that appears in the question.
The wrong answers, classified
A Little reason to choose it (Haladyna & Downing, 1993; Rodriguez, 2005)
No common slip gives k = 6 from 7k + 65 = 100, the value 18% would need; it sits 2 points below the answer and mostly draws guesses.
C Little reason to choose it (Haladyna & Downing, 1993; Rodriguez, 2005)
No usual error in collecting terms or solving yields k = 4, which 22% requires, so this near neighbor of the answer mostly attracts guessers.
D Numbers taken from the question (Hegarty, Mayer & Monk, 1995)
Never solves for k and reads the blue entry 30 − 2k as 30 − 2, as if k were 1, giving 28.
Worked solution, step by step
Formulas used
- Combining like terms
- k is the unknown number. a and b are the numbers in front of k, called coefficients. Terms with the same letter are called like terms. You can add their coefficients, because a groups of k plus b groups of k make a + b groups of k.
- Keeping an equation balanced
- a and b are the two sides of an equation, and c is any number (not 0 when you divide). An equation is like a balanced scale. Doing the same thing to both sides keeps it balanced. Use it to undo each step and get k alone.
Sort out the table
The table gives the percent of phones sold in each color. Some entries use k, a letter that stands for an unknown number. 8k means 8 times k. You need the percent that were blue, . To find it, you first need k.
Write an equation for the total
Every phone sold is one of the four colors. So the four percents add up to the total, 100, as the last row of the table shows.
Combine like terms
Terms with k in them are called like terms, so they can be combined. Group the k terms together and the plain numbers together. A k on its own means 1k.
So the equation becomes . Watch out: the blue row takes away 2k. Keep its minus sign, or the k terms will be wrong.
Solve for k
Undo the adding first, then the multiplying.
So k is 5. But k is not the answer. You still need the blue row.
Find the blue percent
Put 5 in for k in the blue row.
So 20% of the phones sold were blue. Watch out: 2k means 2 times k, not 2. Reading as gives 28%, choice D.
So the answer is B, 20%.
Check your answer
Put k = 5 into every row. White: . Black: 30. Blue: 20. Red: . Now add them: . The total matches the table, so k = 5 is right.
More questions like this
The original DOE question
Question 17 of 35
2024 Test A Math, question 55Question
The table below shows the number of cups of red paint and blue paint used to make a purple paint mixture.
PURPLE PAINT
| Cups of Red Paint | Cups of Blue Paint |
|---|---|
| 1 | 1.5 |
| 4 | 6 |
| 11 | y |
Based on the relationship between the number of cups of red paint and the number of cups of blue paint, what is the value of y?
- A10.5
- B13
- C16.5
- D24
Show the answer
Correct answer: C
Divide the number of cups of blue paint by the number of cups of red paint to find the constant of proportionality.
Multiply to find the value of y.
Question analysis
A table gives cups of red and blue paint for a purple mixture: 1 and 1.5, 4 and 6, and 11 and an unknown y. This ratio table question asks for y based on the relationship between the two colors. The tricky part is noticing whether the relationship works by multiplying or by adding.
- Grade level
- Grade 7 content, by NYS standard
- Compared with grade 7
- Below grade 7 Finding a constant of proportionality from a table is grade 7 work, but here one row already pairs 1 cup of red with its cups of blue, so a single multiplication finishes it, lighter than typical grade 7 tasks.
- Estimated difficulty
- Routine: one familiar step, little to misread.
- Thinking it demands
- Depth of knowledge 2, skills and concepts · mainly apply
- What makes it hard
- Solution
- 2 steps
- Reading level
- Question and choices: about grade 4, 57 words.
- Students, last 30 days
- Not enough answers yet to show (it takes 10).
Why it is hard, traps and wrong answers (shows the answer)
Why it is hard
The relationship is multiplicative, 1.5 cups of blue for every cup of red, and one multiplication finishes the question. The trap is additive thinking: red grows by 7 cups from the second row to the third, and adding the same 7 to the blue column gives a listed answer. Testing a rule on every row exposes the additive one, since blue is 0.5 more than red in the first row but 2 more in the second.
Reading a figure, table or graph minor Understanding the question
The table's first row, 1 cup of red to 1.5 cups of blue, hands over the constant of proportionality; the other two rows only confirm it. (Lesh, Post & Behr, 1987; Kirsch & Mosenthal, 1990)
Strategy: Use the row with 1 cup of red paint to read the cups of blue per cup of red, multiply that rate by 11, and check the rate against the row with 4 cups.
Traps
- Misunderstands the concept: A wrong belief about a concept: that percents can be added, that area grows like length, that averages can be averaged, that a bigger denominator means a bigger fraction.
- Stops one step early: A choice is a number from partway through the solution.
The wrong answers, classified
A Stops one step early (King et al., 2004; Gierl et al., 2017)
Scales only the jump from 4 to 11 cups of red, 7 × 1.5 = 10.5, and forgets to add the 6 cups of blue already there.
B Misunderstands the concept (Smith, diSessa & Roschelle, 1993; De Bock et al., 1998; Ni & Zhou, 2005)
Thinks additively: red goes up 7 cups from 4 to 11, so adds the same 7 to the 6 cups of blue, getting 13.
D Numbers taken from the question (Hegarty, Mayer & Monk, 1995)
Multiplies the two numbers in the second row, 4 × 6 = 24, without finding how the two columns are related.
Worked solution, step by step
Formulas used
- Constant of proportionality
- x and y are two amounts that change together. k is the constant of proportionality: how much y goes with 1 of x. In a proportional relationship, y divided by x gives the same k every time.
- Proportional relationship
- x is the cups of red paint, and y is the cups of blue paint. k is the cups of blue for each cup of red. In a proportional relationship, y is always k times x. Use it to find y for any amount of red.
Sort out the table
The table shows cups of red and blue paint for the same purple. 1 cup of red goes with 1.5 cups of blue. 4 cups of red go with 6 cups of blue. You need y, the cups of blue for 11 cups of red. The same color means the paints mix at the same rate in every row.
Find the blue for each cup of red
Both rows give 1.5. So there are always 1.5 cups of blue for each cup of red. This number is the constant of proportionality.
Use the rate for 11 cups
Think of it as 11 cups plus half of 11 cups: . So y is 16.5 cups of blue.
Avoid the traps and answer
Watch out: red goes up 7 cups from 4 to 11. Adding the same 7 cups to the 6 cups of blue gives 13, choice B. Paint mixes by multiplying, not by adding. Watch out: , choice A, is only the extra blue for the 7 extra cups of red.So the answer is C, 16.5.
Check your answer
Divide to check: . That matches the other rows. Also, every row has more blue than red, so y must be more than 11. That rules out 10.5.
More questions like this
The original DOE question
Question 18 of 35
2024 Test B Math, question 19Question
Serena was studying the number of water stations for different lengths of races. The table below shows the data she collected.
WATER STATIONS IN RACES
| Length of Race (mi) | Number of Water Stations |
|---|---|
| 3 | 2 |
| 12 | 8 |
| 18 | 12 |
Which equation represents the relationship between the length of the race, x miles, and the number of water stations, y?
- A
- B
- C
- D
Show the answer
Correct answer: A
There is a proportional relationship between the length of the race, x miles, and the number of water stations, y. The constant of proportionality is
Therefore, the equation represents this relationship.
Question analysis
A table from a study of races shows the number of water stations for races of 3, 12 and 18 miles. Students choose the equation that links the race length x to the number of stations y. It tests reading a relationship from a table and expressing it as an equation in x and y.
- Grade level
- Grade 7 content, by NYS standard
- Compared with grade 7
- At grade 7 Writing an equation for a relationship given in a table is a central grade 7 skill. With three clean rows and whole numbers, this is a typical grade 7 exercise.
- Estimated difficulty
- Straightforward: two steps or one careful reading.
- Thinking it demands
- Depth of knowledge 2, skills and concepts · mainly apply
- What makes it hard
- A very close wrong answer moderate
- Reading a figure, table or graph minor
- Solution
- 2 steps
- Reading level
- Question and choices: about grade 6, 57 words.
- Students, last 30 days
- Not enough answers yet to show (it takes 10).
Why it is hard, traps and wrong answers (shows the answer)
Why it is hard
The table is small and its numbers are friendly, so the question comes down to which way the ratio runs and whether every row is checked. One wrong equation fits only the first row and another fits none, so testing a single row is not enough. Putting the 12-mile race into each equation, which should give 8 stations, leaves only one rule standing.
A very close wrong answer moderate Choosing the answer
The coefficients 2/3 and 3/2 use the same two digits, and only dividing stations by miles, 2 ÷ 3, rather than miles by stations, separates them. (Embretson & Wetzel, 1987; Gorin & Embretson, 2006; Ascalon et al., 2007)
Reading a figure, table or graph minor Understanding the question
The table lists miles first and stations second, while each equation puts stations, y, alone on the left, so every row must be read as an (x, y) pair. (Lesh, Post & Behr, 1987; Kirsch & Mosenthal, 1990)
Strategy: Test each equation on all three rows of the table, not just the first; only a rule that fits every row represents the relationship.
Traps
- Wrong operation: Adds instead of multiplying, divides the wrong way round, turns a ratio or rate upside down, or undoes a step in the wrong direction (subtracts what should be added back).
- Checks only one number: Tries one value in each choice and takes the first that works, when that value happens to work for a wrong choice too; a second value would rule it out.
- Numbers taken from the question: Combines the numbers in the question without a model of the situation, or is simply a number that appears in the question.
The wrong answers, classified
B Wrong operation (Hegarty, Mayer & Monk, 1995; King et al., 2004)
Divides race length by water stations, 3 ÷ 2, turning the ratio upside down, so the rule gives more stations than miles.
C Numbers taken from the question (Hegarty, Mayer & Monk, 1995)
Builds an addition rule from the gap of 6 between 18 and 12 in the last row, with the sign reversed, and it fits no row of the table.
D Checks only one number (Schoenfeld, 1985)
Checks only the first row, where 3 − 1 = 2 works, without testing the 12- and 18-mile races, where it gives 11 and 17.
Worked solution, step by step
Formulas used
- Proportional relationship
- x is the race length in miles, and y is the number of water stations. k is the constant of proportionality, the number of stations for each mile. Find it with y ÷ x. If every row gives the same k, the table is proportional.
Sort out the table
Each row of the table is a pair of numbers. The first is the race length, x, in miles. The second is the number of water stations, y. You need the equation that works for every row.
Divide y by x in each row
See if every row has the same ratio of stations to miles. Divide y by x.
Miles (x) Stations (y) y ÷ x 3 2 12 8 18 12 Every row gives 2/3. So the relationship is proportional: y is always the same number times x.
Write the equation
Here k is the ratio you found, .
Watch out: divide stations by miles, not miles by stations. 3 ÷ 2 gives 3/2, choice B. That rule would give more stations than miles.Test the other choices and answer
Watch out: test every row, not just the first one. Choice D, y = x − 1, works for 3 miles. But it gives 11 stations for 12 miles, not 8. Choice C, y = x + 6, gives 9 stations for 3 miles, not 2.So the answer is A, .
Check your answer
Put each race length into . , and . All three match the table.
More questions like this
The original DOE question
Question 19 of 35
2024 Test B Math, question 20Question
Centerville will hold a vote on whether to build a new park. The town council surveyed a random sample of 200 residents to determine whether they would be in favor of building this park. The table shows the results of the survey.
SURVEY RESULTS
| Opinion | Number of Residents |
|---|---|
| Yes | 142 |
| No | 38 |
| Undecided | 20 |
The mayor estimates that half the undecided voters will vote in favor of building the park. Based on the survey results, if the mayor is correct, how many of the 24,100 voters will be in favor of building the park?
- A17,111
- B18,316
- C19,401
- D19,521
Show the answer
Correct answer: B
If half the undecided voters (half of 20) vote in favor of building the park, the total number of “yes” votes from the survey will be 152.
There are 24,100 voters, and 200 residents were surveyed. Set up a proportion to solve:
Question analysis
A survey question: a random sample of 200 Centerville residents answered yes, no or undecided about building a park, and the mayor expects half the undecided to vote yes. Students use the sample to predict how many of 24,100 voters will favor the park. It joins a proportion from a sample with large-number arithmetic.
- Grade level
- Grade 7 content, by NYS standard
- Compared with grade 7
- At grade 7 Using a random sample to estimate a count in a whole population is a typical grade 7 proportion task. The extra step for the undecided group and the large numbers add care without going beyond grade 7.
- Estimated difficulty
- Hard: combines ideas, needs a plan, and has more than one tempting wrong answer.
- Thinking it demands
- Depth of knowledge 2, skills and concepts · mainly apply
- What makes it hard
- Error-prone arithmetic moderate
- Turning words into math moderate
- Reading a figure, table or graph minor
- Solution
- 3 steps
- Reading level
- Question and choices: about grade 5, 88 words.
- Students, last 30 days
- Not enough answers yet to show (it takes 10).
Why it is hard, traps and wrong answers (shows the answer)
Why it is hard
The setup is a sample-to-population proportion, and the trap is the mayor's assumption in the middle of the stem. Students who scale the 142 yes answers directly, or who count every undecided resident, reach believable totals that sit right among the choices. Once the count of 152 is settled, a rough estimate, about three quarters of 24,000, is enough to confirm the exact product.
Error-prone arithmetic moderate Working it out
Scaling 152 out of 200 up to 24,100 voters means computing 24,100 × 0.76, or 120.5 × 152, by hand with five-digit numbers. (Brown & Burton, 1978; Junker & Sijtsma, 2001)
Turning words into math moderate Understanding the question
The mayor's sentence adds a step: “half the undecided voters” turns the 20 undecided residents into 10 more yes votes, giving 152 before any scaling. (Hegarty, Mayer & Monk, 1995; Koedinger & Nathan, 2004)
Reading a figure, table or graph minor Understanding the question
The table gives Yes, No and Undecided counts, and the half must be taken of the Undecided row, not of the No row just above it. (Lesh, Post & Behr, 1987; Kirsch & Mosenthal, 1990)
Strategy: Count the sample's expected yes votes, including half of the undecided, write them as a fraction of 200, and multiply that fraction by 24,100; estimate first to check the choice.
Traps
- Misreads the question: Misses or misreads a condition or a word in the question: "at least", "each", "remaining", "not".
- Misreads the figure: Reads a value, label or tick spacing in a figure, table or graph wrongly.
The wrong answers, classified
A Misreads the question (Hegarty, Mayer & Monk, 1995)
Uses only the 142 yes answers, 142/200 of 24,100 = 17,111, leaving out the undecided residents the mayor expects to vote yes.
C Misreads the figure (Lesh, Post & Behr, 1987; Kirsch & Mosenthal, 1990)
Takes half of the 38 No answers instead of the 20 Undecided, reading the wrong row, so 161/200 of 24,100 ≈ 19,401.
D Misreads the question (Hegarty, Mayer & Monk, 1995)
Counts all 20 undecided residents as yes votes instead of half of them, so 162/200 of 24,100 = 19,521.
Worked solution, step by step
Formulas used
- Scaling up a sample
- A random sample is a smaller group picked by chance. Its share of yes votes should be about the same as the whole town’s share. So the two fractions are set equal. Use it to scale a survey up to a whole group.
Sort out what you know
The town surveyed 200 people. 142 said Yes, 38 said No, and 20 were Undecided (not sure yet). The mayor thinks half of the undecided people will vote yes. There are 24,100 voters in all. You need how many of them will vote yes.
Count the yes votes in the survey
Half of the 20 undecided people is . Add them to the yes votes.
So 152 of the 200 people surveyed would vote yes. Watch out: take half of the Undecided row, not the No row. Half of 38 leads to 19,401, choice C.
Find the share who vote yes
That is 76% of the people surveyed. The sample was random, so about 76% of all the voters should vote yes too. Watch out: using only the 142 yes votes gives 17,111, choice A. Counting all 20 undecided people gives 19,521, choice D.
Scale up to all the voters
Break it into easy parts. 75% is , and 1% is .
So the answer is B, 18,316.
Check your answer
Estimate. 76% is a little more than three fourths. Three fourths of 24,000 is 18,000. So the answer should be a little more than 18,000, and 18,316 fits. Also, , the same share as the survey.
More questions like this
The original DOE question
Question 20 of 35
2024 Test B Math, question 30Question
GIA’S MIX
| Snack | Number in Bag |
|---|---|
| Pretzels | 12 |
| Raisins | 9 |
Gia and her friends counted the numbers of pretzels and raisins in their snack mix. The table above shows the numbers in Gia’s mix. Which other mix has a ratio of pretzels to raisins in the same proportional relationship as Gia’s mix?
- A
ADELE’S MIX
Snack Number in Bag Pretzels 6 Raisins 18 - B
CARL’S MIX
Snack Number in Bag Pretzels 15 Raisins 12 - C
ISABEL’S MIX
Snack Number in Bag Pretzels 18 Raisins 15 - D
TREVON’S MIX
Snack Number in Bag Pretzels 16 Raisins 12
Show the answer
Correct answer: D
The ratio of pretzels to raisins in Gia’s bag of snack mix, , is equivalent to the ratio of pretzels to raisins in Trevon’s bag, .
Question analysis
Gia's snack mix table lists how many pretzels and raisins are in her bag, and four friends' tables list theirs. Students pick the mix whose ratio of pretzels to raisins matches Gia's. It tests equivalent ratios and proportional relationships, and some mixes look close at a glance, so each ratio has to be tested exactly.
- Grade level
- Grade 7 content, by NYS standard
- Compared with grade 7
- At grade 7 Testing whether two ratios are equivalent is core grade 7 proportional reasoning. The numbers are small whole numbers in four short tables, so the work is routine, though every table has to be checked against Gia's.
- Estimated difficulty
- Straightforward: two steps or one careful reading.
- Thinking it demands
- Depth of knowledge 2, skills and concepts · mainly apply
- What makes it hard
- Solution
- 2 steps
- Reading level
- Question and choices: about grade 4, 77 words.
- Students, last 30 days
- Not enough answers yet to show (it takes 10).
Why it is hard, traps and wrong answers (shows the answer)
Why it is hard
A short ratio check made harder only by an additive pull: Carl's and Isabel's mixes keep the gap of 3 between pretzels and raisins that Gia's mix has, so students who compare differences instead of ratios see two matches. Reducing every table to lowest terms, Gia's 12:9 to 4:3, shows that exactly one mix keeps the ratio.
Every choice must be checked minor Choosing the answer
Each of the four tables has to be reduced in turn, to 1:3, 5:4, 6:5 and 4:3, because none of them can be ruled out at a glance. (Embretson & Wetzel, 1987)
Reading a figure, table or graph minor Understanding the question
The counts sit in five separate tables, and pretzels must stay first in every ratio, in the same order as Gia's 12 pretzels to 9 raisins. (Lesh, Post & Behr, 1987; Kirsch & Mosenthal, 1990)
Strategy: Simplify the pretzels-to-raisins ratio in Gia's table to lowest terms, then simplify each other mix's ratio in the same order and compare.
Traps
- Misunderstands the concept: A wrong belief about a concept: that percents can be added, that area grows like length, that averages can be averaged, that a bigger denominator means a bigger fraction.
The wrong answers, classified
A Misunderstands the concept (Smith, diSessa & Roschelle, 1993; De Bock et al., 1998; Ni & Zhou, 2005)
Halves Gia's 12 pretzels and doubles her 9 raisins, which keeps the product 108 the same but changes the ratio from 4:3 to 1:3.
B Misunderstands the concept (Smith, diSessa & Roschelle, 1993; De Bock et al., 1998; Ni & Zhou, 2005)
Adds 3 to both of Gia's counts, 12 + 3 and 9 + 3, keeping the difference of 3 instead of the ratio; 15:12 reduces to 5:4.
C Misunderstands the concept (Smith, diSessa & Roschelle, 1993; De Bock et al., 1998; Ni & Zhou, 2005)
Adds 6 to both counts, giving 18 and 15, so pretzels still outnumber raisins by 3, but 18:15 reduces to 6:5, not 4:3.
Worked solution, step by step
Formulas used
- Equivalent ratios
- a and b are the two amounts being compared, in order. k is any number that divides both evenly. Dividing both amounts by the same number keeps the ratio the same. When no number but 1 divides both, the ratio is in simplest form.
Sort out the question
A ratio compares two amounts. Gia’s mix has 12 pretzels and 9 raisins. So her ratio of pretzels to raisins is 12 : 9.
The “same proportional relationship” means the ratios are equal once you simplify them. For example, 2 : 1 and 6 : 3 are equal. Always keep pretzels first and raisins second.
Simplify Gia’s ratio
Both 12 and 9 can be divided by 3. So divide both by 3.
Gia’s mix has 4 pretzels for every 3 raisins.
Simplify each other mix
Do the same for each choice. Divide both numbers by the biggest number that goes into both.
Choice Pretzels : raisins Divide by Simplest form A, Adele 6 : 18 6 1 : 3 B, Carl 15 : 12 3 5 : 4 C, Isabel 18 : 15 3 6 : 5 D, Trevon 16 : 12 4 4 : 3 Pick the matching mix
Only Trevon’s mix simplifies to 4 : 3, the same as Gia’s.
Watch out: Carl’s and Isabel’s mixes each have 3 more pretzels than raisins, just like Gia’s. But adding the same number to both amounts changes the ratio. Equal ratios come from multiplying or dividing. That trap leads to choice B or C.
So the answer is D, Trevon’s mix.
Check your answer
Go the other way. Multiply both parts of 4 : 3 by 4. You get 16 : 12, which are Trevon’s exact numbers. You can also divide pretzels by raisins. Both and equal .
More questions like this
The original DOE question
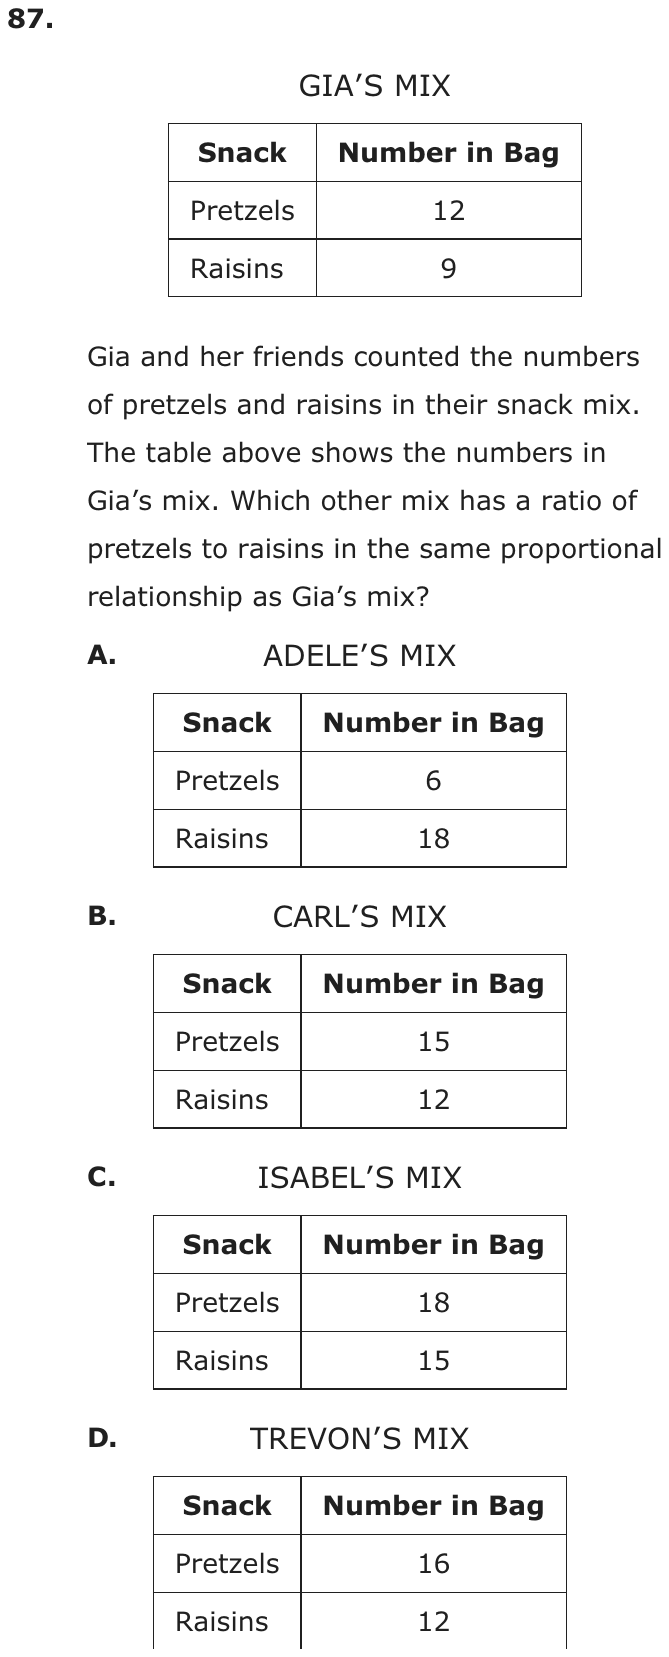
Question 21 of 35
2023 Test A Math, question 46Question
ESSAY LENGTH
| Number of Words | Number of Essays |
|---|---|
| <100 | 6 |
| 100–250 | 4 |
| 251–500 | 11 |
| >500 | 9 |
All 150 students in Grade 8 at a school are assigned to write an essay on the same topic. A teacher records the number of words in a random sample of the essays, as shown in the table above. Based on this sample, how many students in the entire grade would be expected to write essays with at least 100 words?
- A20
- B30
- C100
- D120
Show the answer
Correct answer: D
The number of students in the sample who wrote an essay with at least 100 words is 24 out of the 30 students. Write it as a fraction: . To predict the number of students in the entire grade who would write an essay with at least 100 words, find of 150, which is .
Question analysis
This statistics question gives a table of word counts for a random sample of Grade 8 essays and asks how many of all 150 students would be expected to write at least 100 words. Students find the sample size, the share meeting the condition, and scale it to the whole grade. Matching the words at least to the table's ranges is the tricky part.
- Grade level
- Grade 6 content, by NYS standard
- Compared with grade 7
- At grade 7 Using a random sample to predict a count for a whole population is typical grade 7 statistics and ratio work. Students total the sample from a table, read at least 100 against the table's ranges, and scale by a whole-number factor.
- Estimated difficulty
- Moderate: several steps, or a close reading with one strong distractor.
- Thinking it demands
- Depth of knowledge 2, skills and concepts · mainly apply
- What makes it hard
- Reading a figure, table or graph moderate
- Turning words into math minor
- Many steps minor
- Solution
- 3 steps
- Reading level
- Question and choices: about grade 6, 65 words.
- Students, last 30 days
- Not enough answers yet to show (it takes 10).
Why it is hard, traps and wrong answers (shows the answer)
Why it is hard
The proportion at the end is routine; the question is decided at the table. Students must turn “at least 100 words” into the right rows and also find the sample size, which is printed nowhere. Each listed wrong answer scales up a different group of rows, so a careless reading still produces a believable number. Noting that only 6 of 30 essays fall short, one fifth, gives a quick check.
Reading a figure, table or graph moderate Understanding the question
The table never prints the sample size; it has to be built by adding all four rows, 6 + 4 + 11 + 9 = 30, and the qualifying essays sit in three rows, not one. (Lesh, Post & Behr, 1987; Kirsch & Mosenthal, 1990)
Turning words into math minor Understanding the question
The bold “at least 100 words” must be matched to the rows 100–250, 251–500 and >500, keeping the row that begins at 100 and leaving out only the <100 row. (Hegarty, Mayer & Monk, 1995; Koedinger & Nathan, 2004)
Many steps minor Working it out
Four steps follow in order: the sample total, the qualifying count of 24, the fraction 24/30 = 4/5, and that fraction of all 150 students. (Daniel & Embretson, 2010; Enright, Morley & Sheehan, 2002)
Strategy: Add the table's counts to find the sample size, add the rows with 100 or more words, and scale that fraction of the sample up to all 150 students.
Traps
- Misreads the question: Misses or misreads a condition or a word in the question: "at least", "each", "remaining", "not".
- Answers a different question: A choice is right for another quantity: the other unknown, the rest instead of the part, the part instead of the whole.
The wrong answers, classified
A Misreads the question (Hegarty, Mayer & Monk, 1995)
Counts only the 100–250 row as at least 100 words, then scales its 4 essays up to the grade: 4/30 of 150 = 20.
B Answers a different question (King et al., 2004; Hegarty, Mayer & Monk, 1995)
Scales up the 6 essays with fewer than 100 words, 6/30 of 150 = 30, the very students the question leaves out.
C Misreads the question (Hegarty, Mayer & Monk, 1995)
Leaves out the 100–250 row, as if at least 100 meant more than 250, so it scales 11 + 9 = 20 essays up to 100.
Worked solution, step by step
Formulas used
- Predicting from a sample
- A sample is a smaller group picked at random from the whole group. The fraction of the sample with some feature is your best guess for the fraction of the whole group. So multiply that fraction by the size of the whole group.
Sort out the question
The table shows a random sample of the essays from a grade of 150 students. You need to predict how many of the 150 students wrote at least 100 words. At least 100 means 100 or more.
Find the sample size
The table doesn’t give the total, so add all four rows.
The sample has 30 essays.
Count the essays with enough words
Three rows count: 100–250, 251–500 and >500. Only the <100 row is left out.
Watch out: the 100–250 row counts, because 100 is at least 100. Leaving it out gives 100, choice C. Using the 6 short essays instead gives 30, choice B.
Scale up to the whole grade
About 4 out of every 5 students write at least 100 words. So the answer is D, 120 students.
Check your answer
The whole grade, 150, is 5 times the sample of 30. So multiply the sample count by 5: . The short essays scale to , and 120 + 30 = 150, the whole grade.
More questions like this
The original DOE question
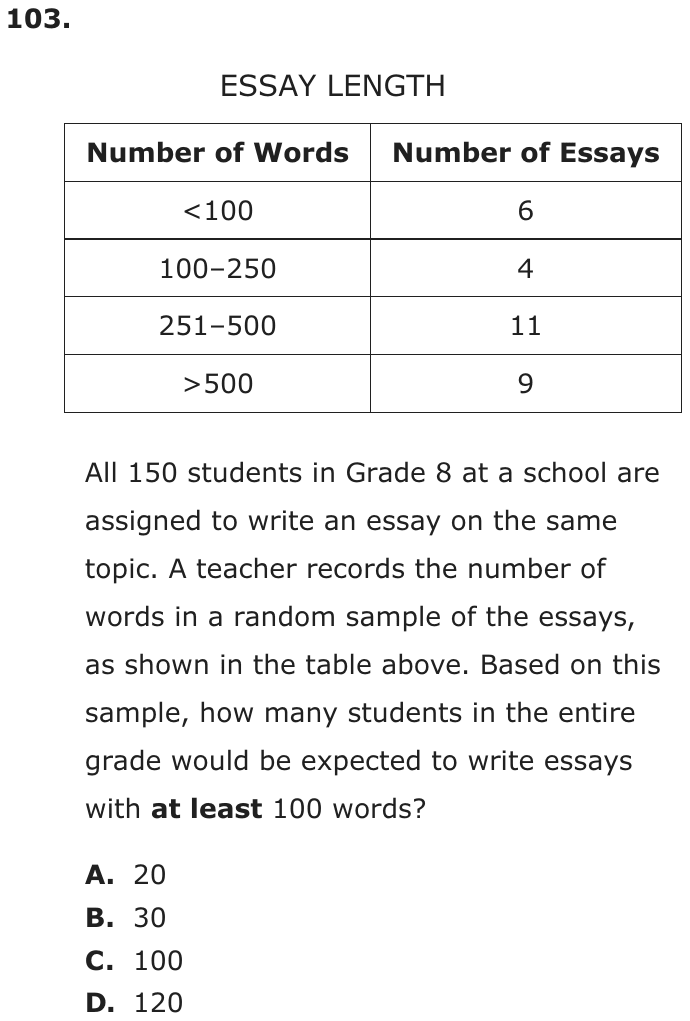
Question 22 of 35
2023 Test B English, question 17Passage Excerpt from “The Food Business Incubator”
Excerpt from “The Food Business Incubator”
by Mandalit Del Barco
“La Cocina” means “the kitchen” in Spanish. It’s also the name of a business incubator1 based in San Francisco’s Mission District. Since it began in 2005, it’s been helping local food entrepreneurs, many of whom are low-income immigrant women, develop their small businesses.
Over the years, many of its alumni have found success: more than 50 chefs in its program have become self-sufficient business owners, and many of them have opened their own brick-and-mortar restaurants. Two alumnae of its culinary program . . . were even recognized as semi-finalists for prestigious James Beard awards.2
A new cookbook, We Are La Cocina: Recipes in Pursuit of the American Dream, tells some of their stories.
Executive director Caleb Zigas says the nonprofit La Cocina grew out of two grassroots economic development organizations3 who found many people cooking at their homes and selling food on the streets. The vendors needed an affordable commercial kitchen space and technical assistance in order for their businesses to be legally viable. La Cocina provided just such a space, in addition to helping them develop business plans, pull city permits and more.
Zigas says as many as eight businesses can work in the kitchen space at La Cocina at any one time. Some can prep for a farmers’ market sale, corporate catering gigs or weddings, while others might be making and packaging their food products.
“It’s just an incredible and exciting range of techniques, flavors, perspectives, age, language. And that’s a really beautiful thing,” he says. . . .
Twice a year, La Cocina hosts “F&B: Voices from the Kitchen,” a storytelling project where their chefs can tell their own stories, as they do in the new cookbook. Some of the chefs will be on tour to promote the book, whose proceeds will go to support La Cocina entrepreneurs.
NPR4 caught up with . . . La Cocina chefs, who shared their stories:
Mariko Grady, Aedan Fermented Foods
At La Cocina, you can often hear Mariko Grady singing or humming as she prepares miso, koji, and amasake. Her fermented products come in four different flavors, including mushroom and chicken, to be used in soups and sauces. She originally brought the fermenting rice and barley koji seeds from Japan, where she had a 30-year career as a singer and dancer with the prestigious modern theatrical dance group she founded, Pappa Tarahumara. They performed around the world, and 16 years ago, had a one-night show in San Francisco. The man who would become her husband was in the audience. She soon joined him in San Francisco, often returning to Tokyo to rehearse. But after the earthquake and tsunami hit Japan in 2011, her company disbanded. . . . Grady focused on nourishing her family and creating a line of fermented products that she sells online, at local Bay Area stores and at the Ferry Plaza Farmers Market. She began at La Cocina in 2012 and named her business after her son, Aedan. (Written in Kanji characters, the name means “wisdom” and “handed down from generation to generation.”) . . . Her fermented products are “also full of wisdom about how to relate to nature and how to create a healthy life,” she says. . . .
Shani Jones, Peaches Patties
Shani Jones is a native San Franciscan. Her father was born in New Orleans, her mother, in Jamaica. She says their home was always filled with a variety of spices and dishes like jerk chicken and Jamaican patties—savory pastries filled with beef or chicken. Jones says she learned to cook from her mother, whose nickname was Peaches. After returning from college in Atlanta, Jones worked on her doctorate in organizational leadership and management while driving a Lyft5 car. She often told passengers about her idea of opening a catering company with her mom’s recipes. They steered her to La Cocina, where she developed her own business, named after her mother. Five years later, she caters and runs a kiosk6 at a small food cooperative in Bernal Heights, where some of her handmade patties have an Ethiopian twist, “because my husband is Ethiopian.” Jones has big aspirations for Peaches Patties: “The ultimate goal,” she says, “is to be the patty kingpin7 of the West Coast.”
From “The Food Business Incubator That Helps Immigrant Women Pursue The American Dream” by Mandalit Del Barco from WEEKEND EDITION SUNDAY, June 19, 2019. Copyright © 2019 NPR.
QUALIFICATIONS FOR LA COCINA APPLICANTS
| Level of Income | La Cocina considers assets and access to opportunity when screening applicants. La Cocina’s mission is to support entrepreneurs who face barriers to becoming successful in the food industry. Applicants must be classified as low- or very-low-income earners according to the Housing and Urban Development (HUD) Guidelines for San Francisco. |
|---|---|
| Business Plan | Applicants must have a business plan that is ready to be put into action. La Cocina will help applicants refine an existing business plan. Applicants without a business plan should contact one of La Cocina’s partner organizations for guidance in developing one. |
| Viable Product | The applicant’s food must not only be delicious but also stand out. For a business to make a profit, there also has to be a market for the food. |
| Entrepreneurial Work Ethic | La Cocina is excited to work with entrepreneurs who are motivated and passionate about growing their business. Succeeding in the food industry requires a lot of heart and hard work. |
| Community Spirit | The 30+ entrepreneurs who share La Cocina’s kitchen are from many different backgrounds. La Cocina values the community it has created and expects each entrepreneur to be active in bringing the spirit of La Cocina to the wider world. In order to succeed in the La Cocina kitchen, accepted applicants must be flexible and willing to work closely with others. |
Source: La Cocina
1business incubator: company that helps new and startup companies develop by providing services such as management training and office space
2James Beard awards: an award named after American cook and author James Beard, considered one of the highest honors in the culinary industry
3economic development organizations: organizations whose mission is to promote economic improvement within a specific geographical area
4NPR: National Public Radio, a nonprofit media organization that produces and distributes news and cultural programming
5Lyft: ride-sharing company where people use their own cars to provide rides to customers
6kiosk: cart or small structure with one or more open sides that is used to vend merchandise or services
7kingpin: the leader in a group or undertaking
Question
The table provides additional support for a central idea of the excerpt by
- Ashowing how La Cocina works with partner organizations to further educate and advance successful applicants within the food industry.
- Bexplaining how applicants are prepared to develop their own businesses once they leave La Cocina.
- Cestablishing that La Cocina is dedicated to its mission to provide delicious food to different communities.
- Demphasizing that applicants must be willing to dedicate time to promoting and developing their business with La Cocina.
Show the answer
Correct answer: D
The question asks how the table provides additional support for a central idea of the excerpt.
A. Incorrect. The table describes the requirements that allow food entrepreneurs to qualify to participate in La Cocina. While the table does mention that applicants without a business plan should contact one of La Cocina’s partner organizations, it does not specifically explain how La Cocina works with these partner organizations to help educate successful applicants.
B. Incorrect. The table describes the ways entrepreneur chefs must qualify in order to be accepted into La Cocina, not how their businesses can be successful after they leave.
C. Incorrect. While the table mentions community spirit, this is in reference to the type of energy La Cocina wishes to establish within its group kitchen space. The excerpt and table do not discuss providing food to different communities within or outside San Francisco as specific goals of La Cocina.
D. CORRECT. A central idea of the excerpt is that La Cocina helps local food entrepreneurs develop their businesses. The table lists requirements for people who want to participate in La Cocina. They must be willing to work hard to promote their own businesses as they use the resources that La Cocina provides.
Question analysis
This question asks how the table “Qualifications for La Cocina Applicants,” printed after the NPR article, provides additional support for a central idea of the excerpt. The table’s five rows, from level of income to community spirit, are written in full sentences, so students must read it as closely as the article and decide how the two connect.
- Grade level
- Grade 8 reading and task
- Compared with grade 7
- Above grade 7 Grade 7 readers often connect a table to a text. This one holds five rows of requirements written as sentences, not numbers, and students must tie it to a central idea through long choices, more than typical grade 7 work.
- Estimated difficulty
- Hard: combines ideas, needs a plan, and has more than one tempting wrong answer.
- Thinking it demands
- Depth of knowledge 3, strategic thinking · mainly analyze
- What makes it hard
- Reading a figure, table or graph moderate
- The right answer is reworded moderate
- Combines ideas minor
- Evidence
- Answered from the whole text
- Reading level
- Passage: about grade 10, 1057 words; question and choices: about grade 13, 81 words.
- Corrected from the DOE handbook
- A detail of the table was restated accurately in the explanation.
- Students, last 30 days
- Not enough answers yet to show (it takes 10).
Why it is hard, traps and wrong answers (shows the answer)
Why it is hard
The table is easy to read row by row but hard to connect, because it lists entry requirements while the article describes help and success. Each wrong choice grabs a real phrase from the table or an idea from the article, partner organizations, delicious food, alumni starting their own businesses, and attaches it to a claim the table does not make. The right choice is the only one that sums up several rows at once, the work ethic and community spirit expected of applicants.
Reading a figure, table or graph moderate Understanding the question
The table holds five rows of full sentences, and the telling details sit in single phrases: “should contact one of La Cocina’s partner organizations,” “a lot of heart and hard work,” “active in bringing the spirit of La Cocina to the wider world.” (Lesh, Post & Behr, 1987; Kirsch & Mosenthal, 1990)
The right answer is reworded moderate Choosing the answer
The right choice speaks of dedicating time to “promoting and developing” a business, words the table never uses, while wrong choices lift its own “partner organizations,” “mission,” “delicious” and “community.” (Freedle & Kostin, 1993; Kirsch & Mosenthal, 1990)
Combines ideas minor Working it out
Students must join two sources, a central idea of the article, that La Cocina helps cooks develop businesses, and a table about who may apply, then say what the second adds to the first. (Embretson, 1998; Daniel & Embretson, 2010)
Strategy: Sum up each row of the table in a few words, state a central idea of the article in a sentence, and keep only a choice that the rows actually show and that fits that idea.
Traps
- Word match: Repeats striking words or phrases from the text, so it looks supported, but its meaning does not fit the question.
- Twists what the text says: Uses the text's topic and ideas but changes what it says: who did it, how much, when, or why.
- Wrong part of the text: A choice is true of another paragraph, stanza or speaker than the one asked about.
The wrong answers, classified
A Twists what the text says (King et al., 2004)
Finds the partner organizations in the Business Plan row, but the table sends only applicants without a plan to them for guidance and says nothing about further training for accepted chefs.
B Wrong part of the text (Kirsch & Mosenthal, 1990)
Carries over the article’s alumni who opened their own restaurants and its help with permits, but the table covers who may enter La Cocina, not how members are prepared to leave.
C Word match (Freedle & Kostin, 1993)
Strings the table’s words “mission,” “delicious” and “community” into a mission of feeding communities, though the table’s community is the one La Cocina has built among the entrepreneurs sharing its kitchen.
What was corrected from the DOE handbook, and why
- Explanation: The handbook’s explanation of Option A says the table states that applicants without a business plan “must contact” one of La Cocina’s partner organizations. The table’s Business Plan row says they “should contact” one: it is advice, while the row’s requirement is that applicants “must have a business plan that is ready to be put into action.” The site now says “should contact.” The answer is unchanged.
Working it out, step by step
See how the table connects
This question links the table to the article. The table, “Qualifications for La Cocina Applicants,” lists what people need to join. Qualifications are the skills or traits you must have. You must decide how the table supports a central idea of the article.
Sum up each row
Row What it asks of applicants Level of Income earn little money Business Plan have a plan ready to use Viable Product make food that tastes great, stands out and can sell Entrepreneurial Work Ethic be eager and work hard Community Spirit work well with others and spread La Cocina’s spirit Most rows describe people ready to put in real effort.
Connect the table to the article
A central idea of the article is that La Cocina helps cooks develop their businesses. The table shows what La Cocina expects in return. It wants people “motivated and passionate about growing their business.” It says success “requires a lot of heart and hard work.” It expects each cook to be “active in bringing the spirit of La Cocina to the wider world.” So the help goes to people who will give time to their business.
Check each choice
- A is wrong. The table says applicants without a plan “should contact” a partner group for advice. That happens before applying. It doesn’t show La Cocina working with partners to train accepted cooks.
- B is wrong. The table is about getting in, not about leaving La Cocina later.
- C is wrong. The table uses the words “delicious” and “community.” But its community is the cooks who share the kitchen, not neighborhoods La Cocina feeds.
- D is right. The work-ethic row calls for hard work at growing a business. The community row asks cooks to spread La Cocina’s spirit. Both take time and effort.
Choose the answer
The table shows that La Cocina wants cooks ready to work hard at building their businesses. So the answer is D.
Why this answer and not the closest wrong one
A is the closest wrong answer, because “partner organizations” really is in the table. But the table only suggests that people without a business plan get advice from one. It never shows La Cocina teaming up with partners to train its members. D sums up several rows at once.
More questions like this
The original DOE question
The passage “Excerpt from “The Food Business Incubator”” as printed (pages 158–160)
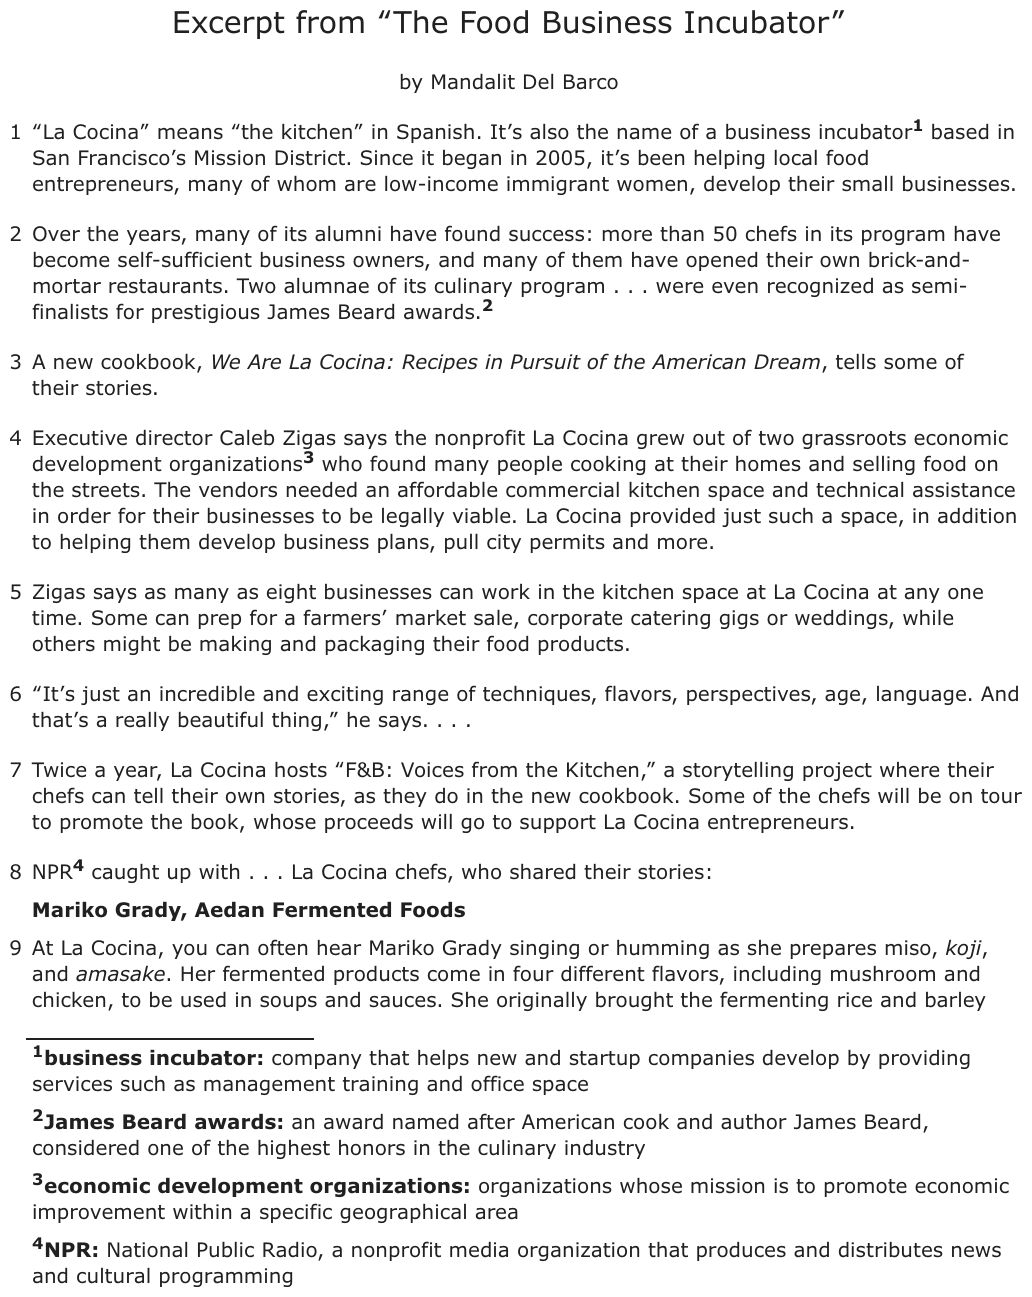
Question 23 of 35
2023 Test B Math, question 1Question
LAST YEAR’S TOTAL SALES
| Vehicles | Number |
|---|---|
| Four-door cars | 5,850 |
| Two-door cars | 2,250 |
| Trucks | 900 |
| Total | 9,000 |
The table above shows the number of each type of vehicle sold at a dealership last year. If 1,000 vehicles will be sold next month, what is the best estimate (based on last year’s sales) of the number of two-door cars that will be sold?
Grid-in question: work out the answer and enter it as a number.
Show the answer
Correct answer: 250
Let x represent the number of two-door cars that will be sold next month. Use the information in the table to set up a proportion:
Question analysis
A table shows last year's sales at a car dealership: four-door cars, two-door cars and trucks, 9,000 vehicles in all. This grid-in asks for the best estimate of how many two-door cars will be sold next month if 1,000 vehicles are sold. Students set up a proportion from the table; most of its rows are not needed.
- Grade level
- Grade 6 content, by NYS standard
- Compared with grade 7
- Below grade 7 Grade 7 proportion problems often take several steps or awkward numbers. This one scales a single share from a table to a new total, with numbers that divide cleanly, which is closer to grade 6 ratio work.
- Estimated difficulty
- Straightforward: two steps or one careful reading.
- Thinking it demands
- Depth of knowledge 2, skills and concepts · mainly apply
- What makes it hard
- Solution
- 2 steps
- Reading level
- Question and choices: about grade 4, 55 words.
- Students, last 30 days
- Not enough answers yet to show (it takes 10).
Why it is hard, traps and wrong answers (shows the answer)
Why it is hard
Once the share is seen as 2,250 out of 9,000, a quarter, the arithmetic is light, which makes this one of the easier grid-ins. Points are lost by entering the share itself as a percent, by reading the wrong row of the table, or by building a monthly average when the question supplies next month’s total. With no choices to compare, checking that the entry is a quarter of 1,000 is the only safeguard.
Turning words into math minor Understanding the question
The phrase “best estimate (based on last year’s sales)” has to become a proportion: two-door cars keep the same share of next month’s 1,000 vehicles as of last year’s 9,000. (Hegarty, Mayer & Monk, 1995; Koedinger & Nathan, 2004)
Reading a figure, table or graph minor Understanding the question
The table lists three vehicle types and a total; only the two-door row, 2,250, and the 9,000 total are needed, so the four-door and truck rows are distractions. (Lesh, Post & Behr, 1987; Kirsch & Mosenthal, 1990)
Strategy: Find what fraction of last year's 9,000 vehicles were two-door cars, simplify it, then take that fraction of the 1,000 vehicles expected next month.
Traps
- Stops one step early: A choice is a number from partway through the solution.
- Information you don't need: The question gives numbers or facts that play no part in the answer.
The wrong answers, classified
25 Stops one step early (King et al., 2004; Gierl et al., 2017)
Finds that 2,250 of 9,000 sales is 25 percent and enters that percent, stopping before taking a quarter of next month’s 1,000 vehicles.
650 Misreads the figure (Lesh, Post & Behr, 1987; Kirsch & Mosenthal, 1990)
Reads the four-door row instead of the two-door row and scales it correctly: 5,850 of 9,000 is 650 of 1,000.
187.5 Misreads the question (Hegarty, Mayer & Monk, 1995)
Divides last year’s 2,250 two-door sales by 12 months, a monthly average that ignores the stated 1,000 vehicles for next month.
Worked solution, step by step
Formulas used
- Proportion
- A proportion says two fractions are equal. Each fraction here is a part over its whole: two-door cars over all vehicles sold. Use it when a share stays the same while the total changes. Then you can find the missing part.
Sort out the question
The table shows last year’s sales. In all, 9,000 vehicles were sold, and 2,250 of them were two-door cars. Next month, 1,000 vehicles will be sold. You need about how many of them will be two-door cars.
“Based on last year’s sales” means two-door cars keep the same share of all sales. A share is a part out of a whole. The four-door and truck rows don’t matter here.
Find last year’s share of two-door cars
Last year, 2,250 out of 9,000 vehicles were two-door cars. Write that as a fraction and simplify it.
This works because . So 1 out of every 4 vehicles sold was a two-door car.
Set up the proportion and solve
Let x be the number of two-door cars next month. Next month’s share must match last year’s share.
To get x alone, multiply both sides by 1,000.
So about 250 two-door cars will be sold.
Give the answer
Watch out: one fourth is the same as 25%. Gridding 25 gives the percent, not the number of cars. Also be sure to use the two-door row. The four-door row would give 650. So you would grid 250.
Check your answer
Try it another way. Next month’s 1,000 vehicles are of last year’s 9,000. So take of the 2,250 two-door cars: . Both ways give 250 cars.
More questions like this
The original DOE question
Question 24 of 35
2023 Test B Math, question 23Question
FRUIT SOLD
AT STORE XYZ
| Fruit | Number Sold |
|---|---|
| Apples | 8 |
| Bananas | 6 |
| Cherries | 12 |
| Oranges | 6 |
| Peaches | ? |
| Total | 50 |
Peaches made up what percentage of the total number of pieces of fruit sold at Store XYZ, according to the table above?
- A18%
- B28%
- C36%
- D64%
Show the answer
Correct answer: C
First, find the number of peaches sold:
Then, find the percentage:
Question analysis
A table lists the fruit sold at Store XYZ, apples, bananas, cherries and oranges, with the number of peaches shown as a question mark and a total of 50. Students find what percentage of the fruit sold were peaches. They first work out the missing count, then turn it into a percent of the total.
- NYS standards
- 6.RP.3c percent as a rate per 100
- Grade level
- Grade 6 content, by NYS standard
- Compared with grade 7
- Below grade 7 Finding a missing value and writing a part as a percent of a whole are grade 6 skills. With a total of 50, the percent step is quick, so the task is lighter than typical grade 7 percent problems.
- Estimated difficulty
- Straightforward: two steps or one careful reading.
- Thinking it demands
- Depth of knowledge 2, skills and concepts · mainly apply
- What makes it hard
- Reading a figure, table or graph minor
- Many steps minor
- Solution
- 3 steps
- Reading level
- Question and choices: about grade 4, 34 words.
- Students, last 30 days
- Not enough answers yet to show (it takes 10).
Why it is hard, traps and wrong answers (shows the answer)
Why it is hard
The total of 50 makes the percent step easy, since each piece of fruit is 2 percent, but the question first hides the count it needs. Students who find the 18 peaches and stop, or who give the share of the four listed fruits, reach listed choices. Checking that the peaches’ percent and the other fruits’ percent add to 100 confirms the answer.
Reading a figure, table or graph minor Understanding the question
The table gives four counts, a question mark for peaches and a total of 50, so the missing count must be found by subtraction before any percent. (Lesh, Post & Behr, 1987; Kirsch & Mosenthal, 1990)
Many steps minor Working it out
Adding 8, 6, 12 and 6, subtracting from 50, and turning 18 out of 50 into a percent are three steps, and the count of 18 is itself a listed percent. (Daniel & Embretson, 2010; Enright, Morley & Sheehan, 2002)
Strategy: Add the four known counts, subtract from 50 to get the peaches, then double that count, since each piece out of 50 is 2 percent.
Traps
- Stops one step early: A choice is a number from partway through the solution.
- Answers a different question: A choice is right for another quantity: the other unknown, the rest instead of the part, the part instead of the whole.
The wrong answers, classified
A Stops one step early (King et al., 2004; Gierl et al., 2017)
Finds the 18 peaches but gives that count as the percent, forgetting to compare it with the total of 50 pieces.
B Little reason to choose it (Haladyna & Downing, 1993; Rodriguez, 2005)
No common working gives 28%, which would need 14 peaches; it takes a slip such as 36 for 8 + 6 + 12 + 6, so it mostly draws guesses.
D Answers a different question (King et al., 2004; Hegarty, Mayer & Monk, 1995)
Finds the share of the other four fruits, 32 of 50 or 64 percent, instead of the share of the peaches.
Worked solution, step by step
Formulas used
- Percent of a total
- The part is the amount you are asking about, here the peaches. The whole is the total, here all 50 pieces of fruit. Dividing gives the fraction of the whole. Multiplying by 100 turns it into a percent, which means out of 100.
Sort out the question
The table shows how many of each fruit Store XYZ sold. The number of peaches is missing, shown by a question mark. The total is 50 pieces of fruit. You need the percent of the total that were peaches.
Add the fruits you know
Apples, bananas, cherries and oranges add up to 32 pieces of fruit. That is every fruit except the peaches.
Find the number of peaches
The peaches are whatever is left of the 50.
So 18 peaches were sold. Watch out: 18 is a count, not a percent. Choosing 18% is choice A.
Turn the count into a percent
Peaches were 36% of the fruit sold. Watch out: 32 out of 50 is 64%, choice D. That is the other four fruits, not the peaches. So the answer is C, 36%.
Check your answer
Out of 50 pieces, each piece is 2% of the total, because . So 18 peaches are percent. Also, 36% for peaches plus 64% for the rest makes 100%.
More questions like this
The original DOE question
Question 25 of 35
2023 Test B Math, question 30Question
PRICE OF A USED VIDEO GAME AT VARIOUS STORES
| Price of Used Video Game | Number of Stores |
|---|---|
| $10.99 | 5 |
| $11.99 | 2 |
| $12.99 | 1 |
| $13.99 | 4 |
The table above shows the price of a certain used video game at 12 different stores. What is the median price of this video game?
- A$10.99
- B$11.49
- C$11.99
- D$12.32
Show the answer
Correct answer: C
There are 5 stores where the video game is priced at $10.99 and a total of 5 stores where it is priced at either $12.99 or $13.99, so the median price must be $11.99.
Question analysis
A statistics question with a table showing the price of a used video game at 12 stores, grouped by price, and asking for the median price. Students put the prices in order using the number of stores at each price and find the middle. The table gives counts rather than a list, so the position of the middle value has to be worked out from the running totals.
- Grade level
- Grade 6 content, by NYS standard
- Compared with grade 7
- At grade 7 Finding a median is grade 6 work that grade 7 students meet often. The twist is the frequency table: the 12 prices are not listed one by one, so students count positions instead of reading down a list.
- Estimated difficulty
- Straightforward: two steps or one careful reading.
- Thinking it demands
- Depth of knowledge 2, skills and concepts · mainly apply
- What makes it hard
- Solution
- 2 steps
- Reading level
- Question and choices: about grade 4, 40 words.
- Students, last 30 days
- Not enough answers yet to show (it takes 10).
Why it is hard, traps and wrong answers (shows the answer)
Why it is hard
The arithmetic is trivial once the positions are found: counting down 5 stores at $10.99 and then 2 at $11.99 puts both the 6th and 7th prices at $11.99. The wrong choices reward three different misreadings of a frequency table: the most common price, a middle pair one place too early, and the mean, which takes a long computation to reach. A student who writes the running totals 5, 7, 8 and 12 beside the table avoids all three.
Reading a figure, table or graph moderate Understanding the question
The 12 prices are never listed; the table gives four prices with store counts of 5, 2, 1 and 4, so the 6th and 7th prices must be found by a running count. (Lesh, Post & Behr, 1987; Kirsch & Mosenthal, 1990)
Something you must already know minor Working it out
With 12 values the median is the mean of the 6th and 7th in order, a rule the question assumes; here both fall in the $11.99 row, so no averaging is needed. (Anderson & Krathwohl, 2001)
Strategy: Keep a running total of the store counts down the table; with 12 prices in order, the median is the average of the 6th and 7th, so find the rows where they fall.
Traps
- Answers a different question: A choice is right for another quantity: the other unknown, the rest instead of the part, the part instead of the whole.
- Counting the ends: Inclusive or exclusive ends, fence posts, consecutive numbers: an answer that is one too many or too few, or an endpoint drawn open where it belongs closed (or the reverse).
The wrong answers, classified
A Answers a different question (King et al., 2004; Hegarty, Mayer & Monk, 1995)
Gives the mode, $10.99, the price that 5 stores charge, more than any other, instead of the middle price of the 12.
B Counting the ends (Brown & Burton, 1978)
Knows to average two middle prices but takes the 5th and 6th instead of the 6th and 7th, averaging $10.99 and $11.99 to get $11.49.
D Answers a different question (King et al., 2004; Hegarty, Mayer & Monk, 1995)
Computes the mean instead, $147.88 for all 12 prices divided by 12, about $12.32, a different measure of center from the median asked for.
Worked solution, step by step
Formulas used
- Median of an even number of values
- The median is the middle value when all the values are listed from least to greatest. With an even number of values, no single value sits in the middle. So take the two middle values and find their average: add them and divide by 2.
Sort out the table
Each row gives a price and how many stores charge it. For example, 5 stores charge $10.99. So $10.99 shows up 5 times in the list of prices. Add the stores to check the count.
There are 12 prices. You need the median. That is the middle price when the prices are in order from least to greatest.
Find the middle places
12 is an even number, so no single price sits in the middle. The two middle prices are the 6th and the 7th. Five prices come before the 6th one. Five prices come after the 7th one.
Count down the table
The table already lists the prices from least to greatest. Keep a running total of the stores. It shows which places in the list each price fills.
Price Stores Places in the list $10.99 5 1st to 5th $11.99 2 6th and 7th $12.99 1 8th $13.99 4 9th to 12th The 6th and 7th prices are both $11.99.
Find the median
Use the formula with the 6th and 7th prices.
The median price is $11.99.
Watch out: $10.99 is the mode, the price that shows up most often. That is choice A, not the median. Averaging the 5th and 6th prices gives $11.49, choice B. Adding all 12 prices and dividing by 12 gives the mean, about $12.32. That is choice D.
So the answer is C, $11.99.
Check your answer
Count the prices on each side of $11.99. Five stores charge less: the five at $10.99. Five stores charge more: one at $12.99 and four at $13.99. The two sides match, so $11.99 is in the middle.
More questions like this
The original DOE question
Question 26 of 35
2018 Test A English, question 25Passage Champion of the Channel
Champion of the Channel
In 1926 an editor at the London Daily News predicted that Gertrude Ederle, an American swimmer with eighteen world records and three Olympic medals, would fail in her attempt to swim across the English Channel. He claimed that “even the most uncompromising champion of the rights and capacities of women must admit that in contests of physical skill, speed and endurance they must remain forever the weaker sex.” Yet, at only nineteen years old, Ederle not only became the first woman to accomplish this feat, she also broke the men’s record by two hours. Gertrude Ederle’s triumphant swim across the English Channel was a testimony to her determination, innovative spirit, and passion for swimming.
Crossing the English Channel is a daunting task for any swimmer. At its narrowest point, the channel measures twenty-one miles across. Its icy waters hover around sixty degrees Fahrenheit, and its unruly tides and currents toss swimmers about like bobbing corks. Stinging jellyfish, seaweed, and floating debris from shipwrecks and lost cargoes present added hazards.
For decades the channel’s perils have defeated countless swimmers. Ederle, too, failed in her first attempt to cross the channel in 1925. Just six miles short of finishing, she became ill, and her coach had to haul her out of the water. Undeterred, Ederle decided to try again. Ederle knew that if she did not complete the challenge this time, she might never get the opportunity to set this record, because a rival female swimmer was preparing to make her second attempt at the crossing as well.
To prepare for the marathon swim, Ederle found ways to improve her equipment. She and her sister Meg discovered that melted candle wax perfectly sealed goggle edges, effectively waterproofing Ederle’s goggles against hammering waves. The sisters also designed a two-piece silk swimsuit for Ederle. During her first channel-crossing attempt she had worn a standard one-piece swimsuit that, after the lengthy hours of swimming across the channel, had stretched out, filling with water and creating drag, making an already challenging task almost insurmountable. Unlike the cumbersome typical bathing suit, this silk invention weighed little and allowed for easy movement.
On August 6, 1926, Ederle waded into the channel near Cape Gris-Nez, France. At first she shivered in the bone-chilling water even though she had covered her body in eight layers of grease for insulation. Her limbs felt stiff. Her strokes were irregular. Driving forward, she fought to clear her mind and find what she called her “sphere,” a place where the sea became her only companion and the shrieks of gulls and the humming of boat engines faded away. Using a new overhand stroke called the American crawl, Ederle eventually settled into a steady pace, briskly breaking through waves.
Throughout Ederle’s swim, two tugboats accompanied her. One carried newspaper reporters who wired dispatches of her progress to shore. The other, displaying a sign that read “This way, ole kid!” with an arrow pointing forward, transported her coach, family, and friends. Her coach played songs, such as “Yes, We Have No Bananas,” on a phonograph so that Ederle could time her strokes to the rhythm. Using a net, her coach also passed her baby bottles of broth for nourishment.
For hours Ederle swam, dodging debris with an amused smile. However, as she neared the English shore, a sudden fierce storm erupted. The tides and waves forced Ederle backward, and she fought the stubborn swells for several hours. The salty water caused her tongue to swell and inflamed her ears. Yet Ederle felt indescribably happy as she churned through the sea. Finally, as she neared the English shore, the storm abated, and the tide turned. No longer fighting against her, the sea pushed her toward the shore and victory.
After fourteen hours and thirty-one minutes, Ederle, on wobbly legs, stepped onto the English shore. The waiting crowd roared, honked their automobile horns, blasted their tugboat whistles, and set off flares that flashed in the sky. Ederle had swum into history.
When Ederle returned to New York, she received a parade, where thousands of people shouted “Trudy!” Not only were everyday American citizens proud of Ederle, but she also inspired them to be more active. Over the next few years, more than 60,000 people credited her with motivating them to earn their American Red Cross swimming certificates. Gertrude Ederle’s accomplishment proved to the world that with determination and passion, it was possible for a person to achieve his or her goals.
SOLO SWIMS ACROSS THE ENGLISH CHANNEL
|
Earliest Speed Records |
||
| Year | Swimmer | Time |
| 1875 | Matthew Webb (M) | 21 hours, 45 minutes |
| 1923 | Enrico Tiraboschi (M) | 16 hours, 33 minutes |
| 1926 | Gertrude Ederle (F) | 14 hours, 31 minutes |
| 1926 | Arnst Vierkotter (M) | 12 hours, 38 minutes |
| Current Speed Records | ||
| Year | Swimmer | Time |
| 2012 | Trent Grimsey (M) | 6 hours, 55 minutes |
| 2006 | Yvetta Hlavacova (F) | 7 hours, 25 minutes |
Question
The table contributes to the development of the topic of the passage mainly by
- Aemphasizing that people have continued to swim across the channel and have significantly reduced the speed record.
- Bsuggesting that Ederle inspired women to swim across the channel in an attempt to break the current speed record.
- Crevealing that Ederle is not the only woman who has set a record time for swimming across the English Channel.
- Dproviding a comparison between channel-swimming records of the early twentieth century and current records.
Show the answer
Correct answer: A
The answer is (A)
The question asks for an explanation of how the table at the end of the passage contributes to the development of the topic of the passage. The table provides information about the earliest speed records set for crossing the channel, including Ederle’s, and information about present-day records, which are much faster.
Option A is correct because the information in the table develops the topic of Ederle’s historic swim across the channel by indicating that people have continued to swim the channel and have found new ways to set speed records over time.
Option B is incorrect because, even though the table presents the time for the current female record holder, there is no indication in the passage or in the table that the record holder was inspired by Ederle.
Option C is incorrect because, although the table shows that another woman, Yvetta Hlavacova, set a record time, the passage itself does not discuss other female swimmers’ successful swims across the channel, so this detail is not the main way the table develops the topic.
Option D is incorrect because, although the table allows for the comparison of times, the topic of the passage is related to Ederle’s record in comparison with other swimmers of her time, not present-day swimmers.
Question analysis
This reading question asks how the table of English Channel swim records at the end of the Gertrude Ederle passage contributes to the topic. Students must read times from two eras, compare them, and decide what the table mainly adds, which is harder than it looks because several choices say something true about the table.
- Grade level
- Grade 8 reading and task
- Compared with grade 7
- Above grade 7 Explaining how a table adds to a passage goes beyond typical grade 7 reading questions: the student must compare times across eras, notice who set them, and choose among statements several of which are partly true of the table.
- Estimated difficulty
- Hard: combines ideas, needs a plan, and has more than one tempting wrong answer.
- Thinking it demands
- Depth of knowledge 3, strategic thinking · mainly analyze
- What makes it hard
- A very close wrong answer major
- Reading a figure, table or graph moderate
- How, not what moderate
- Evidence
- Answered from the whole text
- Reading level
- Passage: about grade 9, 790 words; question and choices: about grade 11, 84 words.
- Corrected from the DOE handbook
- An inaccurate statement in the explanation was corrected.
- Students, last 30 days
- Not enough answers yet to show (it takes 10).
Why it is hard, traps and wrong answers (shows the answer)
Why it is hard
Every choice says something about the table, and two are literally true of it, so the question hinges on the word “mainly”. Students lose the point by describing what the table holds, a comparison or a second woman, instead of what the comparison shows: the record has kept falling since Ederle's day. Reading the times, not just the headings, makes that drop visible.
A very close wrong answer major Choosing the answer
The right choice and the comparison one cover the same contrast between old and current records; the right one states its result, a much faster record, while the other only names the comparison and its “early twentieth century” leaves out 1875. (Embretson & Wetzel, 1987; Gorin & Embretson, 2006; Ascalon et al., 2007)
Reading a figure, table or graph moderate Understanding the question
The table splits records into earliest and current sets, and the student must compare times across them, from 21 hours 45 minutes in 1875 down to 6 hours 55 minutes in 2012. (Lesh, Post & Behr, 1987; Kirsch & Mosenthal, 1990)
How, not what moderate Working it out
The question asks how the table develops the passage's topic, so the student must say what it adds beyond the text, not just what it lists. (Anderson & Krathwohl, 2001)
Strategy: Read the table's headings and compare the times, then ask what a reader learns from it that the passage alone does not say, and pick the choice that names that.
Traps
- Wrong purpose or structure: Names a purpose, structure or effect that the part does not serve, or describes what a part says when the question asks what it does.
- Too narrow: A single detail offered as the central idea or a summary, or a summary that keeps minor details and leaves out an essential part.
- Reads too much in: A reasonable-sounding conclusion that goes further than the text allows.
The wrong answers, classified
B Reads too much in (Graesser, Singer & Trabasso, 1994)
Assumes Ederle inspired later women to chase the record, but neither the table nor the passage connects Yvetta Hlavacova or any other swimmer to her.
C Too narrow (King et al., 2004)
Notices Yvetta Hlavacova, a second woman among the record holders, which is true of the table but is one entry, not its main contribution.
D Wrong purpose or structure (Anderson & Krathwohl, 2001)
Describes what the table contains, early and current records side by side, rather than what that comparison adds, and its “early twentieth century” leaves out Webb's 1875 swim.
What was corrected from the DOE handbook, and why
- Explanation: The handbook rejects choice C because “the passage does not provide information about other female swimmers’ successful swims across the channel.” But the table lists a second woman, Yvetta Hlavacova (2006, 7 hours, 25 minutes), so C is true of the table. The explanation now says C is wrong because that one detail is not the table’s main contribution: the passage does not discuss other female swimmers, and the table mainly shows how far the record has fallen since Ederle’s time.
Working it out, step by step
Figure out what the question asks
This asks what the table adds to the passage. Don’t just say what is in the table. Say what you learn from it that the passage itself does not tell you.
Read the key rows of the table
The table has two parts, “Earliest Speed Records” and “Current Speed Records.” Here are three of its rows:
Year Swimmer Time 1875 Matthew Webb 21 hours, 45 minutes 1926 Gertrude Ederle 14 hours, 31 minutes 2012 Trent Grimsey 6 hours, 55 minutes Compare the times
Ederle took about 14 and a half hours. Half of that is about 7 and a quarter hours. The 2012 record is under 7 hours. So today’s record is less than half of Ederle’s time. This shows two things. People kept swimming the channel long after Ederle. And they got much faster.
See what the passage leaves out
The passage ends with Ederle’s parade and the people she inspired. It never says what happened to the record later. The table adds that part of the story: the record kept falling, by a lot.
Check each choice
- A: people kept swimming the channel and “significantly reduced the speed record.” Significantly means by a lot. The table shows this.
- B: nothing says later women were inspired by Ederle.
- C: the table does show another woman, Yvetta Hlavacova, with a record. But that is one row, not the table’s main point.
- D only names what is in the table, not what it shows. Also, the first record is from 1875, not the twentieth century.
Watch out: D describes the table’s contents. The question asks what the table contributes, or adds.
Pick the answer
The table shows that the record has fallen a long way since Ederle’s time. So the answer is A.
Why this answer and not the closest wrong one
D is the closest wrong answer, because the table does set old and new records side by side. But D stops at naming the comparison. A says what the comparison shows. The record dropped from over 21 hours to under 7 hours. That is what the table adds to the passage.
More questions like this
The original DOE question
The passage “Champion of the Channel” as printed (pages 56–57)
Question 27 of 35
2018 Test A Math, question 11Question
PEOPLE PER VEHICLE AT CHECKPOINT
| Number of People in Vehicle | Percent of Vehicles |
| 1 | 40% |
| 2 | 35% |
| 3 | 15% |
| 4 | 7% |
| 5 or more | 3% |
A researcher recorded the number of people in each vehicle that passed through a checkpoint. The table above shows the percent distribution for the 420 vehicles that passed through the checkpoint yesterday morning. How many of the 420 vehicles contained at least 3 people?
- A42
- B63
- C105
- D315
Show the answer
Correct answer: C
First, add the percentage of cars containing 3 people, 4 people, and 5 or more people:
15% + 7% + 3% = 25%
Thus, 25% of the cars contained at least 3 people, so use that to calculate the number of cars:
420 × 0.25 = 105 cars.
Question analysis
A data table question with percents: a table gives the percent of 420 vehicles carrying 1, 2, 3, 4, or 5 or more people. Students find how many vehicles held at least 3 people by adding the right rows and taking that percent of 420. Reading at least correctly decides which rows count.
- Grade level
- Grade 6 content, by NYS standard
- Compared with grade 7
- At grade 7 Taking a percent of a number is grade 6 work, and grade 7 adds multistep percent problems. This two-step table problem sits at that level, with the phrase at least as the careful-reading point.
- Estimated difficulty
- Moderate: several steps, or a close reading with one strong distractor.
- Thinking it demands
- Depth of knowledge 2, skills and concepts · mainly apply
- What makes it hard
- Turning words into math moderate
- Reading a figure, table or graph moderate
- Solution
- 2 steps
- Reading level
- Question and choices: about grade 7, 56 words.
- Students, last 30 days
- Not enough answers yet to show (it takes 10).
Why it is hard, traps and wrong answers (shows the answer)
Why it is hard
The arithmetic is easy, since 25% of 420 is a quarter of it; the points are lost on the phrase "at least 3". Each common misreading, more than 3, exactly 3 or fewer than 3, gives a listed choice, so a wrong reading never leads to a dead end. Adding the percents before converting saves time and avoids three separate multiplications.
Turning words into math moderate Understanding the question
The bold "at least 3" has to become the rows for 3, 4 and "5 or more", taking in both the 3-person row and the open-ended last row. (Hegarty, Mayer & Monk, 1995; Koedinger & Nathan, 2004)
Reading a figure, table or graph moderate Understanding the question
The table gives percents, not counts, so the rows have to be added as percents and then taken of the 420 vehicles named only in the text below the table. (Lesh, Post & Behr, 1987; Kirsch & Mosenthal, 1990)
Strategy: Add the percents for every row that meets the condition first, then take that single percent of 420 instead of working row by row.
Traps
- Counting the ends: Inclusive or exclusive ends, fence posts, consecutive numbers: an answer that is one too many or too few, or an endpoint drawn open where it belongs closed (or the reverse).
- Answers a different question: A choice is right for another quantity: the other unknown, the rest instead of the part, the part instead of the whole.
The wrong answers, classified
A Counting the ends (Brown & Burton, 1978)
Reads at least 3 as more than 3 and leaves out the 3-person row, adding only 7% + 3% = 10%, and 10% of 420 is 42.
B Misreads the question (Hegarty, Mayer & Monk, 1995)
Matches the 3 in the question to the row for exactly 3 people, 15% of 420 = 63, missing the 4-person and 5-or-more rows.
D Answers a different question (King et al., 2004; Hegarty, Mayer & Monk, 1995)
Adds the 40% and 35% rows to get 75% and takes 75% of 420 = 315, which counts the vehicles with fewer than 3 people.
Worked solution, step by step
Formulas used
- Percent of a number
- W is the whole amount. p is the percent, and x is the part you want. Percent means out of 100, so p percent is the fraction p over 100. Multiplying the whole by that fraction gives the part.
Sort out the question
420 vehicles passed the checkpoint. The table gives the percent of vehicles with each number of people. You need how many vehicles had “at least 3” people. At least 3 means 3 or more. So count vehicles with 3 people, 4 people, and 5 or more.
Pick the right rows
Three rows fit: 3 people (15%), 4 people (7%), and 5 or more (3%). Watch out: at least 3 includes 3 itself. Leaving out the 3 row gives 42, choice A. Using only the 3 row gives 63, choice B.
Add the percents first
Adding the percents first saves work. Then you only multiply once.
So 25% of the vehicles had at least 3 people.
Find 25% of 420
Use the percent formula with p = 25 and W = 420.
25% is one quarter, so this is the same as . Watch out: 315 is the number of vehicles with fewer than 3 people, choice D. So the answer is C, 105.
Check your answer
The other rows, 1 and 2 people, make . 75% of 420 is 315. Then , which is all the vehicles. The two groups fit together.
More questions like this
The original DOE question
Question 28 of 35
2018 Test A Math, question 23Question
SCORES ON MATH QUIZ
| Score | Number of Students |
| 85 | 4 |
| 75 | 4 |
| 65 | 2 |
What is the mean score of the 10 students in the table above?
- A22.5
- B75
- C77
- D85
Show the answer
Correct answer: C
For each row, multiply the number of students by the score. Then add those together and divide by the total number of students to find the mean (average) of the 10 students.
Question analysis
This statistics question gives a frequency table of quiz scores: three scores and how many of the 10 students earned each. Students find the mean score of all 10 students. Each score has to count as many times as students earned it, which is easy to overlook when only three scores are listed.
- Grade level
- Grade 6 content, by NYS standard
- Compared with grade 7
- Below grade 7 Computing a mean is grade 6 work, and this weighted version from a table takes two short steps. It is a little easier than typical grade 7 statistics, which compares whole data sets.
- Estimated difficulty
- Straightforward: two steps or one careful reading.
- Thinking it demands
- Depth of knowledge 2, skills and concepts · mainly apply
- What makes it hard
- A very close wrong answer moderate
- Reading a figure, table or graph minor
- Solution
- 2 steps
- Reading level
- Question and choices: about grade 2, 20 words.
- Students, last 30 days
- Not enough answers yet to show (it takes 10).
Why it is hard, traps and wrong answers (shows the answer)
Why it is hard
The procedure is routine once students see that the table lists counts, not separate students. The tempting shortcut is to average the three scores in the first column, which gives a listed choice close to the right one. Multiplying each score by its count, then dividing by 10, takes well under a minute.
A very close wrong answer moderate Choosing the answer
77 and 75 are only 2 points apart, so a rough sense of the middle score cannot choose between them; only weighting each score by its 4, 4 or 2 students does. (Embretson & Wetzel, 1987; Gorin & Embretson, 2006; Ascalon et al., 2007)
Reading a figure, table or graph minor Understanding the question
The table pairs each score with a number of students, so the 10 students are 4, 4 and 2, and each score must be weighted by its count. (Lesh, Post & Behr, 1987; Kirsch & Mosenthal, 1990)
Strategy: Multiply each score by its number of students, add the three products, and divide by the 10 students.
Traps
- Misunderstands the concept: A wrong belief about a concept: that percents can be added, that area grows like length, that averages can be averaged, that a bigger denominator means a bigger fraction.
The wrong answers, classified
A Numbers taken from the question (Hegarty, Mayer & Monk, 1995)
Adds the three scores, 85 + 75 + 65 = 225, and divides by the 10 students, an average lower than every score in the table.
B Misunderstands the concept (Smith, diSessa & Roschelle, 1993; De Bock et al., 1998; Ni & Zhou, 2005)
Averages the three listed scores, (85 + 75 + 65) ÷ 3 = 75, ignoring that 4, 4 and 2 students earned them.
D Numbers taken from the question (Hegarty, Mayer & Monk, 1995)
Picks the top score, which 4 students earned, instead of computing a mean of all 10 scores.
Worked solution, step by step
Formulas used
- Mean (average)
- M is the mean, also called the average. S is the sum, all the values added together. n is how many values there are. Dividing shares the total out equally, so the mean is what each value would be if they were all the same.
Sort out the table
The table lists 3 scores and how many students got each one. 4 students scored 85. 4 students scored 75. 2 students scored 65. That is students. You need the mean, or average, of all 10 scores.
Find the sum of all 10 scores
Each score counts once for every student who got it. So multiply each score by its number of students.
Add the three results.
All 10 scores add up to 770 points.
Divide by the number of students
Watch out: averaging just the three scores gives , choice B. That acts as if only one student got each score. So the answer is C, 77.
Check your answer
More students scored 85 than 65. So the mean should be a little above the middle score, 75. 77 fits. A mean must also be between the lowest and highest scores, 65 and 85. That rules out 22.5.
More questions like this
The original DOE question
Question 29 of 35
2018 Test A Math, question 46Question
SCORES ON BIOLOGY TEST
| Section | Lowest Score | Range |
| I | 65 | 28 |
| II | 62 | 25 |
| III | 67 | 22 |
Mr. Blake’s biology class is divided into three sections. The same test was given to each section. The table above shows both the lowest score and the range of scores on this test for each section. What is the overall range of all scores in all three sections?
- A25
- B27
- C28
- D31
Show the answer
Correct answer: D
First, calculate the highest score for each section by adding the lowest score to the range:
Section I: 65 + 28 = 93
Section II: 62 + 25 = 87
Section III: 67 + 22 = 89
The overall highest score is 93, and the overall lowest score is 62. Thus the overall range is 93 − 62 = 31.
Question analysis
This statistics question uses a table of the lowest score and the range for three sections of a biology class and asks for the range of all the scores combined. Students must rebuild each section's highest score from its lowest score and range, then compare across sections. Reversing the usual range calculation is the tricky part.
- Grade level
- Grade 6 content, by NYS standard
- Compared with grade 7
- At grade 7 Grade 7 students compute a range from a list of data. Here they must work backward from range to the highest score in each section and then combine three groups, one step beyond routine.
- Estimated difficulty
- Moderate: several steps, or a close reading with one strong distractor.
- Thinking it demands
- Depth of knowledge 2, skills and concepts · mainly apply
- What makes it hard
- No obvious method moderate
- A very close wrong answer moderate
- Much to keep track of minor
- Solution
- 3 steps
- Reading level
- Question and choices: about grade 2, 59 words.
- Students, last 30 days
- Not enough answers yet to show (it takes 10).
Why it is hard, traps and wrong answers (shows the answer)
Why it is hard
Range is usually computed from a list, so working backward from it is the unfamiliar part. The key fact, that the overall lowest and highest scores come from different sections, is invisible until all three highest scores are written down. Every wrong choice comes from skipping that step and reasoning with the ranges as given.
No obvious method moderate Working it out
The table gives each section's lowest score and range but no highest score, so students must reverse the range formula, high = low + range, before comparing sections. (Schoenfeld, 1985)
A very close wrong answer moderate Choosing the answer
The choices 28 and 27 sit within 4 of 31, so a sense of the spread cannot separate them; only rebuilding the highest scores, which puts the top at 93, does. (Embretson & Wetzel, 1987; Gorin & Embretson, 2006; Ascalon et al., 2007)
Much to keep track of minor Working it out
The overall lowest, 62, comes from Section II and the overall highest, 93, from Section I, so values from two rows must be combined. (Sweller, 1988; Carpenter, Just & Shell, 1990)
Strategy: Add each section's range to its lowest score to get its highest score, then subtract the lowest of all scores from the highest of all scores.
Traps
- Answers a different question: A choice is right for another quantity: the other unknown, the rest instead of the part, the part instead of the whole.
The wrong answers, classified
A Misunderstands the concept (Smith, diSessa & Roschelle, 1993; De Bock et al., 1998; Ni & Zhou, 2005)
Averages the three section ranges, (28 + 25 + 22) ÷ 3 = 25, as if the overall range were a typical section's range.
B Answers a different question (King et al., 2004; Hegarty, Mayer & Monk, 1995)
Leaves Section I out, taking the top score as Section III's 67 + 22 = 89, which gives the range of Sections II and III only.
C Answers a different question (King et al., 2004; Hegarty, Mayer & Monk, 1995)
Takes Section I's range, 28, the largest in the table, giving one section's spread instead of the spread across all three.
Worked solution, step by step
Formulas used
- Range
- R is the range, the spread of the scores. H is the highest score and L is the lowest score. The range tells how far apart the top and bottom scores are. If you know L and R, then H = L + R.
Sort out what you know
The table gives each section’s lowest score and its range. The range is the highest score minus the lowest score.
The bold overall means one range for all three sections together. For that you need the highest and lowest scores of all.
Find each section’s highest score
Turn the range formula around: highest = lowest + range.
Section Lowest Range Highest I 65 28 65 + 28 = 93 II 62 25 62 + 25 = 87 III 67 22 67 + 22 = 89 Pick the overall highest and lowest
The highest score of all is 93, from Section I. The lowest score of all is 62, from Section II. They come from different sections, and that is fine.
Subtract to find the range
Watch out: 28 is just Section I’s range, choice C. Averaging the three ranges gives 25, choice A. Neither covers all the scores at once.
So the answer is D, 31.
Check your answer
The overall range must be at least as big as each section’s range, because it covers all their scores. 31 is bigger than 28, 25 and 22, so it is reasonable. Also, 62 + 31 = 93, the top score.
More questions like this
The original DOE question
Question 30 of 35
2018 Test A Math, question 56Question
SERVINGS OF FRUITS AND VEGETABLES
| Number of Servings of Fruits and Vegetables | Number of Students |
| 0 | 5 |
| 1 | 7 |
| 2 | 3 |
| 3 | 4 |
| 4 | 0 |
| 5 | 1 |
There are 20 students in a class. The frequency table above shows the number of students in this class who ate 0, 1, 2, 3, 4, or 5 servings of fruits and vegetables yesterday. What is the mean number of servings of fruits and vegetables eaten yesterday per student in this class?
- A
- B
- C
- D
Show the answer
Correct answer: A
First, determine the total number of servings of fruits and vegetables that the students ate by multiplying the number of servings by the number of students in each row of the table.
Then add that column to get the total number of servings:
| Number of Servings of Fruits and Vegetables | Number of Students | Number of Servings × Number of Students |
| 0 | 5 | 0 |
| 1 | 7 | 7 |
| 2 | 3 | 6 |
| 3 | 4 | 12 |
| 4 | 0 | 0 |
| 5 | 1 | 5 |
Total: 30
Calculate the mean by dividing the total number of servings of fruits and vegetables by the total number of students:
Question analysis
This statistics question uses a frequency table showing how many of 20 students ate 0, 1, 2, 3, 4 or 5 servings of fruits and vegetables, and asks for the mean servings per student. Students must weight each serving amount by its number of students, add, and divide. Averaging the wrong column of the table is the common mistake.
- NYS standards
- 6.SP.5c range, center, and overall pattern
- Grade level
- Grade 6 content, by NYS standard
- Compared with grade 7
- At grade 7 Finding a mean is grade 6 content; doing it from a frequency table, where each value must be weighted by its count, is the multi-step version grade 7 students meet regularly.
- Estimated difficulty
- Moderate: several steps, or a close reading with one strong distractor.
- Thinking it demands
- Depth of knowledge 2, skills and concepts · mainly apply
- What makes it hard
- Reading a figure, table or graph moderate
- Many steps minor
- Solution
- 3 steps
- Reading level
- Question and choices: about grade 7, 64 words.
- Students, last 30 days
- Not enough answers yet to show (it takes 10).
Why it is hard, traps and wrong answers (shows the answer)
Why it is hard
The answer is smaller than every wrong choice, which surprises students who average the table's columns directly. The question rewards seeing that each row stands for several students, so the total servings come from weighting each value by its count. The stem's reminder that there are 20 students points to the right divisor.
Reading a figure, table or graph moderate Understanding the question
The frequency table has a value column and a count column; the mean needs each value multiplied by its count, so the two columns play different roles. (Lesh, Post & Behr, 1987; Kirsch & Mosenthal, 1990)
Many steps minor Working it out
Six products, 0, 7, 6, 12, 0 and 5, must be found and added to 30 before dividing by the 20 students. (Daniel & Embretson, 2010; Enright, Morley & Sheehan, 2002)
Strategy: Multiply each serving amount by its number of students, add those products to get the total servings, then divide by the 20 students.
Traps
- Answers a different question: A choice is right for another quantity: the other unknown, the rest instead of the part, the part instead of the whole.
The wrong answers, classified
B Misunderstands the concept (Smith, diSessa & Roschelle, 1993; De Bock et al., 1998; Ni & Zhou, 2005)
Averages the serving amounts 1 through 5 listed in the table, (1 + 2 + 3 + 4 + 5) ÷ 5 = 3, without weighting by the students.
C Answers a different question (King et al., 2004; Hegarty, Mayer & Monk, 1995)
Averages the Number of Students column, 20 students over 6 rows, finding the mean count per row instead of the servings per student.
D Numbers taken from the question (Hegarty, Mayer & Monk, 1995)
Divides the 20 students by 5, the largest serving amount, combining two numbers from the page without a model of the mean.
Worked solution, step by step
Formulas used
- Mean
- m is the mean, or average. S is the sum of all the values, here the total servings eaten. n is the number of values, here the number of students. The mean shares the total equally, as if every student ate the same amount.
Sort out the table
This is a frequency table. Each row says how many students ate a certain number of servings. For example, the second row says 7 students ate 1 serving each.
There are 20 students. You need the mean, or average, number of servings per student.
Find the servings in each row
In each row, multiply the servings by the number of students:
Servings Students Servings × Students 0 5 0 1 7 7 2 3 6 3 4 12 4 0 0 5 1 5 Add up all the servings
The class ate 30 servings in all. The students add up to 20, as the question says: 5 + 7 + 3 + 4 + 0 + 1 = 20.
Divide by the number of students
Watch out: do not just average the serving numbers 1 to 5. That gives 3, choice B, and ignores how many students ate each amount. Dividing 20 students by 6 rows gives choice C.
So the answer is A, .
Check your answer
12 of the 20 students ate 0 or 1 serving. Only 5 ate 3 or more. So the mean should be small, between 1 and 2. fits. Choices B, C and D are all 3 or more, which is too big.
More questions like this
The original DOE question
Question 31 of 35
2018 Test B Math, question 13Question
DESSERT CHOICES
| Dessert | Number of Times Ordered |
| Cookies | 42 |
| Pie | 23 |
| Cake | 47 |
| Ice Cream | 48 |
The table above shows the number of times that different desserts were ordered at a restaurant. Based on this information, what is the probability of a customer ordering ice cream as a dessert?
- A25%
- B30%
- C40%
- D48%
Show the answer
Correct answer: B
The total number of desserts ordered is
42 + 23 + 47 + 48 = 160
The probability that ice cream was chosen is
.
Question analysis
This probability question gives a table of how many times four desserts were ordered at a restaurant and asks how likely a customer is to order ice cream, as a percent. Students total the orders and divide. The trap is using a raw count, or the wrong total, in place of the full number of desserts ordered.
- Grade level
- Grade 6 content, by NYS standard
- Compared with grade 7
- Below grade 7 Finding a probability from observed frequencies is grade 6 content in New York. Here it takes one sum, one division and a conversion to a percent with friendly numbers, lighter than typical grade 7 work.
- Estimated difficulty
- Routine: one familiar step, little to misread.
- Thinking it demands
- Depth of knowledge 1, recall and reproduction · mainly apply
- What makes it hard
- Solution
- 3 steps
- Reading level
- Question and choices: about grade 5, 45 words.
- Students, last 30 days
- Not enough answers yet to show (it takes 10).
Why it is hard, traps and wrong answers (shows the answer)
Why it is hard
This is a direct relative-frequency question with friendly numbers, and most students finish it quickly. The risk is using a number from the table as if it were already a percent, or treating the four desserts as equally likely. Remembering that a probability compares one count with the total of all counts prevents both mistakes.
Reading a figure, table or graph minor Understanding the question
The four counts sit in a table, and the probability needs all of them: the ice cream row gives the numerator and the sum of the column gives the denominator. (Lesh, Post & Behr, 1987; Kirsch & Mosenthal, 1990)
Error-prone arithmetic minor Working it out
Adding 42 + 23 + 47 + 48 by hand and then simplifying 48/160 to 3/10 are small steps where a careless total spoils the percent. (Brown & Burton, 1978; Junker & Sijtsma, 2001)
Strategy: Add the four counts in the table to get all the orders, divide the ice cream count by that total, and convert the fraction to a percent.
Traps
- Answers a different question: A choice is right for another quantity: the other unknown, the rest instead of the part, the part instead of the whole.
The wrong answers, classified
A Misunderstands the concept (Smith, diSessa & Roschelle, 1993; De Bock et al., 1998; Ni & Zhou, 2005)
Treats the four desserts as equally likely, one chance in four, ignoring how often each was actually ordered.
C Answers a different question (King et al., 2004; Hegarty, Mayer & Monk, 1995)
Divides 48 by the 112 orders of the other desserts instead of all 160, getting about 43%, and takes the nearest choice.
D Numbers taken from the question (Hegarty, Mayer & Monk, 1995)
Reads the 48 ice cream orders as 48 percent without dividing by the total number of desserts ordered.
Worked solution, step by step
Formulas used
- Probability
- P is the probability, the chance that something happens. The top counts the outcomes you want, here ice cream orders. The bottom counts every outcome, here all dessert orders. It works because each order counts the same.
- Fraction to percent
- Percent means out of 100. Multiply a fraction or a decimal by 100 to write it as a percent. For example, 3/10 times 100 is 30, so 3/10 is 30%.
Sort out the table
The table shows how many times each dessert was ordered. Ice cream was ordered 48 times.
You need the chance that a customer orders ice cream. The orders in the table show how often each dessert is picked.
Find the total orders
Add all four rows of the table.
There were 160 dessert orders in all. This is the bottom of the fraction, because it counts every order.
Write the probability
Put the counts into the probability formula. The top is the 48 ice cream orders. The bottom is all 160 orders.
Simplify the fraction. Both numbers can be divided by 16.
Change to a percent
The probability is 30%.
Watch out: 48 orders is not 48%, choice D. You must divide by the total. Also, the four desserts are not equally popular. So the chance is not 1 out of 4, or 25%, choice A.
So the answer is B, 30%.
Check your answer
Work backward: . That matches the ice cream row. Also, 48 is a bit less than a third of 160, and 30% is a bit less than a third.
More questions like this
The original DOE question
Question 32 of 35
2018 Test B Math, question 18Question
PRICES FOR NEWSPAPER ADVERTISING
| Page Space | Price |
| page | $200 |
| page | $350 |
| full page | $600 |
The table above shows prices for newspaper advertising. A store purchased pages, pages, and full pages of page space in equal numbers for a total of $11,500. What is the total amount of page space the store purchased?
- A pages
- B10 pages
- C pages
- D pages
Show the answer
Correct answer: D
The question says that an equal number () of each type of page space was purchased. To find the number of each type of page space that was purchased, multiply the price per type by and set it equal to the total amount spent, then solve for :
Thus, the store purchased 10 units of each type of page space. To find the total amount of page space purchased, multiply each type of page space by 10, and add:
Question analysis
This word problem gives a table of newspaper advertising prices for quarter-page, half-page and full-page ads, and says a store bought equal numbers of each for a set total. Students write and solve an equation for how many ads of each size were bought. The question wants total page space, which takes a second calculation with fractions.
- Grade level
- Grade 7 content, by NYS standard
- Compared with grade 7
- Above grade 7 Grade 7 students write and solve equations like px = r from word problems. This adds a table, combines three prices into one coefficient and needs a second step with fractions after solving, a longer chain than typical grade 7 work.
- Estimated difficulty
- Hard: combines ideas, needs a plan, and has more than one tempting wrong answer.
- Thinking it demands
- Depth of knowledge 2, skills and concepts · mainly apply
- What makes it hard
- Many steps major
- Turning words into math moderate
- Reading a figure, table or graph minor
- Solution
- 4 steps
- Reading level
- Question and choices: about grade 5, 59 words.
- Corrected from the DOE handbook
- An arithmetic slip in the explanation was corrected.
- Students, last 30 days
- Not enough answers yet to show (it takes 10).
Why it is hard, traps and wrong answers (shows the answer)
Why it is hard
Solving for the number of ads is the obvious goal, and finding it feels like the finish, but the question asks for page space, which needs one more pass through the table. The awkward wording about buying pages in equal numbers slows students before any arithmetic starts. The wrong choices mark each place to stop: one set of ads, the number of each ad, or a slip in adding the fractional pages.
Many steps major Working it out
The work has two phases: turn the money into a count, 1,150x = 11,500 so x = 10, then turn the count into space by multiplying 10 by 1/4, 1/2 and 1 and adding. (Daniel & Embretson, 2010; Enright, Morley & Sheehan, 2002)
Turning words into math moderate Understanding the question
The phrase “purchased 1/4 pages, 1/2 pages, and full pages of page space in equal numbers” has to be read as the same number of ads of each size, so the three prices add to one coefficient. (Hegarty, Mayer & Monk, 1995; Koedinger & Nathan, 2004)
Reading a figure, table or graph minor Understanding the question
Both columns of the table are needed: the price column builds the equation, and the page-space column turns the count of ads into the final total. (Lesh, Post & Behr, 1987; Kirsch & Mosenthal, 1990)
Strategy: Let x be the number of each ad size, add the three prices to write one equation for the total, solve it, then multiply x by the page space in one set of ads.
Traps
- Stops one step early: A choice is a number from partway through the solution.
- Answers a different question: A choice is right for another quantity: the other unknown, the rest instead of the part, the part instead of the whole.
The wrong answers, classified
A Answers a different question (King et al., 2004; Hegarty, Mayer & Monk, 1995)
Adds 1/4 + 1/2 + 1, the page space in one set of the three ads, without using the $11,500 to find how many sets were bought.
B Stops one step early (King et al., 2004; Gierl et al., 2017)
Solves 1,150x = 11,500 for the number of ads of each size and stops there instead of converting the count to page space.
C An arithmetic slip (Junker & Sijtsma, 2001)
Takes ten quarter pages as 1 1/2 pages instead of 2 1/2, so adds 1 1/2 + 5 + 10.
What was corrected from the DOE handbook, and why
- Explanation: The handbook adds 200x + 350x + 600x and writes 1,500x = 11,500. The sum is 1,150x, and the handbook’s next line, x = 10, only follows from 1,150x = 11,500. The site shows 1,150x = 11,500.
Worked solution, step by step
Formulas used
- Number of equal sets
- A set here means one ad of each size. The cost of one set is what one of each costs together. Dividing the total money by it tells how many sets were bought, because every set costs the same.
Sort out the question
The store bought the same number of each ad size: quarter page, half page and full page. It spent $11,500 in all.
You need the total page space. That is not the number of ads, and not the money.
Find the cost of one set
Think of one quarter page, one half page and one full page as a set. The store bought equal numbers of each, so it bought whole sets.
One set costs $1,150.
Find how many sets
The store bought 10 sets. That means 10 ads of each size.
Watch out: 10 is the number of each ad, not the page space. Stopping here gives choice B.
Find the page space in one set
Add the sizes in one set. Write them in quarters so they have the same bottom number.
One set is , or , pages.
Watch out: pages is only one set. That is choice A.
Multiply by the number of sets
There are 10 sets, so multiply the space in one set by 10.
So the answer is D, pages.
Check your answer
Add the sizes another way. 10 quarter pages make 2.5 pages, not 1.5. 10 half pages make 5 pages. 10 full pages make 10 pages. Then , the same answer.
More questions like this
The original DOE question
Question 33 of 35
2018 Test B Math, question 32Question
PET SURVEY
| Number of Pets | Number of Students |
| 0 | 12 |
| 1 | 16 |
| 2 | 7 |
| 3 or more | 5 |
Amy surveyed students at her school about the number of pets they have. What is the probability that a student who participated in the survey has at least 2 pets?
- A
- B
- C
- D
Show the answer
Correct answer: D
First, add the number of students for each category to find out how many total students were in the survey:
12 + 16 + 7 + 5 = 40
The number of students who had at least 2 pets are the ones who have 2 pets (7) plus the ones who have 3 or more (5). The total number of students with at least 2 pets is
7 + 5 = 12
The probability of a student in the survey having at least two pets is:
Question analysis
Amy's pet survey table shows how many pets each student has, and the question asks for the probability that a randomly chosen student has at least 2 pets. It tests finding a probability from survey data. The tricky part is reading "at least 2" correctly and using the right total as the denominator.
- Grade level
- Grade 6 content, by NYS standard
- Compared with grade 7
- Below grade 7 Simple probability from a frequency table is grade 6 work in New York. The only extra demand is interpreting "at least" and adding a column, two short steps a grade 7 student should handle easily.
- Estimated difficulty
- Straightforward: two steps or one careful reading.
- Thinking it demands
- Depth of knowledge 2, skills and concepts · mainly apply
- What makes it hard
- Solution
- 3 steps
- Reading level
- Question and choices: about grade 5, 43 words.
- Students, last 30 days
- Not enough answers yet to show (it takes 10).
Why it is hard, traps and wrong answers (shows the answer)
Why it is hard
The arithmetic is light, so the question is decided by the phrase "at least 2" and by remembering that the denominator is everyone surveyed. Students who include only one of the two qualifying rows reach an answer with the right denominator, which makes the mistake hard to notice. Rereading the condition before choosing is the main safeguard.
Turning words into math minor Understanding the question
"At least 2 pets" has to be turned into two rows of the table, the 2-pet row and the 3-or-more row, not one. (Hegarty, Mayer & Monk, 1995; Koedinger & Nathan, 2004)
Reading a figure, table or graph minor Understanding the question
The denominator is not printed anywhere; it has to be built by adding all four rows of the table, 12 + 16 + 7 + 5 = 40. (Lesh, Post & Behr, 1987; Kirsch & Mosenthal, 1990)
Strategy: Total the students in every row to get the denominator, then add the counts for each row that satisfies "at least 2" and simplify the fraction.
Traps
- Misreads the question: Misses or misreads a condition or a word in the question: "at least", "each", "remaining", "not".
The wrong answers, classified
A Misreads the question (Hegarty, Mayer & Monk, 1995)
Reads "at least 2 pets" as exactly 2, counting only the 7 students in that row and leaving out the 5 with 3 or more.
B Numbers taken from the question (Hegarty, Mayer & Monk, 1995)
Writes 1 over 12, apparently from the 12 qualifying students or the 12 in the 0-pet row, with no total in the denominator.
C Misreads the question (Hegarty, Mayer & Monk, 1995)
Reads "at least 2" as more than 2, counting only the 5 students with 3 or more pets: 5/40 = 1/8.
Worked solution, step by step
Formulas used
- Probability
- P is the probability, the chance that something happens. The top counts the results you want. The bottom counts every possible result. Use it when each result is equally likely, like picking one at random.
Sort out the question
The table shows how many students have each number of pets. You pick one student who took the survey. You need the chance that the student has “at least 2 pets”.
At least 2 means 2 or more. So two rows count: the 2 pets row and the 3 or more row.
Find the total number of students
The bottom of the fraction is everyone in the survey. Add all four rows.
There are 40 students in all.
Count the students you want
Add the 2 pets row and the 3 or more row.
So 12 students have at least 2 pets.
Watch out: using only the 7 students with exactly 2 pets gives , choice A. Using only the 5 with 3 or more gives , choice C.
Write and simplify the probability
Use the probability formula.
Divide the top and bottom by 4, since 4 goes into both.
So the answer is D, .
Check your answer
The students with fewer than 2 pets are . Then , so every student is counted once. Also, 12 out of 40 is a bit less than a third. So is .
More questions like this
The original DOE question
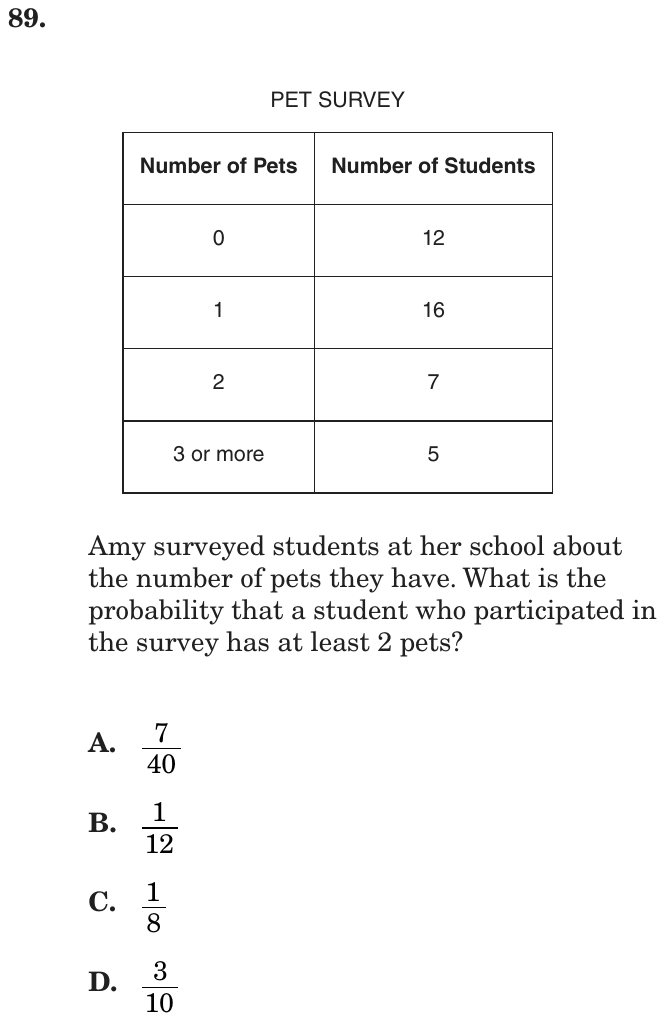
Question 34 of 35
2018 Test B Math, question 38Question
SURVEY OF CATS PER FAMILY
| Number of Cats | Number of Families |
| 0 | 15 |
| 1 | 42 |
| 2 | 35 |
| 3 or more | 8 |
The table above shows the number of cats per family in 100 households in the Blaine neighborhood. By what percentage is the number of families with 1 cat greater than the number of families with 2 cats?
- A7%
- B10%
- C17%
- D20%
Show the answer
Correct answer: D
To find by what percent the number of families with 1 cat is greater than the number of families with 2 cats, calculate the difference between the two numbers and divide by the number of families with 2 cats:
Question analysis
A table lists how many cats live in each of 100 households in the Blaine neighborhood, and the question asks by what percent the number of one-cat families exceeds the number of two-cat families. It tests percent difference. The tricky part is choosing the right base for the comparison when the table's total is a convenient 100.
- NYS standards
- 7.RP.3 multistep ratio and percent problems
- Grade level
- Grade 7 content, by NYS standard
- Compared with grade 7
- At grade 7 Percent increase and decrease is grade 7 content, and this is one standard comparison. What makes it harder than a routine exercise is choosing the base and ignoring the tempting 100-family total.
- Estimated difficulty
- Moderate: several steps, or a close reading with one strong distractor.
- Thinking it demands
- Depth of knowledge 2, skills and concepts · mainly apply
- What makes it hard
- Turning words into math moderate
- A very close wrong answer moderate
- Reading a figure, table or graph minor
- Solution
- 2 steps
- Reading level
- Question and choices: about grade 6, 47 words.
- Students, last 30 days
- Not enough answers yet to show (it takes 10).
Why it is hard, traps and wrong answers (shows the answer)
Why it is hard
The arithmetic is a single subtraction and division, so the question is really about choosing the base of a percent comparison. The 100-household total makes the count difference look like a percent already, and dividing by the larger count is the other classic slip. Students who say "greater than the 2-cat count" to themselves pick 35 as the base.
Turning words into math moderate Understanding the question
"Greater than the number of families with 2 cats" fixes the base of the percent as 35, the count being compared against, not 42 or the 100 households. (Hegarty, Mayer & Monk, 1995; Koedinger & Nathan, 2004)
A very close wrong answer moderate Choosing the answer
17% and the right 20% both come from dividing the 7-family gap by a count, 42 or 35; only choosing 35, the count being compared against, separates them. (Embretson & Wetzel, 1987; Gorin & Embretson, 2006; Ascalon et al., 2007)
Reading a figure, table or graph minor Understanding the question
Only two rows of the four-row table matter, the 42 families with 1 cat and the 35 with 2; the 0-cat and 3-or-more rows go unused. (Lesh, Post & Behr, 1987; Kirsch & Mosenthal, 1990)
Strategy: Find the difference between the two counts, decide which count the comparison is measured against, divide by it, and convert to a percent.
Traps
- Percent of the wrong amount: Finding the whole from a part, or a percent change measured from the wrong starting amount.
- Answers a different question: A choice is right for another quantity: the other unknown, the rest instead of the part, the part instead of the whole.
The wrong answers, classified
A Answers a different question (King et al., 2004; Hegarty, Mayer & Monk, 1995)
Subtracts 42 − 35 = 7 and, since there are 100 households, reads that 7-point gap in shares as a 7% increase.
B Little reason to choose it (Haladyna & Downing, 1993; Rodriguez, 2005)
No division of the 7-family gap by a count in the table gives 10%, so this mostly attracts students estimating a round percent.
C Percent of the wrong amount (Parker & Leinhardt, 1995)
Divides the 7-family difference by 42, the larger count, measuring the change from the wrong amount: 7/42 is about 16.7%, so 17%.
Worked solution, step by step
Formulas used
- Percent greater than
- The difference is how much bigger one amount is than the other. The amount you compare to is the one after the word than. Dividing shows what share of that amount the difference is. Times 100 turns that share into a percent.
Sort out the question
From the table, 42 families have 1 cat and 35 families have 2 cats. You need the percent by which 42 is “greater than the number of families with 2 cats”. The rows for 0 cats and 3 or more cats do not matter here.
Find the difference
Subtract the two counts.
There are 7 more families with 1 cat.
Watch out: 7 is a number of families, not a percent. There are 100 households, so 7% looks tempting. It is choice A, and it is wrong.
Divide by the number you compare to
The question compares with the families that have 2 cats. So divide by 35, not 42.
Watch out: dividing by 42 gives about 17%. That is choice C.
Change the fraction to a percent
Use the percent formula. One fifth of 100 is 20.
So the answer is D, 20%.
Check your answer
Find 20% of 35. That is . Add it on: . That is the number of families with 1 cat, so 20% is right.
More questions like this
The original DOE question
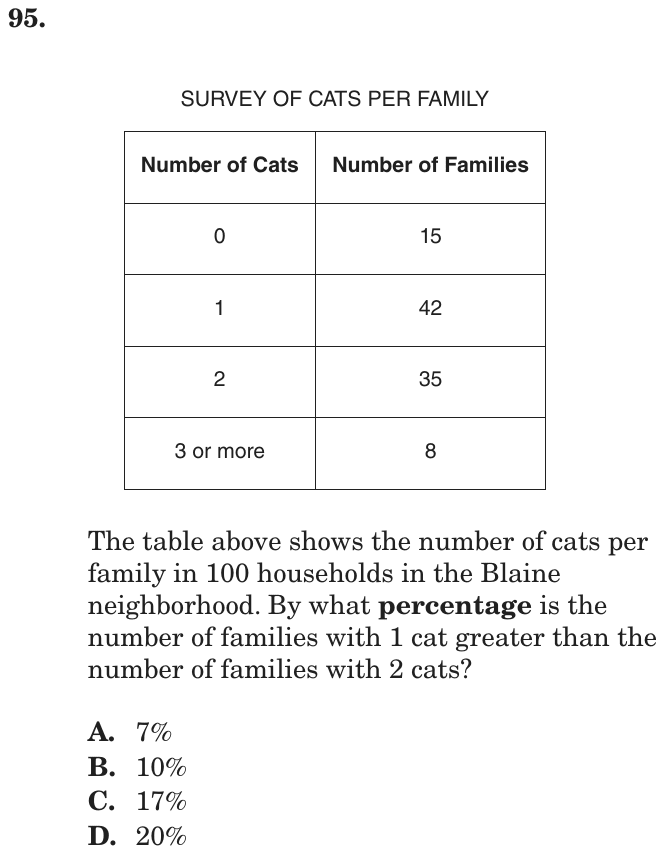
Question 35 of 35
2018 Test B Math, question 49Question
ANIMAL CARDS
| Number of Cards | Picture on Card |
| 8 | cat |
| 6 | dog |
| 5 | bird |
| 4 | fish |
| 1 | horse |
The cards in the table above are mixed in a box. Which animal pictured on a card has exactly a 1 in 4 chance of being picked at random from the box?
- Acat
- Bdog
- Cfish
- Dhorse
Show the answer
Correct answer: B
The total number of cards in the box is
8 + 6 + 5 + 4 + 1 = 24
Set up a proportion to figure out which card has exactly a 1 in 4 chance of being picked at random.
The dog card has a 1 in 4 chance of being randomly selected.
Question analysis
A table lists picture cards for five animals, from 8 cat cards down to 1 horse card, all mixed in one box. Students decide which animal has exactly a 1 in 4 chance of being drawn at random. It tests simple probability as a fraction of the total, and the numbers in the table invite matching the wrong count.
- NYS standards
- 6.SP.8a uniform probability models
- Grade level
- Grade 6 content, by NYS standard
- Compared with grade 7
- Below grade 7 Simple probability from a list of counts is grade 6 work. This takes one sum and one division with small whole numbers, a shorter and more routine task than typical grade 7 probability problems.
- Estimated difficulty
- Routine: one familiar step, little to misread.
- Thinking it demands
- Depth of knowledge 1, recall and reproduction · mainly apply
- What makes it hard
- Solution
- 2 steps
- Reading level
- Question and choices: about grade 1, 47 words.
- Students, last 30 days
- Not enough answers yet to show (it takes 10).
Why it is hard, traps and wrong answers (shows the answer)
Why it is hard
Once the 24 cards are totaled, one fourth of them is 6 and the answer is a lookup. The wrong choices mostly attract students who match the numbers 1 and 4 in the phrase to the horse and fish rows, or who assume the most common card is the one asked about. Little time is needed, so the main risk is skipping the total.
Turning words into math minor Understanding the question
"Exactly a 1 in 4 chance" has to be turned into a count, one fourth of the 24 cards, rather than matched to a 1 or a 4 in the table. (Hegarty, Mayer & Monk, 1995; Koedinger & Nathan, 2004)
Reading a figure, table or graph minor Understanding the question
The counts sit in the table's first column with the animals in the second, and the total of 24 has to be added up from all five rows. (Lesh, Post & Behr, 1987; Kirsch & Mosenthal, 1990)
Strategy: Add the cards to find the total in the box, find one-fourth of that total, and look for the animal with exactly that many cards.
Traps
- Numbers taken from the question: Combines the numbers in the question without a model of the situation, or is simply a number that appears in the question.
The wrong answers, classified
A Little reason to choose it (Haladyna & Downing, 1993; Rodriguez, 2005)
Picks the most common card, but cats are 8 of 24 cards, a 1 in 3 chance, and no reading of the table gives them 1 in 4.
C Numbers taken from the question (Hegarty, Mayer & Monk, 1995)
Matches the 4 in "1 in 4" to the 4 fish cards, confusing a number of cards with a probability.
D Numbers taken from the question (Hegarty, Mayer & Monk, 1995)
Matches the 1 in "1 in 4" to the single horse card instead of comparing each count with the total of 24.
Worked solution, step by step
Formulas used
- Probability
- P is the probability, the chance that something happens. The top counts the results you want. The bottom counts every possible result. Use it when each result is equally likely, like picking one at random.
Sort out the question
The table shows 8 cat cards, 6 dog, 5 bird, 4 fish and 1 horse. All the cards are mixed in a box. You need the animal with “exactly a 1 in 4 chance” of being picked. A 1 in 4 chance means a probability of .
Find the total number of cards
Add every row of the table. This total is the bottom of the probability fraction.
There are 24 cards in the box.
Find one fourth of the cards
The animal you want must have one fourth of all the cards.
So you need the animal with exactly 6 cards. The dog has 6 cards.
Rule out the other choices
Watch out: do not match the numbers 1 and 4 to the table. Fish has 4 cards, but its chance is . So C is wrong. Horse has 1 card, a chance of , so D is wrong. Cat has , so A is wrong.
Give the answer
Only the dog has exactly one fourth of the cards. So the answer is B, dog.
Check your answer
Four groups of 6 cards make 24, the whole box. So 6 cards is one of four equal shares. That is a 1 in 4 chance. The dog cards are exactly one of those shares.
More questions like this
The original DOE question