Misreads the figure
Question 1 of 27
2026 Practice Test A Math, question 37Question
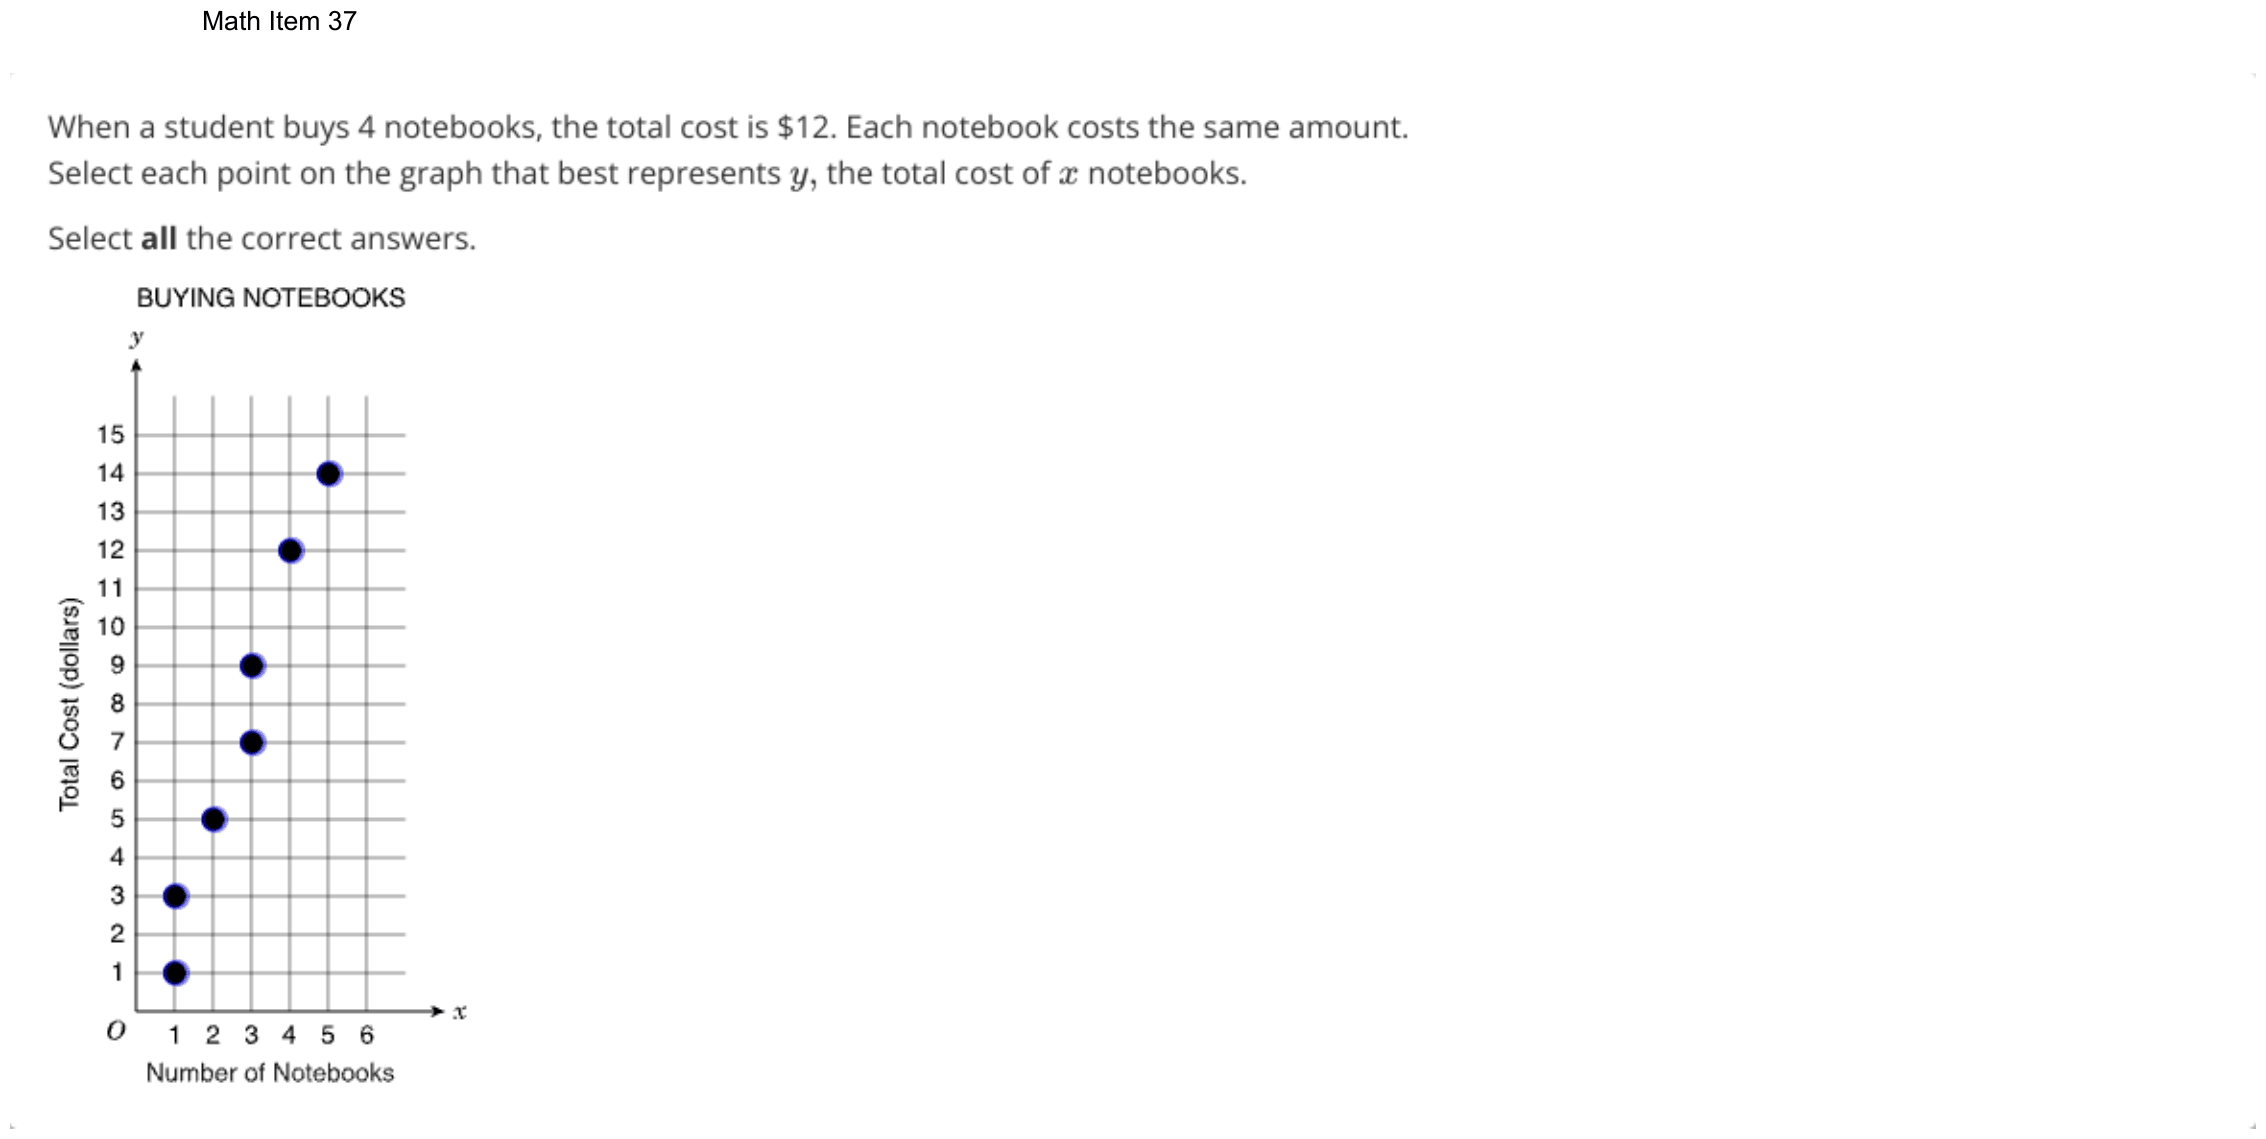
When a student buys 4 notebooks, the total cost is $12. Each notebook costs the same amount. Select each point on the graph that best represents y, the total cost of x notebooks.
Select all the correct answers.
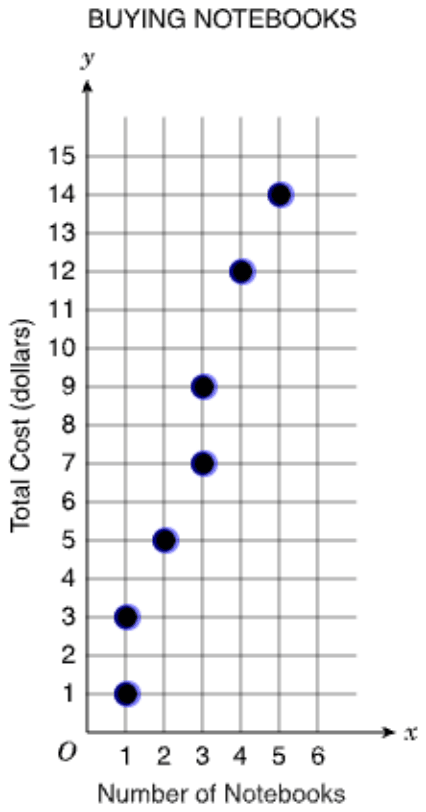
On the test you click the points in the figure; here, choose them below. The DOE has not published how answers with several parts are scored; this site counts one right only when every part is right.
- A(1, 1)
- B(1, 3)
- C(2, 5)
- D(3, 7)
- E(3, 9)
- F(4, 12)
- G(5, 14)
Show the answer
Correct answer: B, E, and F
Solution:
There are three correct points: (1, 3), (3, 9), and (4, 12).
Find the cost per notebook: .
The equation of the line is , where y is the total cost of x notebooks.
Check each point by plugging the x-value into the equation . If the y-value from the equation matches the y-value of the point, then the point is on the line .
Check all seven points:
(1, 1) y-values do not match; incorrect point
(1, 3) y-values match; CORRECT point
(2, 5) y-values do not match; incorrect point
(3, 7) y-values do not match; incorrect point
(3, 9) y-values match; CORRECT point
(4, 12) y-values match; CORRECT point
(5, 14) y-values do not match; incorrect point
Question analysis
A graph titled Buying Notebooks shows seven points, and students select every point that fits the total cost of buying notebooks, given the cost of a few notebooks and that each costs the same. It tests finding a unit rate and recognizing points of a proportional relationship. Some points line up in tempting patterns, and the item does not say how many to select.
- NYS standards
- Grade level
- Grade 7 content, by NYS standard
- Compared with grade 7
- At grade 7 Finding a unit rate and deciding which points fit a proportional relationship are grade 7 skills, and the arithmetic here is easy. What adds demand is testing all seven points with no count given, since one miss or extra pick loses the item.
- Estimated difficulty
- Straightforward: two steps or one careful reading.
- Thinking it demands
- Depth of knowledge 2, skills and concepts · mainly apply
- What makes it hard
- Solution
- 2 steps
- Reading level
- Question and choices: about grade 5, 36 words.
- Students, last 30 days
- Not enough answers yet to show (it takes 10).
Why it is hard, traps and wrong answers (shows the answer)
Why it is hard
Finding the price is one division, 12 ÷ 4 = 3, so the question is really about checking: each chosen dot must fit y = 3x exactly, and the item does not say how many do. The graph punishes judging by eye, since a straight row of dots climbs from (1, 3) at $2 a notebook and two dots sit a single gridline off the true line. Multiplying each x by 3 and reading each y from the axis, not from the pattern, settles all seven.
Every choice must be checked moderate Choosing the answer
Seven dots must each be tested against $3 a notebook, and the item never says how many fit; one missed point or one extra loses the whole item, so no dot can be skipped. (Embretson & Wetzel, 1987)
Reading a figure, table or graph minor Understanding the question
The graph stacks two dots above 1 notebook and two above 3, and each total cost has to be read off a grid ruled at every dollar up to 15. (Lesh, Post & Behr, 1987; Kirsch & Mosenthal, 1990)
A very close wrong answer minor Choosing the answer
(5, 14) sits one gridline below (5, 15), where 5 notebooks at $3 would be, and (2, 5) sits one below (2, 6), so judging by the line's direction cannot rule either out. (Embretson & Wetzel, 1987; Gorin & Embretson, 2006; Ascalon et al., 2007)
Strategy: Work out the cost of one notebook from the total given in the question, then multiply each point's x-coordinate by that price and keep only the points whose y-coordinate matches exactly.
Traps
- Misunderstands the concept: A wrong belief about a concept: that percents can be added, that area grows like length, that averages can be averaged, that a bigger denominator means a bigger fraction.
- Misreads the figure: Reads a value, label or tick spacing in a figure, table or graph wrongly.
The wrong answers, classified
A Little reason to choose it (Haladyna & Downing, 1993; Rodriguez, 2005)
No working from 4 notebooks for $12 makes one notebook cost $1, so this lowest dot mostly catches guesses, such as taking the dot nearest the origin as a start.
C Misunderstands the concept (Smith, diSessa & Roschelle, 1993; De Bock et al., 1998; Ni & Zhou, 2005)
Takes the straight row (1, 3), (2, 5), (3, 7) as the graph because its dots line up, though it climbs $2 a notebook and would meet the y-axis at $1, not the origin.
D Misunderstands the concept (Smith, diSessa & Roschelle, 1993; De Bock et al., 1998; Ni & Zhou, 2005)
Prefers the lower of the two dots above 3 notebooks because it continues the evenly spaced row from (1, 3) and (2, 5), instead of checking that 3 notebooks cost $9.
G Misreads the figure (Lesh, Post & Behr, 1987; Kirsch & Mosenthal, 1990)
Finds that 5 notebooks cost 5 × $3 = $15, then reads the dot above 5 as sitting on the top gridline, 15, when it is one line lower, at 14.
Worked solution, step by step
Formulas used
- Unit price
- The unit price is what one item costs. Divide the total cost by the number of items bought. This works because every notebook costs the same, so the total splits into equal parts.
- A proportional relationship
- y is the total cost in dollars, and x is the number of notebooks. k is the price of one notebook, the number you always multiply by. A point fits only if its y is exactly k times its x. The graph is a straight line through (0, 0).
Sort out the question
Four notebooks cost $12, and each one costs the same. On the graph, x is the number of notebooks, and y is the total cost in dollars. The graph shows seven points. You must select every point that fits. The question does not say how many fit, so test all seven.
Find the price of one notebook
Split the $12 equally among the 4 notebooks:
Each notebook costs $3. So the total cost is 3 times the number of notebooks:
Test each point
For each point, multiply its x by 3. Keep the point only if the result equals its y.
Choice Point 3 × x Fits? A (1, 1) 3 No B (1, 3) 3 Yes C (2, 5) 6 No D (3, 7) 9 No E (3, 9) 9 Yes F (4, 12) 12 Yes G (5, 14) 15 No Watch for look-alike points
Watch out: the dots (1, 3), (2, 5) and (3, 7) sit in a neat straight row. But that row climbs $2 per notebook, not $3. Lining up is not enough: (2, 5) and (3, 7), choices C and D, do not fit.
Watch out: 5 notebooks cost dollars. The dot above 5 sits one gridline lower, at 14. Read the y-axis carefully, and you will skip choice G.
Name the points
Three points fit: (1, 3), (3, 9) and (4, 12). On the test, you click each of these dots on the graph. On this site, you check their boxes. So the answers are B, E and F.
Check your answer
All three points fit : , and . They also line up with (0, 0), since 0 notebooks cost $0. And (4, 12) is the fact the question gave you.
More questions like this
The original DOE question
Question 2 of 27
2026 Practice Test C Math, question 12Question
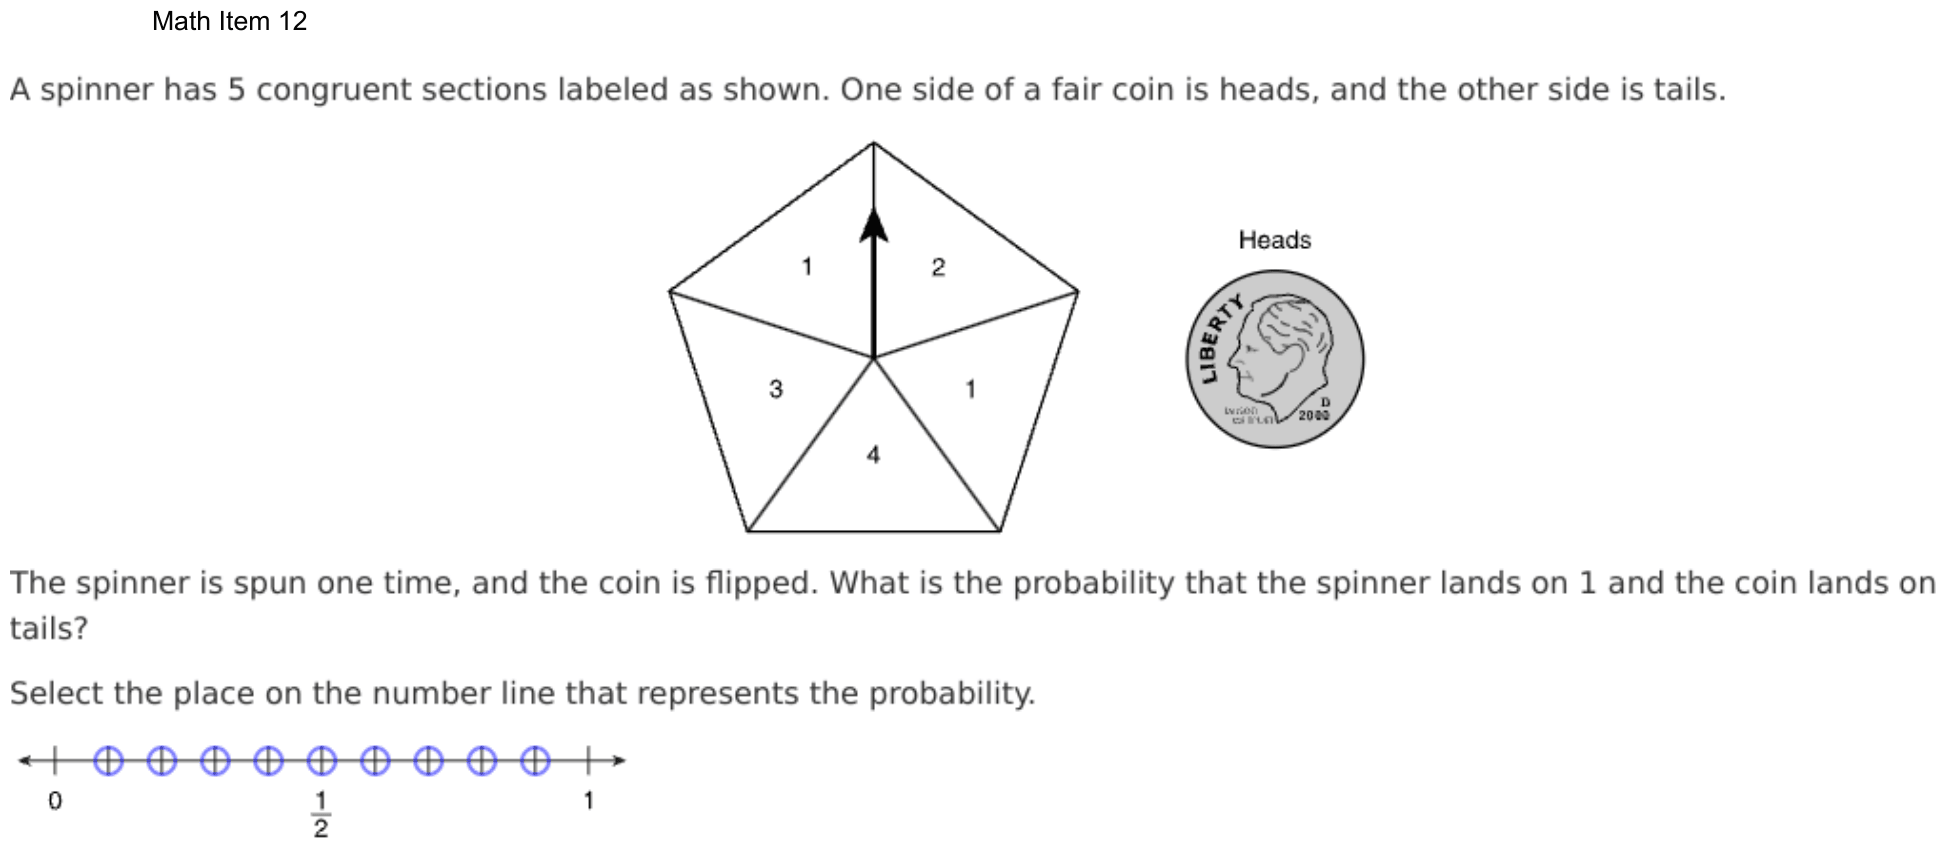
A spinner has 5 congruent sections labeled as shown. One side of a fair coin is heads, and the other side is tails.
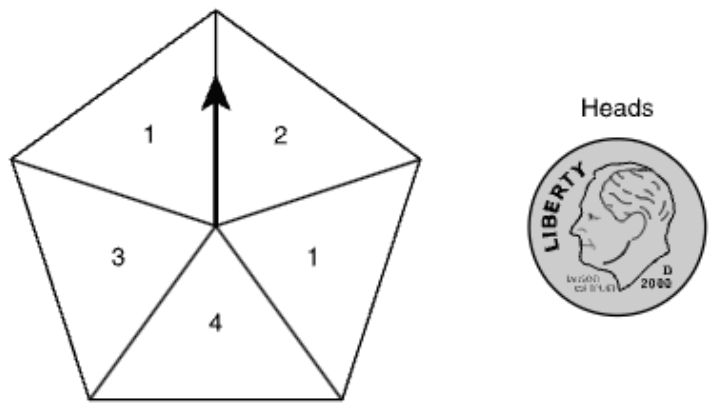
The spinner is spun one time, and the coin is flipped. What is the probability that the spinner lands on 1 and the coin lands on tails?
Select the place on the number line that represents the probability.
On the test you click a point on the number line; here, choose it from the menu.
Show the answer
Correct answer: the point 0.2
The spinner has five equal-sized sections. Two of the sections are labeled with a 1. So, the probability of landing on a 1 is two out of five, or 2/5.
A coin has two sides, one heads and one tails. So, the probability of landing on tails is one out of two, or 1/2.
The compound probability of the spinner landing on a 1 and the coin landing on tails can be calculated by multiplying 2/5 and 1/2 as shown:
Question analysis
A spinner with five equal sections is spun once and a fair coin is flipped. Students find the probability that the spinner lands on 1 and the coin shows tails, then select that point on a number line from 0 to 1. Counting the right sections and combining the two events correctly are the tricky parts.
- Grade level
- Grade 7 content, by NYS standard
- Compared with grade 7
- At grade 7 Finding the chance of two independent events together is grade 7 compound probability, here with one spinner and one coin. Counting sections from the picture and placing the result on a number line add two small steps.
- Estimated difficulty
- Moderate: several steps, or a close reading with one strong distractor.
- Thinking it demands
- Depth of knowledge 2, skills and concepts · mainly apply
- What makes it hard
- Solution
- 3 steps
- Reading level
- Question and choices: about grade 5, 59 words.
- Students, last 30 days
- Not enough answers yet to show (it takes 10).
Why it is hard, traps and wrong answers (shows the answer)
Why it is hard
The probability itself takes one multiplication of two simple fractions; the losses come before and after it. Before, the spinner has to be searched for every section labeled 1, and the coin's chance brought in as well. After, 1/5 has to be rewritten as 2/10 to find its point, since only 0, 1/2 and 1 are labeled. Checking that the result is smaller than both separate chances catches an addition.
Reading a figure, table or graph moderate Understanding the question
The two sections labeled 1, upper left and right, are not side by side, and the number line labels only 0, 1/2 and 1, so its nine points must be read as tenths. (Lesh, Post & Behr, 1987; Kirsch & Mosenthal, 1990)
Something you must already know minor Working it out
Nothing says that the chance of two independent events both happening is the product of their chances, 2/5 × 1/2, rather than their sum. (Anderson & Krathwohl, 2001)
Strategy: Count the sections labeled 1 to get the spinner's chance, take the coin's chance of tails, multiply the two because both must happen, and write the result in tenths.
Traps
- Stops one step early: A choice is a number from partway through the solution.
- Wrong operation: Adds instead of multiplying, divides the wrong way round, turns a ratio or rate upside down, or undoes a step in the wrong direction (subtracts what should be added back).
- Misreads the figure: Reads a value, label or tick spacing in a figure, table or graph wrongly.
The wrong answers, classified
0.4 Stops one step early (King et al., 2004; Gierl et al., 2017)
Finds the spinner's chance of landing on 1, two sections out of five, and plots 2/5 without multiplying by the coin's chance of tails.
0.9 Wrong operation (Hegarty, Mayer & Monk, 1995; King et al., 2004)
Adds the two chances, 2/5 + 1/2 = 9/10, instead of multiplying them, though both events must happen together.
0.1 Misreads the figure (Lesh, Post & Behr, 1987; Kirsch & Mosenthal, 1990)
Counts only one section labeled 1, so multiplies 1/5 by 1/2 and plots 1/10, missing the second 1 on the spinner.
Worked solution, step by step
Formulas used
- Probability of an event
- P is the probability, the chance that something happens. It goes from 0 (never) to 1 (always). The top counts the results you want. The bottom counts all possible results. It works when every result is equally likely, like equal sections of a spinner.
- Probability that two things both happen
- A and B are two events that do not affect each other, like a spin and a coin flip. P(A) and P(B) are their chances. Multiply them to get the chance that both happen. Needing both makes the chance smaller, never bigger.
Sort out the question
The spinner has 5 congruent sections. Congruent means the same size and shape, so each is equally likely. The coin has a heads side and a tails side. You need the chance that the spinner lands on 1 and the coin lands on tails.
Find the spinner’s chance
Two sections show 1: the upper left one and the one on the right. So 2 of the 5 equal sections give a 1:
Watch out: the two 1s are not next to each other. Counting only one gives 1/5 here, and 0.1 at the end.
Find the coin’s chance
A fair coin is equally likely to land on either side. Tails is 1 of its 2 sides:
Multiply the two chances
The spin and the flip do not affect each other, and both must happen. So multiply:
Watch out: stopping at 2/5 gives 0.4. Adding gives , or 0.9. Both are wrong.
Select the point
On the test, the number line labels only 0, 1/2 and 1. Between 0 and 1 are 9 targets, one at each tenth. 0.2 is the second target to the right of 0. On this site, choose 0.2 from the Point menu.
So the answer is the point at 0.2.
Check your answer
List every result. The spinner has 5 sections and the coin has 2 sides, so there are results, all equally likely. Just 2 of them are a 1 with tails, one for each section labeled 1. That is 2 out of 10, or 0.2.
More questions like this
The original DOE question
Question 3 of 27
2026 Practice Test C Math, question 23Question
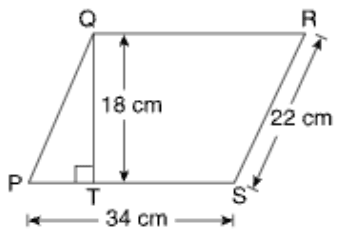
On parallelogram PQRS above, the length of is 18 centimeters. What is the area of the parallelogram?
- A112 sq cm
- B396 sq cm
- C612 sq cm
- D748 sq cm
Show the answer
Correct answer: C
PQRS is a parallelogram in which PS is a base and QT is an altitude. The base is 34 cm in length, and the height is the length of the altitude, so the height is 18 cm.
To determine the area of a parallelogram, multiply the base × the height:
Question analysis
Parallelogram PQRS is drawn with a 34 cm base PS, a 22 cm slanted side and an 18 cm segment QT at a right angle to the base, and students find its area. It tests the area formula for a parallelogram. One labeled length is not needed, so the base and height that go together have to be chosen.
- NYS standards
- 6.G.1 area of polygons
- Grade level
- Grade 6 content, by NYS standard
- Compared with grade 7
- Below grade 7 The area of a parallelogram is grade 6 content, used here once with the height already drawn and labeled. Grade 7 area tasks usually involve circles, composite shapes or scale drawings, so this is easier.
- Estimated difficulty
- Routine: one familiar step, little to misread.
- Thinking it demands
- Depth of knowledge 1, recall and reproduction · mainly apply
- What makes it hard
- Solution
- 1 step
- Reading level
- Question and choices: about grade 5, 25 words.
- Students, last 30 days
- Not enough answers yet to show (it takes 10).
Why it is hard, traps and wrong answers (shows the answer)
Why it is hard
One multiplication answers the question once the right pair of lengths is chosen. Each wrong choice pairs or combines the labeled lengths in another way: the two sides as for a rectangle, the height with the slanted side, or all four sides as a perimeter. Following the right-angle mark at T from QT down to PS identifies the base and height that belong together.
Reading a figure, table or graph minor Understanding the question
Three lengths are labeled, 34 cm, 18 cm and 22 cm, but only the base PS and the height QT meet at the right-angle mark; the slanted side RS is not needed. (Lesh, Post & Behr, 1987; Kirsch & Mosenthal, 1990)
Something you must already know minor Working it out
The formula, base times height, is not given, and the height must be the perpendicular distance between two sides, not the length of a slanted side. (Anderson & Krathwohl, 2001)
Strategy: Multiply the base by the height measured at a right angle to it, and check that the length you use as the height meets that base at a right-angle mark.
Traps
- Wrong formula: Uses a related but wrong formula: perimeter for area, diameter for radius, area for volume, or a misremembered one.
- Information you don't need: The question gives numbers or facts that play no part in the answer.
The wrong answers, classified
A Wrong formula (King et al., 2004)
Adds all four sides, 2 × (34 + 22) = 112, finding the perimeter of the parallelogram instead of its area.
B Misreads the figure (Lesh, Post & Behr, 1987; Kirsch & Mosenthal, 1990)
Multiplies the 18 cm height by the 22 cm slanted side, a pair that does not meet at a right angle, getting 396.
D Wrong formula (King et al., 2004)
Multiplies the two side lengths, 34 × 22 = 748, as if a parallelogram's area were side times side like a rectangle's.
Worked solution, step by step
Formulas used
- Area of a parallelogram
- A is the area. b is the base, the side the shape sits on. h is the height, the straight-up distance from the base to the opposite side, at a right angle to the base. It works because you can cut a triangle off one end, move it to the other end, and make a rectangle.
Sort out the question
PQRS is a parallelogram, a four-sided shape whose opposite sides are parallel. The figure shows three lengths. Side PS, the bottom, is 34 cm. Segment QT goes straight down from Q to PS and is 18 cm. Side RS is slanted and is 22 cm. You need the area, in square centimeters.
Pick the base and the height
The base is PS, 34 cm. The height must meet the base at a right angle. The small square at T shows that QT does. So the height is QT, 18 cm.
Watch out: the 22 cm side is slanted, so it is not the height. Multiplying 22 × 18 gives 396, choice B.
Multiply the base by the height
Use the area formula:
Break it up to multiply:
The area is 612 square centimeters.
Choose the answer
Watch out: 34 × 22 = 748, choice D, treats the shape like a rectangle. Adding all four sides gives 112, choice A. That is the perimeter, the distance around.
So the answer is C, 612 sq cm.
Check your answer
Estimate: 34 is about 30 and 18 is about 20, and . 612 is close. Also, the area must be less than , because the height is shorter than the slanted side.
More questions like this
The original DOE question
Question 4 of 27
2026 Practice Test C Math, question 26Question
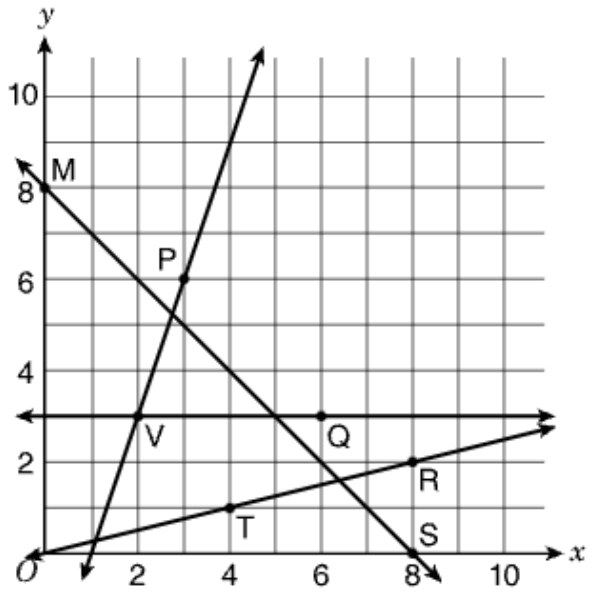
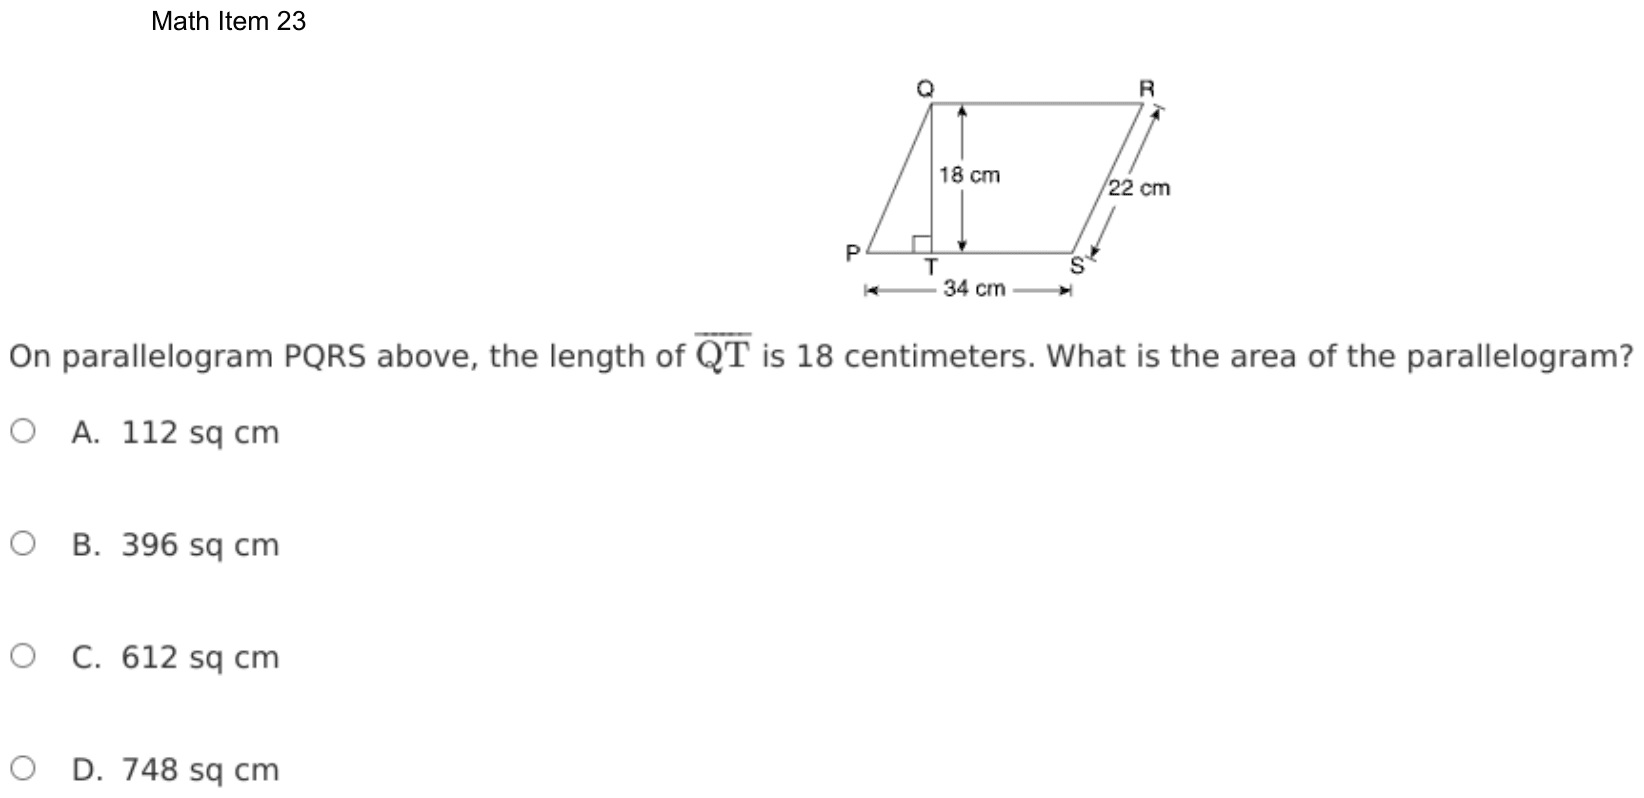
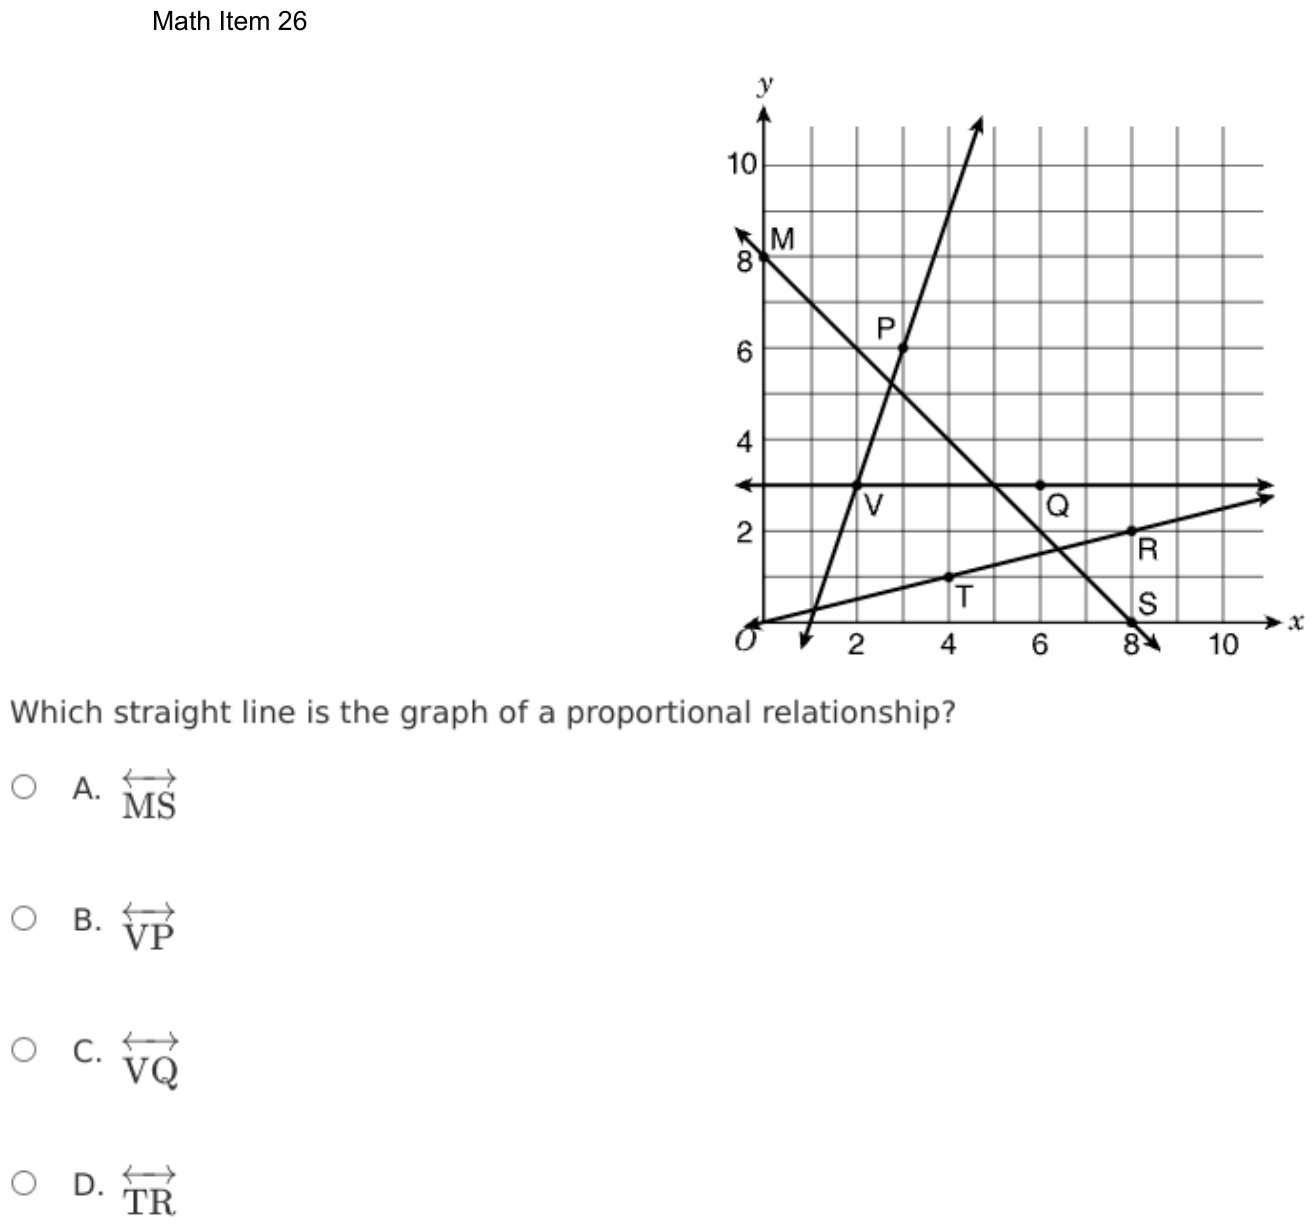
Which straight line is the graph of a proportional relationship?
- A
- B
- C
- D
Show the answer
Correct answer: D
The graph of any proportional line must intersect the origin, .
The only line on the coordinate plane that contains is .
Both point and point have a y-value that is of the x-value, and every point on the line fits the proportional equation .
When . So the line contains the origin, .
Question analysis
A coordinate grid shows four straight lines, each named by two labeled points such as M and S or V and Q, and students choose the one that is the graph of a proportional relationship. It tests recognizing proportional relationships on a graph. Every line is straight, so being straight is not enough, and the lines must be told apart by what defines proportionality.
- NYS standards
- 7.RP.2a testing for proportionality
- Grade level
- Grade 7 content, by NYS standard
- Compared with grade 7
- At grade 7 Deciding from a graph whether a relationship is proportional is a named grade 7 skill, and this is a typical case: four lines on a clean grid, each checked against the same rule, with no calculation needed.
- Estimated difficulty
- Routine: one familiar step, little to misread.
- Thinking it demands
- Depth of knowledge 1, recall and reproduction · mainly understand
- What makes it hard
- Solution
- 1 step
- Reading level
- Question and choices: about grade 9, 14 words.
- Corrected from the DOE handbook
- Coordinates and an equation in the explanation were corrected to match the graph.
- Students, last 30 days
- Not enough answers yet to show (it takes 10).
Why it is hard, traps and wrong answers (shows the answer)
Why it is hard
Once the origin rule is recalled, the graph answers the question at a glance: only the line from O through T and R starts at (0, 0). Students who think of proportional as any steady pattern have three other candidates, from the falling line through M and S to the flat line at height 3. The steep line through V and P is the closest call, because its lower end disappears near the corner where the axes meet.
Something you must already know minor Working it out
The rule that a proportional graph is a straight line through the origin is not printed, and all four lines are straight, so straightness alone rules none of them out. (Anderson & Krathwohl, 2001)
Reading a figure, table or graph minor Understanding the question
Line VP runs off the grid just right of O, crossing the x-axis at (1, 0), so whether it passes through the origin has to be read from the gridlines, not from its general direction. (Lesh, Post & Behr, 1987; Kirsch & Mosenthal, 1990)
Strategy: Recall what every proportional graph must look like, then test each line: see where it would be when x is 0, and whether y divided by x stays the same at both labeled points.
Traps
- Misunderstands the concept: A wrong belief about a concept: that percents can be added, that area grows like length, that averages can be averaged, that a bigger denominator means a bigger fraction.
- Misreads the figure: Reads a value, label or tick spacing in a figure, table or graph wrongly.
The wrong answers, classified
A Misunderstands the concept (Smith, diSessa & Roschelle, 1993; De Bock et al., 1998; Ni & Zhou, 2005)
Takes MS as proportional because it is straight and meets both axes, though it starts at (0, 8) and its y-values fall as x rises.
B Misreads the figure (Lesh, Post & Behr, 1987; Kirsch & Mosenthal, 1990)
Sees the steep line’s lower end vanish near O and assumes it passes through the origin, though VP crosses the x-axis at (1, 0).
C Misunderstands the concept (Smith, diSessa & Roschelle, 1993; De Bock et al., 1998; Ni & Zhou, 2005)
Mistakes the steady y-value of 3 along VQ for a constant of proportionality, though y ÷ x falls from 3/2 at V to 1/2 at Q.
What was corrected from the DOE handbook, and why
- Explanation: The DOE’s explanation says “Both point T (1, 4) and point R (2, 8) have a y-value that is 4 times the x-value, and every point on the line fits the proportional equation y = 4x”, and then “When x = 0, y = 4(0).” On the graph, T is at (4, 1) and R at (8, 2): each y-value is 1/4 of its x-value, and the line through the origin, T and R is y = (1/4)x. (The line y = 4x would pass through (1, 4) and (2, 8), which are not marked.) The 2022–23 guide, which first printed this question with the same graph, has the same slip. The site now gives T (4, 1) and R (8, 2), “a y-value that is 1/4 of the x-value”, y = (1/4)x, and y = (1/4)(0) at x = 0. The answer is unchanged: TR is still the only line through the origin.
Worked solution, step by step
Formulas used
- Proportional relationship
- y and x are two amounts that change together. k is the constant of proportionality: the number you always multiply x by to get y. When x is 0, y is k times 0, which is 0. So the graph is a straight line through the origin, the point (0, 0) where the axes meet.
Sort out the question
The grid shows four straight lines. Each one is named by two labeled points on it: line MS, line VP, line VQ and line TR.
You need the line that shows a proportional relationship. In that kind of relationship, y is always the same number times x. For example, y might always be 3 times x.
Recall what a proportional graph looks like
Use the rule . Put in 0 for x:
So every proportional graph goes through the origin. That is the corner point (0, 0), labeled O, where the two axes meet. The graph must also be a straight line.
All four lines here are straight. So being straight does not settle it. Look for the line through O.
Check where each line starts
- Line MS meets the y-axis at M (0, 8). When x is 0, y is 8, not 0.
- Line VP is steep. Its lower end crosses the x-axis at (1, 0), one unit to the right of O.
- Line VQ is flat at a height of 3. It never comes down to 0.
- Line TR starts at O and runs up through T and R.
Watch out: the lower end of line VP looks close to O. Follow it along the grid lines. It misses O by one unit, so choice B is wrong.
Test the ratio on line TR
In a proportional relationship, the ratio y ÷ x is the same at every point. T is at (4, 1) and R is at (8, 2):
Both give . So each y-value is of its x-value, and the line is .
Watch out: line VQ keeps the same y-value, 3, but not the same ratio. At V it is , and at Q it is . So choice C is wrong.
Give the answer
Line MS starts at 8 on the y-axis, so choice A is out too. Only line TR goes through the origin and keeps y ÷ x the same.
So the answer is D, line TR.
Check your answer
Put the origin into the rule for line TR: . So (0, 0) is on the line. Then test R: , which matches R (8, 2). The rule fits every labeled point on the line.
More questions like this
The original DOE question
Question 5 of 27
2026 Practice Test C Math, question 27Question
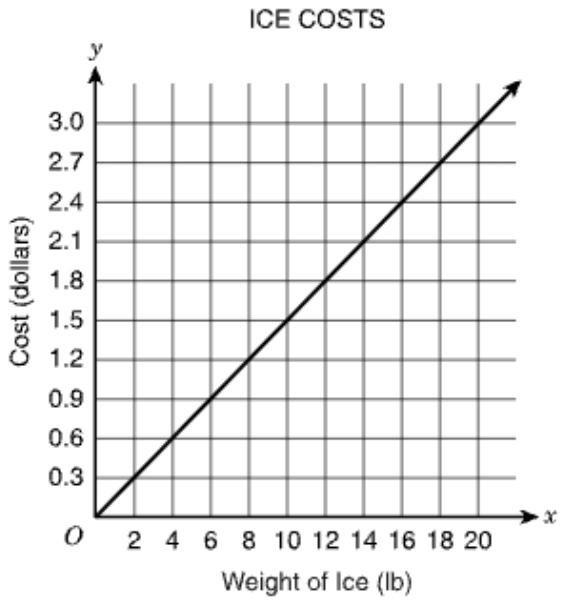
Some friends are buying bags of ice for a picnic. The graph shows the cost of the ice, in dollars, in relation to the weight, in pounds. Which statement about a point on the graph is true?
- AThe point (20, 3) means that 3 lbs of ice costs $20.00.
- BThe point (1, 0.15) means that 1 bag of ice costs $0.15.
- CThe point (10, 1.5) means that 10 lbs of ice costs $1.50.
- DThe point (0, 0) means that 0 lbs of ice will be needed if 0 people go to the picnic.
Show the answer
Correct answer: C
The x-axis represents the weight, in pounds (lbs), of ice purchased, and the y-axis represents the cost of the ice, in dollars.
The x-value in the point (10, 1.5) represents 10 lbs of ice, and the y-value represents 1.5 dollars, or $1.50. Therefore, the cost of 10 lbs of ice is $1.50.
Question analysis
Some friends buying ice for a picnic use a graph of the ice's cost in dollars against its weight in pounds, a straight line from the origin. Students pick the statement that correctly explains what a point on the graph means. Each statement names a point that really is on the line, so the units and the order of the coordinates decide.
- Grade level
- Grade 7 content, by NYS standard
- Compared with grade 7
- At grade 7 Explaining what a point on a proportional graph means in its situation is a named grade 7 skill. The graph is clear and starts at the origin, but each statement has to be read closely against the axis labels.
- Estimated difficulty
- Straightforward: two steps or one careful reading.
- Thinking it demands
- Depth of knowledge 2, skills and concepts · mainly understand
- What makes it hard
- Reading a figure, table or graph moderate
- Every choice must be checked minor
- Solution
- 2 steps
- Reading level
- Question and choices: about grade 2, 77 words.
- Students, last 30 days
- Not enough answers yet to show (it takes 10).
Why it is hard, traps and wrong answers (shows the answer)
Why it is hard
Nothing needs computing, but each statement attaches words to two numbers, and three of them attach the wrong words. The point (1, 0.15) is the unit rate students are trained to look for, and the “bags” in the stem’s story make its statement sound right, though the graph measures pounds. Saying each point aloud as so many pounds for so many dollars exposes the swapped coordinates and the extra people as well.
Reading a figure, table or graph moderate Understanding the question
Each statement must be checked against the axis labels: x is the weight of ice in pounds and y the cost in dollars, on a grid ruled every 2 pounds and every $0.30. (Lesh, Post & Behr, 1987; Kirsch & Mosenthal, 1990)
Every choice must be checked minor Choosing the answer
All four statements name a point that really lies on the line, (1, 0.15) included, so being on the graph rules nothing out; only the meaning given to each coordinate does. (Embretson & Wetzel, 1987)
Strategy: Read both axis labels and their units first, then for each choice say in words what its x-coordinate and its y-coordinate stand for, and compare that with the statement.
Traps
- Misreads the figure: Reads a value, label or tick spacing in a figure, table or graph wrongly.
- Units or scale: The answer is wanted in other units, or a rate or scale must be converted first.
- Misunderstands the concept: A wrong belief about a concept: that percents can be added, that area grows like length, that averages can be averaged, that a bigger denominator means a bigger fraction.
The wrong answers, classified
A Misreads the figure (Lesh, Post & Behr, 1987; Kirsch & Mosenthal, 1990)
Reads the point (20, 3) backward, taking 20 as the price and 3 as the weight, though x counts pounds of ice and y counts dollars.
B Units or scale (King et al., 2004)
Confirms that (1, 0.15) is on the line, the cost of 1 pound, but accepts “1 bag” because the friends buy bags, though the x-axis measures pounds.
D Misunderstands the concept (Smith, diSessa & Roschelle, 1993; De Bock et al., 1998; Ni & Zhou, 2005)
Knows (0, 0) is on every proportional graph and accepts a true-sounding story about people, though the graph never counts people; the point means 0 pounds cost $0.
Worked solution, step by step
Formulas used
- Unit rate
- The cost is in dollars, and the weight is in pounds. The unit rate is the cost of just 1 pound. On a straight line through the origin, it is the same at every point. So you can find it from any point you can read.
Sort out the question
The graph is called ICE COSTS. Read both axes first:
- The x-axis, across the bottom, is the weight of the ice in pounds (lb).
- The y-axis, up the side, is the cost in dollars.
A point is written (x, y), weight first and cost second. So a point means: x pounds of ice cost y dollars. You need the statement that says this correctly.
Find the cost of one pound
The line reaches $3.00 at 20 pounds. Use the unit rate formula:
So 1 pound of ice costs $0.15. This helps you test each point.
Test the point in choice C
Find 10 on the weight axis and go straight up to the line. The line crosses there at 1.5 on the cost axis. The unit rate agrees:
So the point (10, 1.5) means 10 pounds of ice cost $1.50. That is exactly what choice C says.
Check the other statements
Each one names a real point on the line. The problem is the meaning it gives the numbers.
Watch out: choice A reads (20, 3) backward. It means 20 pounds cost $3, not 3 pounds cost $20.
Watch out: choice B is tricky. The point (1, 0.15) is on the line, but the x-axis counts pounds, not bags. So it means 1 pound costs $0.15.
Choice D talks about people, but the graph never counts people. The point (0, 0) means 0 pounds cost $0.
Give the answer
Only choice C gives the right meaning to both numbers.
So the answer is C, 10 lbs of ice costs $1.50.
Check your answer
Use halves. The point (20, 3) says 20 pounds cost $3.00. Half as much ice, 10 pounds, should cost half as much. Half of $3.00 is $1.50. That matches choice C.
More questions like this
The original DOE question
Question 6 of 27
2026 Practice Test C Math, question 31Question
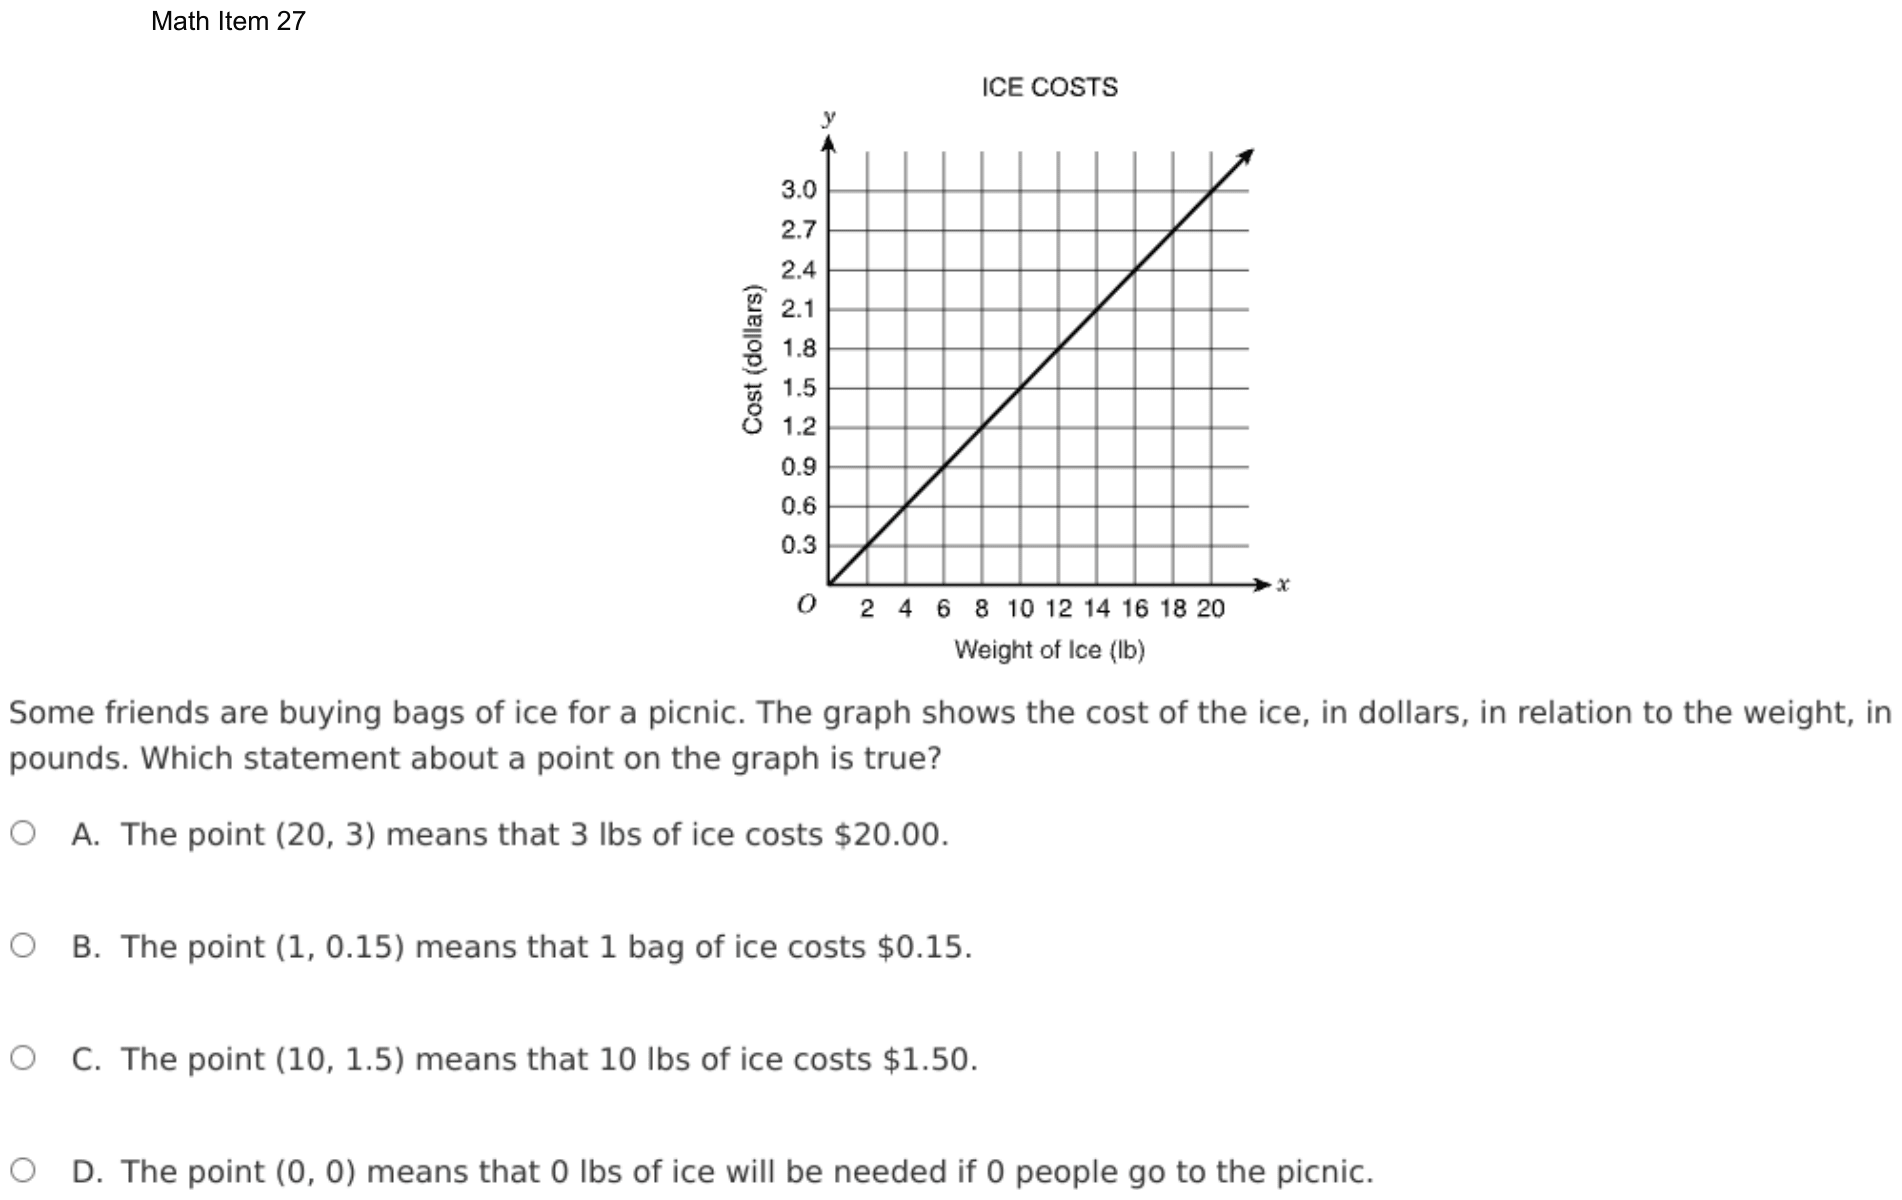
NUMBER OF VISITORS
TO BROOKSIDE ZOO
| Male | Female | |
|---|---|---|
| Children | 360 | 340 |
| Adults | 210 | 290 |
The table above shows the number of people who visited Brookside Zoo in one day. The largest of the four groups made up what percentage of all visitors on that day?
- A30%
- B28%
- C24%
- D17%
Show the answer
Correct answer: A
First, determine the total number of visitors.
The largest group is 360 (Male Children).
Find the percent that represents .
Question analysis
A two-way table counts one day's visitors to Brookside Zoo by age, children or adults, and by male or female. Students find what percent of all visitors the largest of the four groups made up. They must total every cell first, then make sure the count they divide is really the largest one.
- NYS standards
- 6.RP.3c percent as a rate per 100
- Grade level
- Grade 6 content, by NYS standard
- Compared with grade 7
- Below grade 7 Finding what percent one count is of a total is grade 6 work. A two-way table adds two quick steps, totaling the four groups and spotting the largest, but the numbers divide evenly, so it stays below grade 7 demand.
- Estimated difficulty
- Straightforward: two steps or one careful reading.
- Thinking it demands
- Depth of knowledge 1, recall and reproduction · mainly apply
- What makes it hard
- Reading a figure, table or graph minor
- Many steps minor
- Solution
- 3 steps
- Reading level
- Question and choices: about grade 5, 39 words.
- Students, last 30 days
- Not enough answers yet to show (it takes 10).
Why it is hard, traps and wrong answers (shows the answer)
Why it is hard
The arithmetic is friendly, since 360 over 1,200 reduces to 3 over 10, so the work is in reading the table. Two of its cells are close, 340 just below 360, and every wrong choice is the share of one of the other groups. Adding all four counts first, and circling the largest before dividing, keeps the right cell in play.
Reading a figure, table or graph minor Understanding the question
The two-way table gives four separate counts and no totals, so the 1,200 visitors must be added up from the cells and the largest group picked out of a grid. (Lesh, Post & Behr, 1987; Kirsch & Mosenthal, 1990)
Many steps minor Working it out
Three short steps run in order: total the four cells, pick the largest, and divide; using the wrong cell in the last step still gives a believable percent. (Daniel & Embretson, 2010; Enright, Morley & Sheehan, 2002)
Strategy: Add all four cells for the day's total, pick the biggest single cell, and divide it by the total; simplifying the fraction before dividing keeps the arithmetic short.
Traps
- Misreads the question: Misses or misreads a condition or a word in the question: "at least", "each", "remaining", "not".
- Answers a different question: A choice is right for another quantity: the other unknown, the rest instead of the part, the part instead of the whole.
- Misreads the figure: Reads a value, label or tick spacing in a figure, table or graph wrongly.
The wrong answers, classified
B Misreads the figure (Lesh, Post & Behr, 1987; Kirsch & Mosenthal, 1990)
Takes 340, the female children, as the largest cell, misjudging it against the 360 male children beside it, so 340 ÷ 1,200 ≈ 28%.
C Answers a different question (King et al., 2004; Hegarty, Mayer & Monk, 1995)
Answers for the larger adult group, the 290 female adults, as if the question were about adults, so 290 ÷ 1,200 ≈ 24%.
D Misreads the question (Hegarty, Mayer & Monk, 1995)
Reads largest as smallest and uses the 210 male adults, so 210 ÷ 1,200 = 17.5%, and takes the nearest choice.
Worked solution, step by step
Formulas used
- Percent of a whole
- The part is the one group you care about. The whole is everyone. The fraction tells what share of everyone the group is. Multiplying by 100 turns that share into a percent, which means out of 100.
Sort out the question
The table splits one day’s visitors into four groups:
Male Female Children 360 340 Adults 210 290 You need the largest group as a percent of all the visitors. The table gives no total, so you must find it.
Add up all the visitors
Add all four groups to get the whole:
So 1,200 people visited the zoo that day.
Find the largest group
Compare the four numbers. The biggest is 360, the male children.
Watch out: 340 is close to 360, but it is smaller. Using 340 gives about 28%, choice B. Using the 290 female adults gives about 24%, choice C. And 210 is the smallest group, which gives 17.5%, near choice D.
Find the percent
Put the part over the whole. Then simplify by dividing the top and bottom by 120:
Now multiply by 100 to get a percent:
So the male children made up 30% of the visitors.
Give the answer
The largest group, 360 male children, is 30% of all 1,200 visitors.
So the answer is A, 30%.
Check your answer
Work backward. 30% of 1,200 is , the male children. Also, with four groups an even split would be 25% each. The largest group should be a bit more than 25%, and 30% is.
More questions like this
The original DOE question
Question 7 of 27
2026 Practice Test C Math, question 32Question
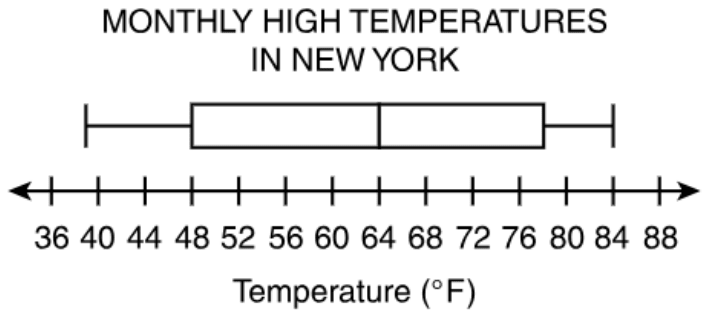
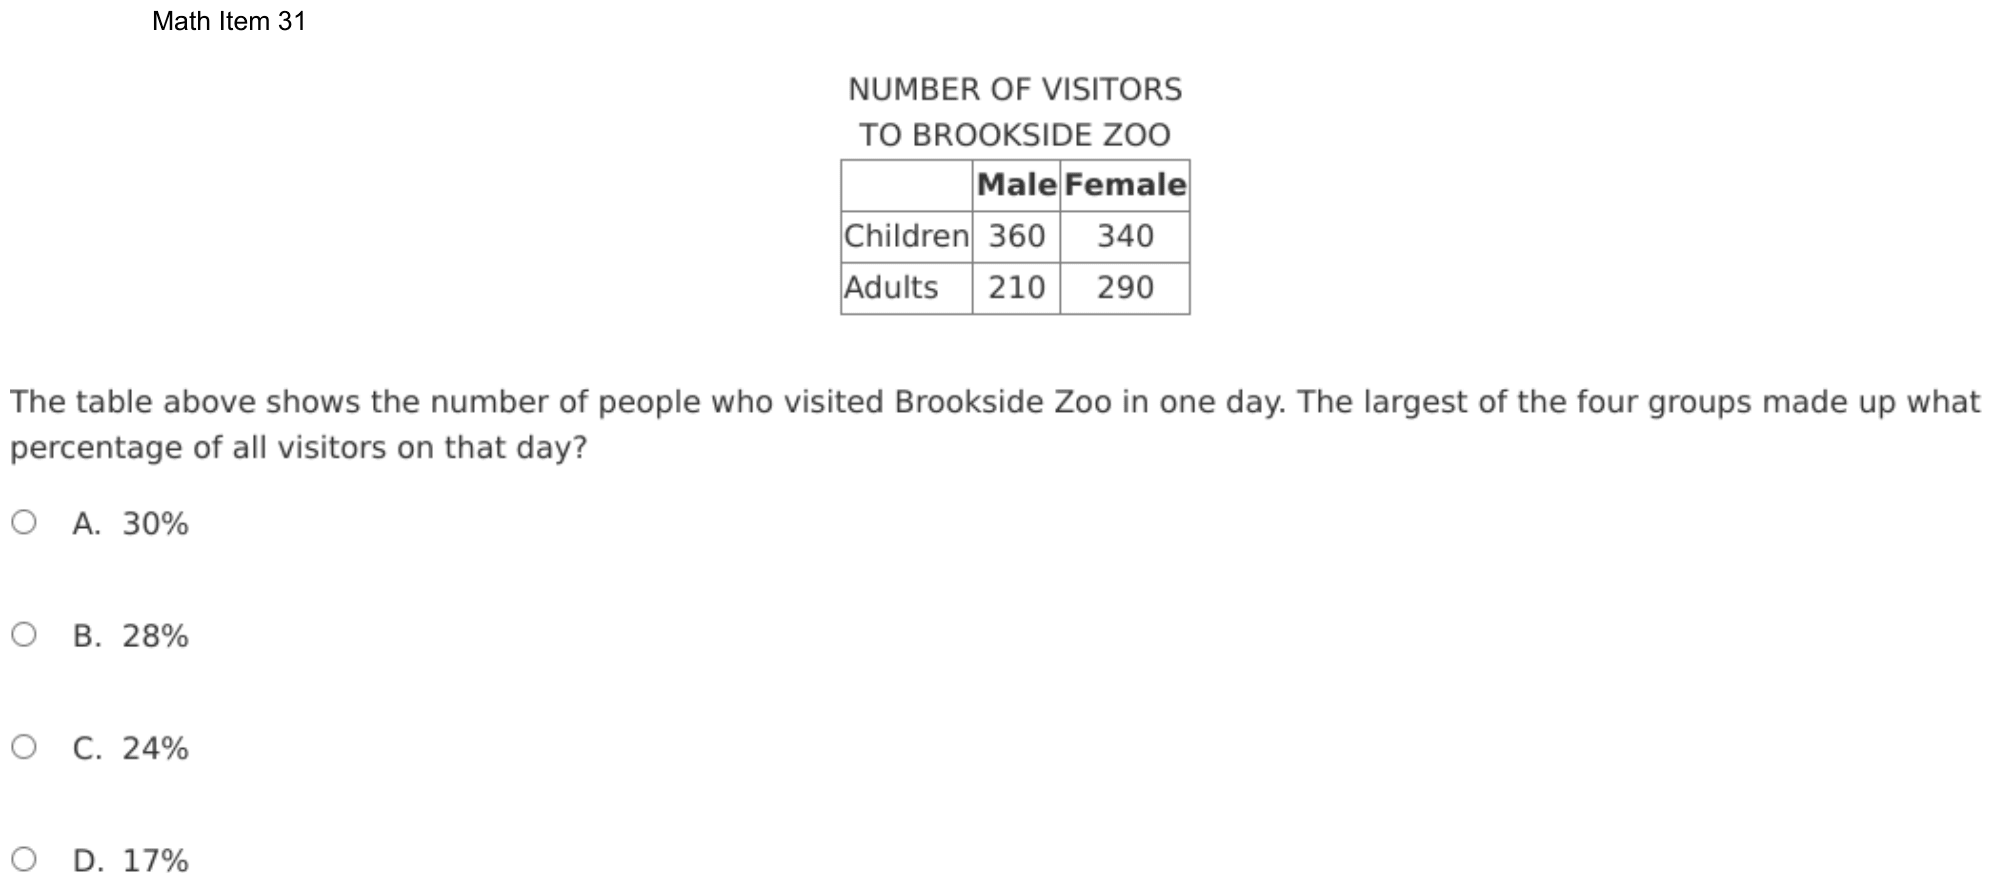
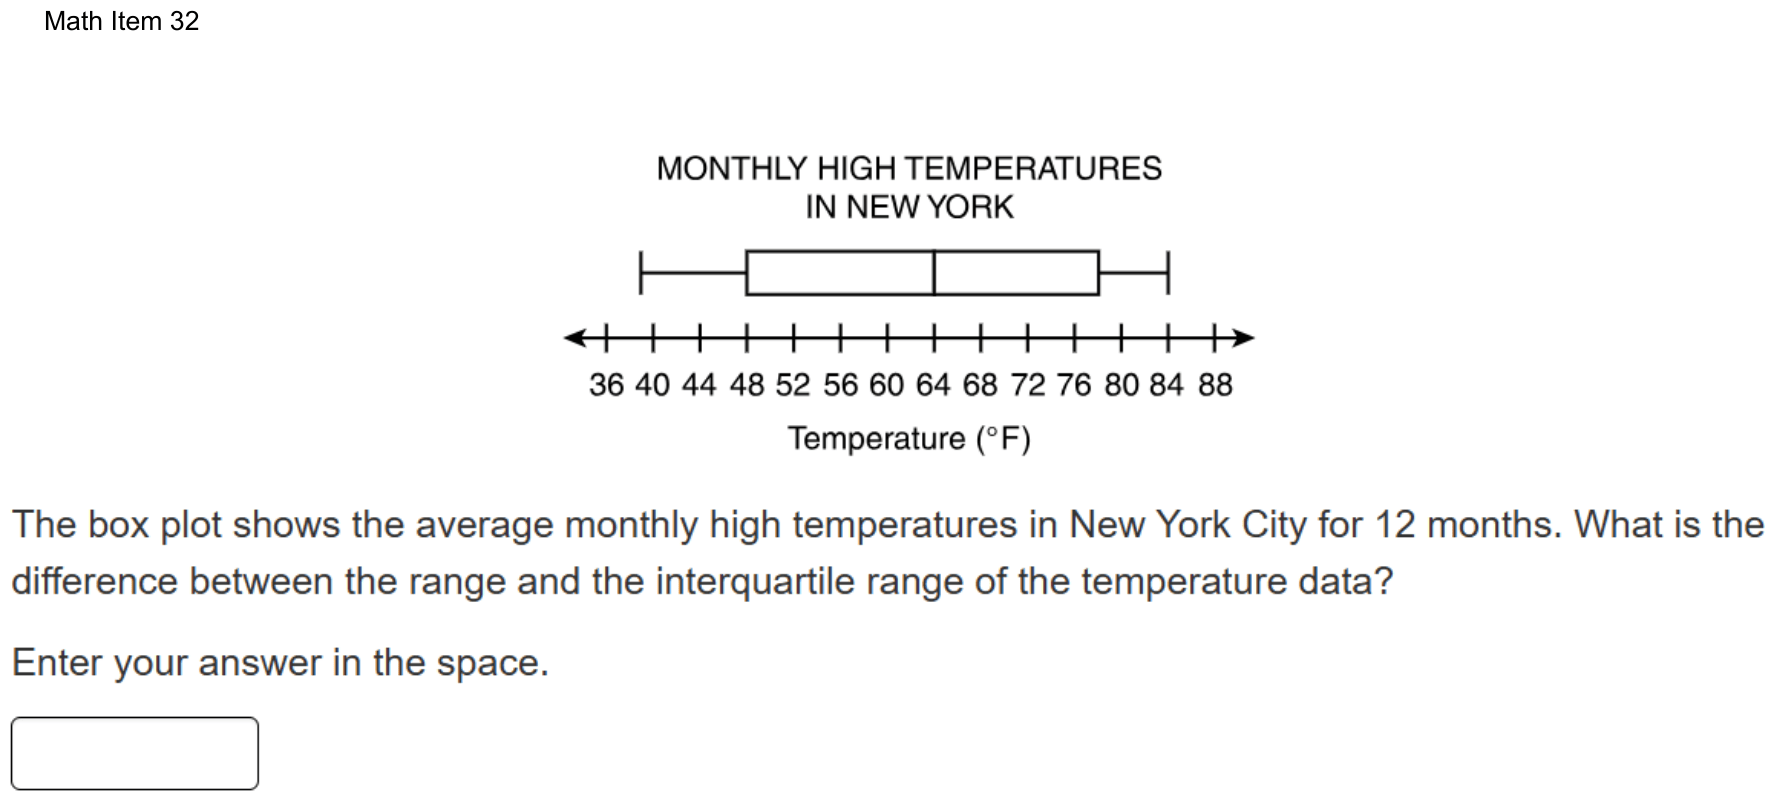
The box plot shows the average monthly high temperatures in New York City for 12 months. What is the difference between the range and the interquartile range of the temperature data?
Enter your answer in the space.
Fill-in question: work out the answer and type it as a number.
Show the answer
Correct answer: 15
Determine the range by subtracting the minimum value on the box plot from the maximum value on the box plot:
Maximum value , Minimum value
Determine the interquartile range by subtracting the lower quartile value on the box plot from the upper quartile value on the box plot:
Upper Quartile Value , Lower Quartile Value
Determine the difference between the range (45° F) and the interquartile range (30° F):
Question analysis
A box plot of New York City's average monthly high temperatures for 12 months sits above a number line labeled every 4 degrees. Students type the difference between the range and the interquartile range of the data. Two of the plot's values fall between labeled ticks, so careful reading of the scale decides the answer.
- Grade level
- Grade 7 content, by NYS standard
- Compared with grade 7
- Above grade 7 Reading a box plot and finding its interquartile range are grade 7 skills. Here two of the five values fall between ticks spaced 4 apart, and the range, the IQR and their difference must all be found and typed with no choices.
- Estimated difficulty
- Hard: combines ideas, needs a plan, and has more than one tempting wrong answer.
- Thinking it demands
- Depth of knowledge 2, skills and concepts · mainly apply
- What makes it hard
- Solution
- 3 steps
- Reading level
- Question and choices: about grade 7, 36 words.
- Students, last 30 days
- Not enough answers yet to show (it takes 10).
Why it is hard, traps and wrong answers (shows the answer)
Why it is hard
The method is standard, but the key rests on reading the scale between its labels. The axis is ticked only every 4 degrees, and the minimum and the upper quartile land off the ticks, so rounding either one to the nearest label moves the result by a degree or two with nothing to flag it. Students who find the range correctly can also stop there, entering 45, the larger of the two spreads, instead of the difference the question asks for.
Reading a figure, table or graph major Understanding the question
Two of the five values fall between ticks spaced 4 degrees apart: the left whisker ends just short of the 40 tick, at 39, and the box’s right edge sits midway between 76 and 80, at 78. (Lesh, Post & Behr, 1987; Kirsch & Mosenthal, 1990)
Many steps minor Working it out
Four values are read and combined in three subtractions, the range, the interquartile range and then their difference, so one misread value changes the final entry. (Daniel & Embretson, 2010; Enright, Morley & Sheehan, 2002)
Something you must already know minor Working it out
Neither measure is defined on the page: the range spans the whiskers, and the interquartile range is the width of the box, the upper quartile minus the lower. (Anderson & Krathwohl, 2001)
An answer in an unexpected form minor Choosing the answer
The result is typed with no choices to compare, so an entry one or two degrees off, from rounding a value to the nearest tick, looks just as finished as the right one. (Enright, Morley & Sheehan, 2002)
Strategy: Read the minimum, both quartiles and the maximum, judging where each mark falls between the ticks, then subtract for the range and for the IQR, and subtract those two results.
Traps
- Misreads the figure: Reads a value, label or tick spacing in a figure, table or graph wrongly.
- Stops one step early: A choice is a number from partway through the solution.
The wrong answers, classified
14 Misreads the figure (Lesh, Post & Behr, 1987; Kirsch & Mosenthal, 1990)
Reads the left whisker’s end as 40, the nearest labeled tick, instead of 39, so the range becomes 84 − 40 = 44 and 44 − 30 = 14.
45 Stops one step early (King et al., 2004; Gierl et al., 2017)
Finds the range, 84 − 39 = 45 degrees, and enters it, stopping before the interquartile range of 30 is subtracted from it.
17 Misreads the figure (Lesh, Post & Behr, 1987; Kirsch & Mosenthal, 1990)
Reads the box’s right edge as 76, the tick just left of it, instead of 78, so the IQR becomes 76 − 48 = 28 and 45 − 28 = 17.
Worked solution, step by step
Formulas used
- Range
- The maximum is the greatest value, at the right end of the right whisker. The minimum is the least value, at the left end of the left whisker. The range tells how far the whole set of data spreads.
- Interquartile range (IQR)
- Q3 is the upper quartile, the right edge of the box. Q1 is the lower quartile, the left edge of the box. The IQR is the width of the box. It tells how far the middle half of the data spreads.
Sort out the question
A box plot shows data with five numbers. The two whiskers are the lines on each side of the box. Their ends are the minimum, the least value, and the maximum, the greatest. The box runs from the lower quartile to the upper quartile. These are the middles of the lower half and the upper half of the data. The line inside the box is the median, the middle value.
You need the range minus the interquartile range (IQR), in degrees.
Read the values between the ticks
The ticks on the number line are 4 degrees apart. So each degree is one quarter of the space between two ticks. Three values sit right on ticks: the box’s left edge at 48, the median at 64, and the right whisker’s end at 84.
- The left whisker starts just left of the 40 tick. It sits about one quarter of the way back toward 36. So the minimum is degrees.
- The box’s right edge is halfway between 76 and 80. Halfway is 78 degrees.
Find the range
Use the range formula:
The data spread over 45 degrees.
Watch out: rounding the minimum to the 40 tick gives a range of 44. Then the final answer comes out 14, which is wrong.
Find the IQR
Use the IQR formula with the two edges of the box:
The middle half of the data spreads over 30 degrees.
Watch out: reading the box’s right edge as 76 gives an IQR of 28. Then the final answer comes out 17.
Subtract the IQR from the range
The question asks for the difference between the two:
Watch out: 45 is only the range. Do not stop there. Type only the number, with no degree sign.
So you would enter 15.
Check your answer
The range covers the whole plot, and the IQR covers only the box. So their difference is the two whiskers added together. The left whisker is degrees long. The right whisker is degrees long. , which matches.
More questions like this
The original DOE question
Question 8 of 27
2026 Practice Test C Math, question 37Question
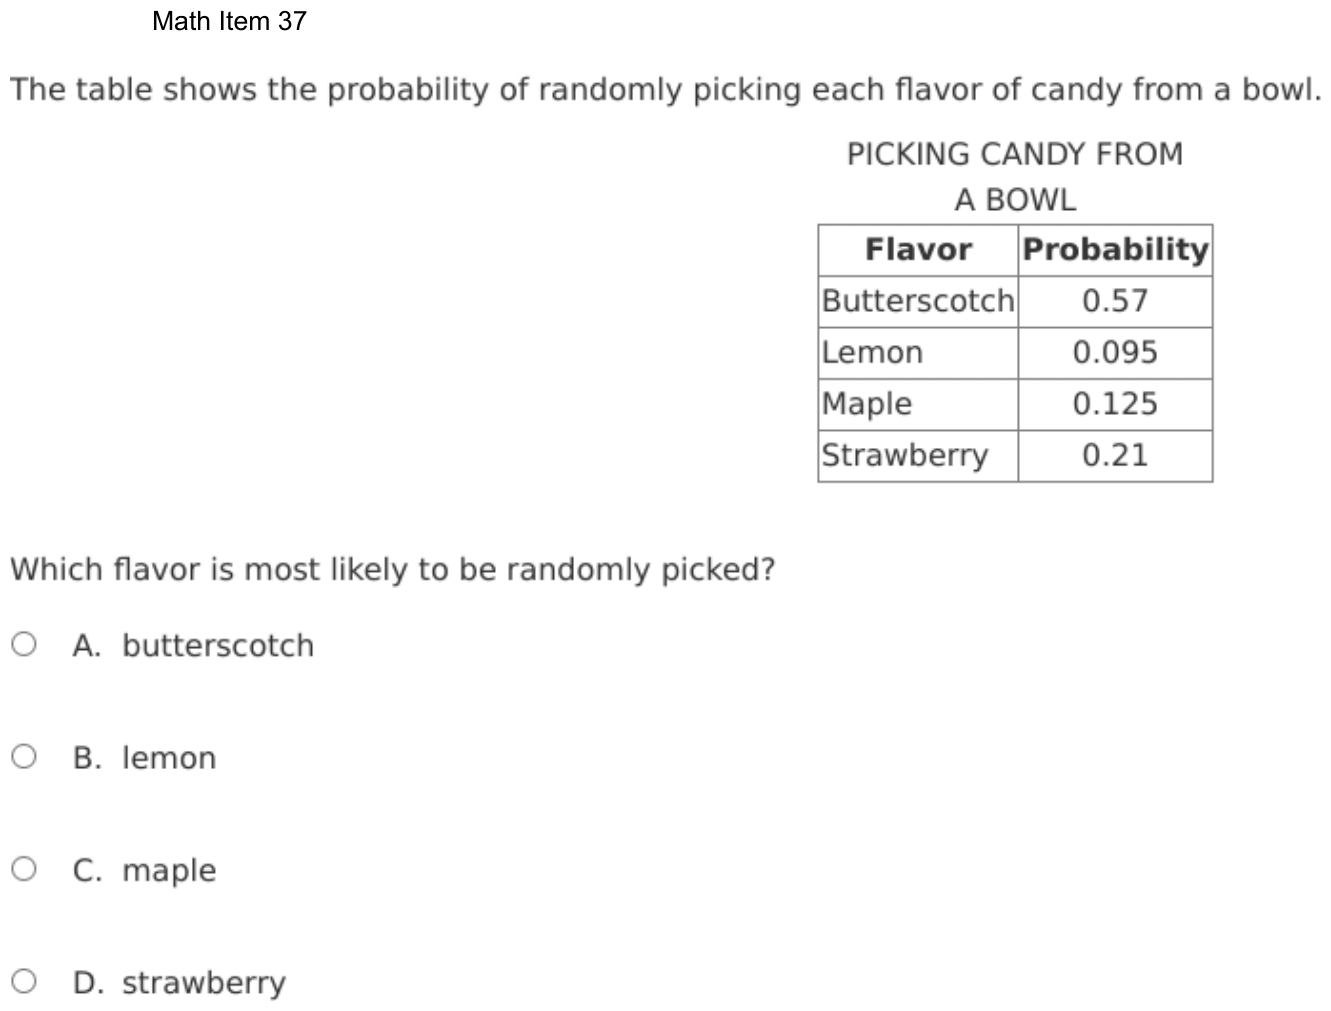
The table shows the probability of randomly picking each flavor of candy from a bowl.
PICKING CANDY FROM
A BOWL
| Flavor | Probability |
|---|---|
| Butterscotch | 0.57 |
| Lemon | 0.095 |
| Maple | 0.125 |
| Strawberry | 0.21 |
Which flavor is most likely to be randomly picked?
- Abutterscotch
- Blemon
- Cmaple
- Dstrawberry
Show the answer
Correct answer: A
The flavor most likely to be picked at random is butterscotch, because its probability is the greatest of the probabilities in the list. More than half the candies in the bowl are butterscotch.
Question analysis
A table lists the probability of picking butterscotch, lemon, maple or strawberry candy at random from a bowl, each as a decimal. Students decide which flavor is most likely to be picked. It tests the meaning of probability and comparing decimals, which have different numbers of digits here and must be compared by place value.
- Grade level
- Grade 6 content, by NYS standard
- Compared with grade 7
- Below grade 7 Reading probabilities as likelihoods is grade 6 content, and this needs only a comparison of four decimals. The one demand is comparing decimals with different numbers of digits, a skill from earlier grades.
- Estimated difficulty
- Routine: one familiar step, little to misread.
- Thinking it demands
- Depth of knowledge 1, recall and reproduction · mainly understand
- What makes it hard
- Error-prone arithmetic minor
- Solution
- 1 step
- Reading level
- Question and choices: about grade 9, 37 words.
- Students, last 30 days
- Not enough answers yet to show (it takes 10).
Why it is hard, traps and wrong answers (shows the answer)
Why it is hard
One idea answers the question: the most likely flavor has the greatest probability. The only obstacle is comparing decimals of different lengths, where 0.125 and 0.095 look bigger than 0.57 to students who count digits. Writing each as thousandths, 570, 95, 125 and 210, or noticing that 0.57 alone is more than one half, makes the order plain.
Error-prone arithmetic minor Working it out
The probabilities have two and three decimal places, 0.57 beside 0.095 and 0.125, so comparing them by length, or by their digits as whole numbers, ranks them wrongly. (Brown & Burton, 1978; Junker & Sijtsma, 2001)
Strategy: Line the four decimals up by place value, adding zeros so each has three decimal places, and compare them digit by digit starting from the tenths place.
Traps
- Misunderstands the concept: A wrong belief about a concept: that percents can be added, that area grows like length, that averages can be averaged, that a bigger denominator means a bigger fraction.
The wrong answers, classified
B Misreads the figure (Lesh, Post & Behr, 1987; Kirsch & Mosenthal, 1990)
Reads lemon’s 0.095 as 0.95, overlooking the 0 in the tenths place, so it looks almost certain and larger than 0.57.
C Misunderstands the concept (Smith, diSessa & Roschelle, 1993; De Bock et al., 1998; Ni & Zhou, 2005)
Treats the decimal with more digits as the larger, or compares 125 with 57 as whole numbers, so 0.125 seems bigger than 0.57.
D Little reason to choose it (Haladyna & Downing, 1993; Rodriguez, 2005)
No common misreading makes 0.21 the largest, since it is neither the longest decimal nor the one with the biggest digits, so it mostly draws guesses.
Worked solution, step by step
Formulas used
- Probability
- P is the probability of picking a flavor. It is a number from 0 to 1. The more candies of a flavor there are, the bigger its probability. So the flavor with the greatest probability is the most likely to be picked.
Sort out the question
The table gives the probability of picking each of four flavors. You need the flavor that is most likely to be picked.
The greater the probability, the more likely the pick. So you need the greatest of the four decimals.
Line up the decimals
The decimals have different numbers of digits. Add zeros at the end so each has three decimal places. This does not change their values:
Flavor Probability Butterscotch 0.570 Lemon 0.095 Maple 0.125 Strawberry 0.210 Compare the tenths digits
Start with the first digit after the decimal point, the tenths place. The tenths digits are 5, 0, 1 and 2. The biggest is 5, so 0.570 is the greatest.
Watch out: 0.125 has more digits than 0.57, but it is smaller. Compare place by place, not by length. That mistake leads to choice C. Also, lemon is 0.095, not 0.95, so choice B is out.
Give the answer
Butterscotch has the greatest probability, 0.57. So it is the flavor most likely to be picked.
So the answer is A, butterscotch.
Check your answer
0.57 is more than 0.5, which is one half. So more than half the candies are butterscotch. The other three flavors add up to , less than half. So butterscotch must be the most likely.
More questions like this
The original DOE question
Question 9 of 27
2026 Practice Test C Math, question 42Question
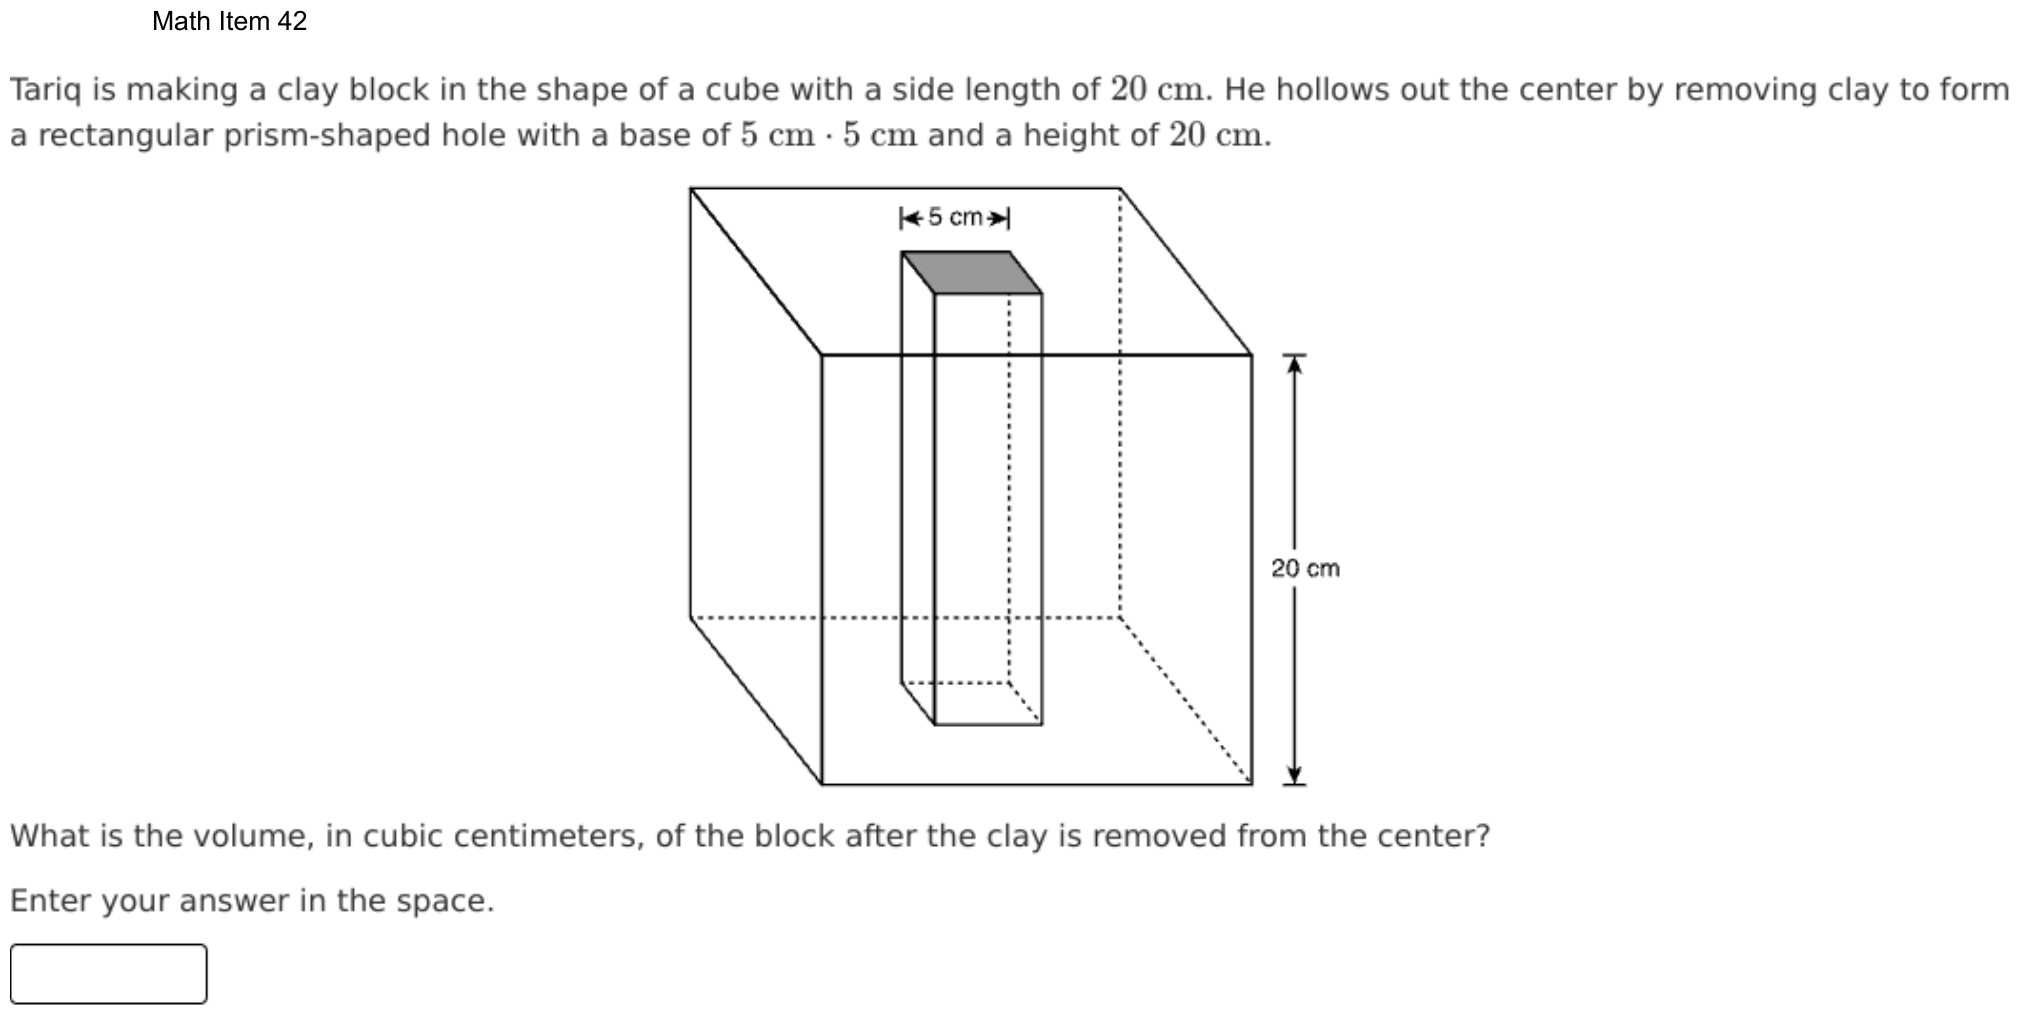
Tariq is making a clay block in the shape of a cube with a side length of . He hollows out the center by removing clay to form a rectangular prism-shaped hole with a base of and a height of .
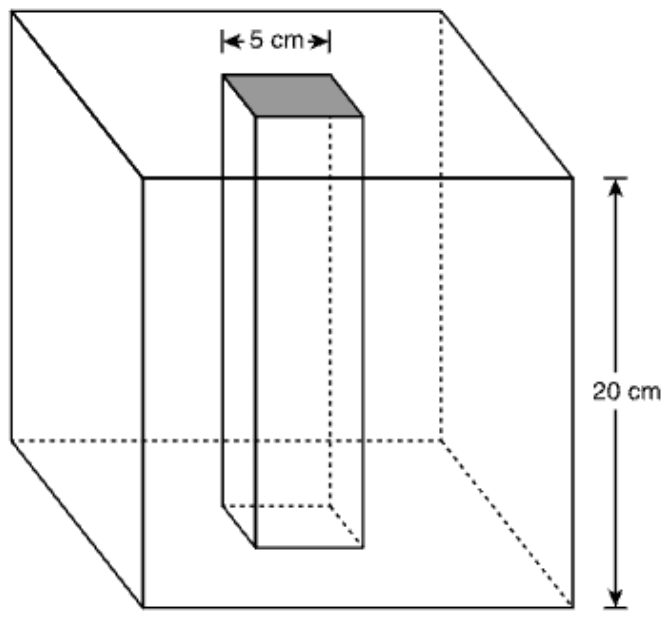
What is the volume, in cubic centimeters, of the block after the clay is removed from the center?
Enter your answer in the space.
Fill-in question: work out the answer and type it as a number.
Show the answer
Correct answer: 7,500
First, find the volume of the cube using the formula .
The length, width, and height of the cube are each equal to 20 cm.
Next, find the volume of the cut-out square prism, with equal length and width of 5 cm and height of 20 cm.
Finally, subtract the volume of the prism from the volume of the cube.
Question analysis
Tariq makes a clay cube 20 centimeters on each side and removes a rectangular prism from its center, with a 5 cm by 5 cm base and a height of 20 cm. Students type the volume of the block that is left, in cubic centimeters. It tests the volume of rectangular prisms, and the hole's size must be read carefully from the words and figure.
- Grade level
- Grade 7 content, by NYS standard
- Compared with grade 7
- At grade 7 Finding the volume of a solid made from rectangular prisms, here by taking one away, is named in the grade 7 standards. This is a direct case with whole numbers, two volumes and one subtraction.
- Estimated difficulty
- Straightforward: two steps or one careful reading.
- Thinking it demands
- Depth of knowledge 1, recall and reproduction · mainly apply
- What makes it hard
- Solution
- 3 steps
- Reading level
- Question and choices: about grade 8, 66 words.
- Students, last 30 days
- Not enough answers yet to show (it takes 10).
Why it is hard, traps and wrong answers (shows the answer)
Why it is hard
This is a direct composite-volume problem with whole numbers: one cube, one hole, one subtraction. What it checks is that both volumes are real volumes, the hole as tall as the cube, and that the subtraction is done at the end. Students who stop at the hole’s volume, or who subtract only the square face, give amounts that are easy to type and hard to doubt without choices.
Something you must already know minor Working it out
The volume of a rectangular prism, length times width times height, is not given, and it is needed twice, once for the 20 cm cube and once for the hole. (Anderson & Krathwohl, 2001)
Reading a figure, table or graph minor Understanding the question
The figure labels only the 5 cm opening and the cube’s 20 cm edge; the hole’s 20 cm height comes from the words, while the drawing shows it reaching from top to bottom. (Lesh, Post & Behr, 1987; Kirsch & Mosenthal, 1990)
An answer in an unexpected form minor Choosing the answer
The volume is typed with no choices to compare, so the hole’s 500 cubic centimeters or the cube’s 8,000 can be entered without any warning. (Enright, Morley & Sheehan, 2002)
Strategy: Find the volume of the full cube, then the volume of the square hole that runs from the top face to the bottom, and subtract the hole from the cube.
Traps
- Answers a different question: A choice is right for another quantity: the other unknown, the rest instead of the part, the part instead of the whole.
- Misreads the figure: Reads a value, label or tick spacing in a figure, table or graph wrongly.
- Wrong formula: Uses a related but wrong formula: perimeter for area, diameter for radius, area for volume, or a misremembered one.
The wrong answers, classified
500 Answers a different question (King et al., 2004; Hegarty, Mayer & Monk, 1995)
Finds the volume of the hole, 5 × 5 × 20 = 500 cubic centimeters, and gives the clay removed instead of the clay that is left.
7,875 Misreads the figure (Lesh, Post & Behr, 1987; Kirsch & Mosenthal, 1990)
Treats the hole as a 5 cm cube, 5 × 5 × 5 = 125, though it runs the full 20 cm height, so 8,000 − 125 = 7,875.
7,975 Wrong formula (King et al., 2004)
Subtracts only the area of the square opening, 5 × 5 = 25, from the cube’s 8,000, mixing a face’s area with the hole’s volume.
Worked solution, step by step
Formulas used
- Volume of a rectangular prism
- V is the volume, the space inside a solid. l is the length, w is the width and h is the height. A cube is a prism with all three the same. Volume is measured in cubic centimeters, tiny cubes 1 cm on each side.
Sort out the question
Tariq’s block starts as a cube 20 cm on each side. He removes a hole shaped like a rectangular prism, a box shape with flat rectangle sides. Its base is 5 cm by 5 cm, and its height is 20 cm. The figure shows it running from the top face to the bottom face.
You need the volume of the clay that is left, in cubic centimeters.
Find the volume of the cube
Use the volume formula. The length, width and height are all 20 cm:
The full cube holds 8,000 cubic cm of clay.
Find the volume of the hole
The hole is a prism too. Its length and width are 5 cm, and its height is 20 cm:
So 500 cubic cm of clay are removed.
Watch out: the hole is 20 cm tall, not 5 cm. Treating it as a small 5 cm cube gives 125 and the wrong answer 7,875. And 5 × 5 = 25 is only the area of the opening, not a volume. Subtracting it gives 7,975, also wrong.
Subtract the hole from the cube
The clay left is the cube minus the hole:
The block has 7,500 cubic cm of clay left.
Watch out: 500 is the clay taken out, not the clay that is left.
Enter the number
Type only the number, with no units. You can type 7500 or 7,500.
So you would enter 7,500.
Check your answer
Think of the cube as 20 flat layers, each 1 cm thick. Each layer is a 20 by 20 square, 400 square cm, with a 5 by 5 hole, 25 square cm. So each layer holds cubic cm of clay. Then . It matches.
More questions like this
The original DOE question
Question 10 of 27
2026 Practice Test C Math, question 48Question
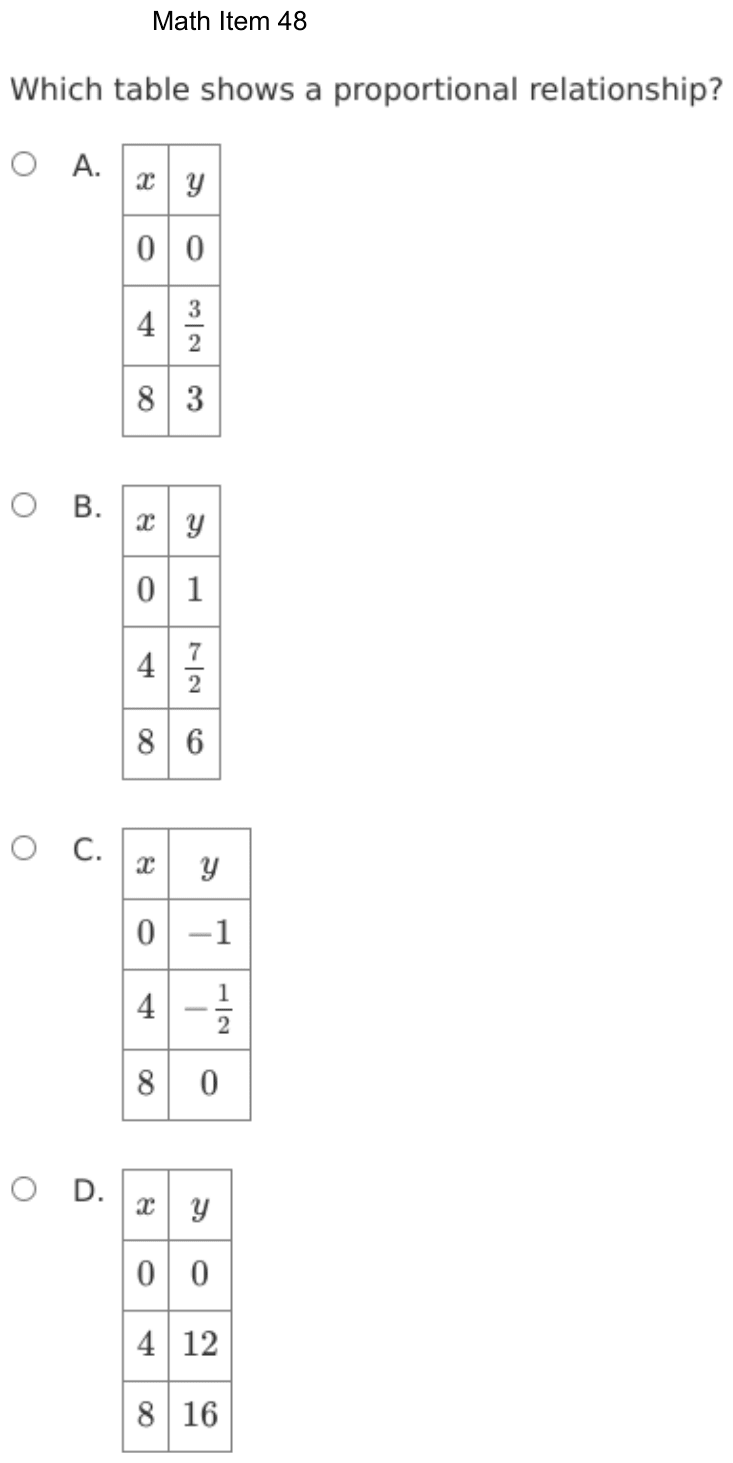
Which table shows a proportional relationship?
- A
x y 0 0 4 8 3 - B
x y 0 1 4 8 6 - C
x y 0 −1 4 8 0 - D
x y 0 0 4 12 8 16
Show the answer
Correct answer: A
The first table is the only one with a constant of proportionality, .
In each ordered pair, .
Question analysis
Four tables each give y for x = 0, 4 and 8, with some values written as fractions or negatives. Students choose the table that shows a proportional relationship. It tests recognizing proportional relationships from a table, which means checking every row against one rule rather than judging by the pattern.
- Grade level
- Grade 7 content, by NYS standard
- Compared with grade 7
- At grade 7 Deciding from a table whether a relationship is proportional is a core grade 7 skill. The fractions and negative values in the tables make each ratio a careful check rather than a glance.
- Estimated difficulty
- Straightforward: two steps or one careful reading.
- Thinking it demands
- Depth of knowledge 2, skills and concepts · mainly apply
- What makes it hard
- Every choice must be checked moderate
- Error-prone arithmetic minor
- Solution
- 2 steps
- Reading level
- Question and choices: about grade 9, 13 words.
- Students, last 30 days
- Not enough answers yet to show (it takes 10).
Why it is hard, traps and wrong answers (shows the answer)
Why it is hard
Two quick tests decide proportionality, and the tables are built so that each test alone lets a wrong table through. The last table starts at (0, 0) like the right one, while the middle two grow by equal steps like the right one. Only checking that y ÷ x is the same in every row with x not 0 separates the one table whose ratio stays at 3/8.
Every choice must be checked moderate Choosing the answer
Each table has to be tested row by row, and two of them start at (0, 0), so the opening row settles nothing; only y ÷ x in the other rows separates them. (Embretson & Wetzel, 1987)
Error-prone arithmetic minor Working it out
The y-values include 3/2, 7/2 and −1/2, so the ratios mean dividing fractions by 4, such as (3/2) ÷ 4 = 3/8, and comparing them with 3 ÷ 8. (Brown & Burton, 1978; Junker & Sijtsma, 2001)
Strategy: For each table, divide y by x in every row where x is not zero, and check that the quotient never changes and that y is 0 when x is 0.
Traps
- Misunderstands the concept: A wrong belief about a concept: that percents can be added, that area grows like length, that averages can be averaged, that a bigger denominator means a bigger fraction.
- Checks only one number: Tries one value in each choice and takes the first that works, when that value happens to work for a wrong choice too; a second value would rule it out.
The wrong answers, classified
B Misunderstands the concept (Smith, diSessa & Roschelle, 1993; De Bock et al., 1998; Ni & Zhou, 2005)
Sees y rise by the same 5/2 each time x rises by 4 and takes the steady change as proportional, missing that y is 1 when x is 0.
C Misreads the figure (Lesh, Post & Behr, 1987; Kirsch & Mosenthal, 1990)
Spots a 0 in the y column and a steady rise of 1/2, but that 0 belongs to x = 8, while at x = 0 the table gives −1.
D Checks only one number (Schoenfeld, 1985)
Checks only the row (0, 0), which every proportional table has, or only 12 ÷ 4 = 3, without testing 16 ÷ 8 = 2 in the last row.
Worked solution, step by step
Formulas used
- Proportional relationship
- y and x are the two amounts in each row. k is the constant of proportionality, the same number in every row. Two tests follow from it. When x is 0, y must be 0. And y ÷ x must equal k in every row where x is not 0.
Sort out the question
Each table gives y for x = 0, 4 and 8. You need the one that shows a proportional relationship. That means y is always the same number times x.
Use two tests. First, y must be 0 when x is 0. Second, y ÷ x must be the same in the other rows.
Test the row where x is 0
Look at the top row of each table:
- Table A: y = 0. It passes.
- Table B: y = 1. It fails.
- Table C: y = −1. It fails.
- Table D: y = 0. It passes.
Watch out: tables B and C go up by equal steps. Steady steps are not enough, because they do not start at 0. Table C does have a 0, but it is next to x = 8.
Test the ratio in table A
Divide y by x. Dividing by 4 is the same as multiplying by :
Both rows give . Table A passes both tests.
Test the ratio in table D
Divide y by x in the same way:
The ratios are different, so table D is not proportional.
Watch out: table D starts at (0, 0) like a proportional table. If you check only that row, or only the row with 4, you will pick choice D.
Give the answer
Only table A starts at (0, 0) and keeps y ÷ x the same.
So the answer is A, the table with y = 0, and 3.
Check your answer
Use the rule for table A, . When x = 4, . When x = 8, . Both match. Doubling x from 4 to 8 also doubles y.
More questions like this
The original DOE question
Question 11 of 27
2026 Practice Test D Math, question 12Question
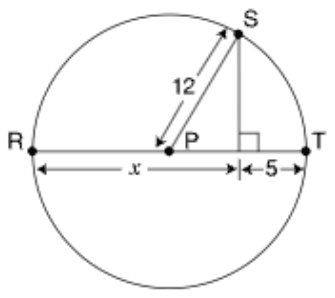
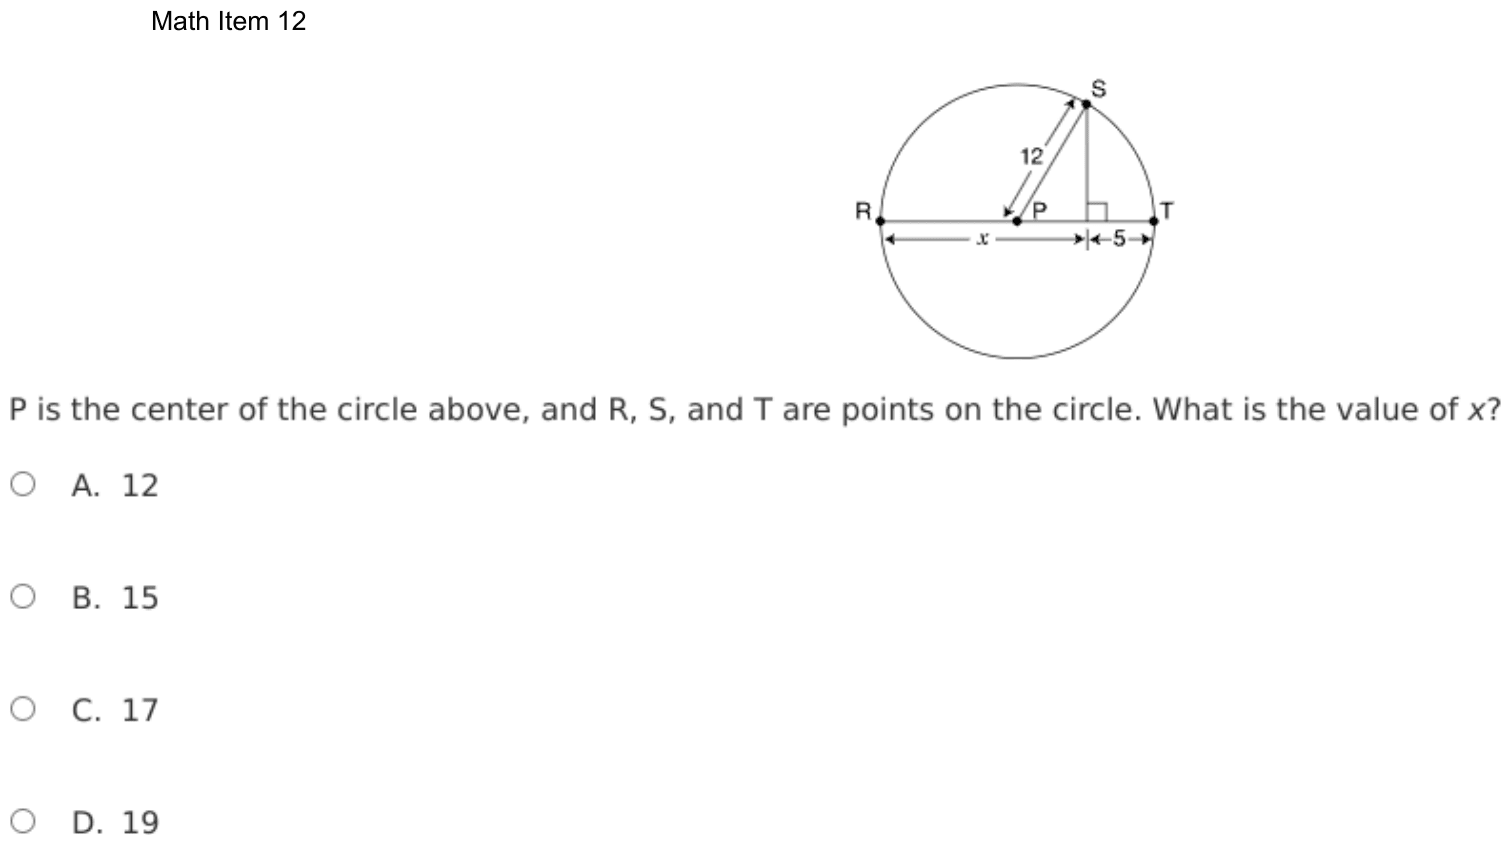
P is the center of the circle above, and R, S, and T are points on the circle. What is the value of x?
- A12
- B15
- C17
- D19
Show the answer
Correct answer: D
represents the radius of the circle and has length 12.
Both and are radii and also have length 12.
Therefore, the length of , which is a diameter, is 24 and is also represented by .
Question analysis
A circle with center P has points R, S and T on it, a segment SP labeled 12, and a vertical segment from S that splits RT into a piece labeled x and a piece labeled 5. Students find the value of x. It tests basic circle facts, and the challenge is seeing which lengths in the figure must be equal.
- Grade level
- Grade 7 content, by NYS standard
- Compared with grade 7
- At grade 7 Grade 7 circle work centers on area and circumference formulas. This needs only the fact that every radius has the same length, but spotting which segments are radii in a figure with extra markings is less routine than using a formula.
- Estimated difficulty
- Moderate: several steps, or a close reading with one strong distractor.
- Thinking it demands
- Depth of knowledge 2, skills and concepts · mainly apply
- What makes it hard
- Reading a figure, table or graph moderate
- No obvious method minor
- Solution
- 2 steps
- Reading level
- Question and choices: about grade 3, 24 words.
- Students, last 30 days
- Not enough answers yet to show (it takes 10).
Why it is hard, traps and wrong answers (shows the answer)
Why it is hard
The figure gives one measurement on a slanted radius and two labels on the diameter, and the right angle at the foot of the vertical segment is a decoy. Once RP and PT are seen as radii, RT is 24, and x is that diameter less the 5. Students who never connect the slanted 12 to the horizontal line fall back on the labeled numbers, adding 12 and 5, or take x to end at the center.
Reading a figure, table or graph moderate Understanding the question
The 12 labels the slanted segment SP, not the horizontal one, and the arrow for x runs from R past the center P to the foot of the vertical segment, so x is neither a radius nor a whole diameter. (Lesh, Post & Behr, 1987; Kirsch & Mosenthal, 1990)
No obvious method minor Working it out
The right-angle mark and the triangle under S suggest the Pythagorean theorem, which is no help; the way in is seeing that RP and PT are radii as well. (Schoenfeld, 1985)
Strategy: Mark every segment from P to the circle as 12, notice that R and T are the ends of a diameter, then write an equation for that diameter using x and the 5.
Traps
- Misreads the figure: Reads a value, label or tick spacing in a figure, table or graph wrongly.
- Information you don't need: The question gives numbers or facts that play no part in the answer.
- Numbers taken from the question: Combines the numbers in the question without a model of the situation, or is simply a number that appears in the question.
The wrong answers, classified
A Misreads the figure (Lesh, Post & Behr, 1987; Kirsch & Mosenthal, 1990)
Reads x as the radius RP, as if its arrow ended at the center P, though it runs past P to the foot of the vertical segment.
B Trusting the picture (Lesh, Post & Behr, 1987)
Judges x from the drawing, where it looks about three times as long as the piece labeled 5, instead of working from the radius of 12.
C Numbers taken from the question (Hegarty, Mayer & Monk, 1995)
Adds the two labeled numbers, 12 + 5 = 17, without placing the 12 on the diameter, as if x were a radius plus the 5.
Worked solution, step by step
Formulas used
- Radius and diameter
- r is the radius, the distance from the center to any point on the circle. d is the diameter, the distance straight across the circle through the center. A diameter is two radii laid end to end, one on each side of the center, so it is twice as long.
Sort out the question
P is the center of the circle, and R, S and T are on the circle. Segment SP is 12. Segment RT goes straight across through P. A short line from S meets RT at a right angle. It splits RT into x, from R to that point, and 5, from that point to T. You need x.
See that SP is a radius
SP runs from the center P to the point S on the circle. So SP is a radius, and the radius is 12. Every radius of a circle has the same length. RP and PT also run from the center to the circle, so RP = 12 and PT = 12.
Find the diameter RT
RT passes through the center, so it is a diameter. Use the formula with r = 12:
RT is 24 long. It is the radius RP plus the radius PT.
Solve for x
RT is also split into x and 5, so:
Subtract 5 from both sides:
Watch out: x runs from R past the center P, so it is longer than a radius. Reading it as 12, choice A, stops at P. Adding 12 + 5 = 17, choice C, puts the 12 in the wrong place.
Work from the numbers, not the picture
The figure is not drawn to scale. In it, x looks about three times as long as 5, which suggests 15, choice B. Trust the labels instead. The right triangle under S is not needed at all.
So the answer is D, 19.
Check your answer
The point where the short line meets RT is 19 from R. P is 12 from R, so that point is 19 − 12 = 7 past the center. Then 7 + 5 = 12, which is PT, a radius. Everything fits.
More questions like this
The original DOE question
Question 12 of 27
2024 Test A Math, question 21Question
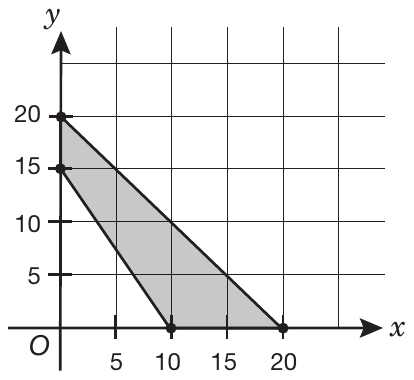
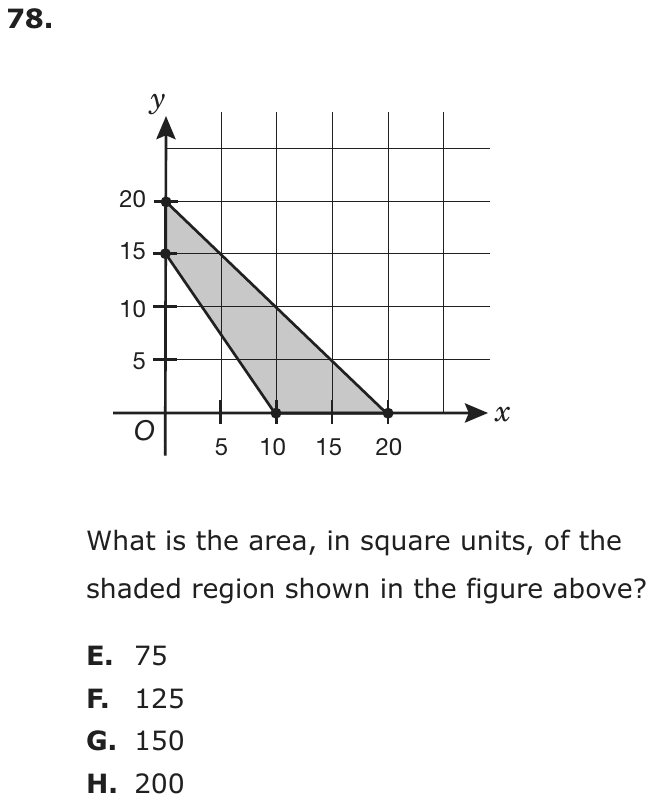
What is the area, in square units, of the shaded region shown in the figure above?
- A75
- B125
- C150
- D200
Show the answer
Correct answer: B
The area of the shaded region, in square units, is the area of the triangle created by the shaded and unshaded regions minus the area of the triangle created by the unshaded region.
The area of the triangle created by the shaded and unshaded regions is 200 square units.
The area of the triangle created by the unshaded region is 75 square units.
Subtract to find the area of the shaded region.
Question analysis
A coordinate geometry question: two line segments cross a grid, one from (0, 20) to (20, 0) and one from (0, 15) to (10, 0), and the region between them is shaded. Students find the shaded area. The shape is not a standard figure, so they need to see it as one triangle with another removed.
- Grade level
- Grade 6 content, by NYS standard
- Compared with grade 7
- At grade 7 Area of triangles is grade 6 content; finding a composite area by subtraction is the kind of task grade 7 students meet regularly. Points on the axes make every length easy to read.
- Estimated difficulty
- Straightforward: two steps or one careful reading.
- Thinking it demands
- Depth of knowledge 2, skills and concepts · mainly apply
- What makes it hard
- Reading a figure, table or graph moderate
- No obvious method minor
- Something you must already know minor
- Solution
- 3 steps
- Reading level
- Question and choices: about grade 6, 16 words.
- Students, last 30 days
- Not enough answers yet to show (it takes 10).
Why it is hard, traps and wrong answers (shows the answer)
Why it is hard
The shaded shape has no name, so the question is about seeing it as a difference of two right triangles whose legs lie on the axes. Once that is seen, both areas are one-line calculations. The wrong choices come from stopping after either triangle or from pairing a base from one segment with a height from the other.
Reading a figure, table or graph moderate Understanding the question
All four lengths come from where the two segments meet the axes, at 20 and 15 on the y-axis and at 10 and 20 on the x-axis, read against grid lines 5 units apart. (Lesh, Post & Behr, 1987; Kirsch & Mosenthal, 1990)
No obvious method minor Working it out
The shaded region is a four-sided shape with no formula of its own; it has to be seen as the large triangle with the small one removed. (Schoenfeld, 1985)
Something you must already know minor Working it out
The area of a triangle, one half of base times height, is assumed and not given. (Anderson & Krathwohl, 2001)
Strategy: Find the area of the large right triangle under the outer segment and subtract the area of the smaller triangle under the inner segment, reading the legs from the axes.
Traps
- Stops one step early: A choice is a number from partway through the solution.
- Answers a different question: A choice is right for another quantity: the other unknown, the rest instead of the part, the part instead of the whole.
- Misreads the figure: Reads a value, label or tick spacing in a figure, table or graph wrongly.
The wrong answers, classified
A Answers a different question (King et al., 2004; Hegarty, Mayer & Monk, 1995)
Finds the area of the small unshaded triangle, 1/2 × 10 × 15 = 75, and gives that region instead of the shaded one.
C Misreads the figure (Lesh, Post & Behr, 1987; Kirsch & Mosenthal, 1990)
Pairs the outer segment's x-intercept, 20, with the inner segment's y-intercept, 15, as if they bounded one triangle: 1/2 × 20 × 15 = 150.
D Stops one step early (King et al., 2004; Gierl et al., 2017)
Finds the area of the large triangle, 1/2 × 20 × 20 = 200, and stops before subtracting the unshaded triangle inside it.
Worked solution, step by step
Formulas used
- Area of a triangle
- A is the area. b is the base, the side the triangle sits on. h is the height: the straight-up distance from the base to the top corner, at a right angle to the base. You take half because a triangle is half of a rectangle with the same base and height.
Sort out the figure
The grid lines are 5 units apart. Two slanted segments run from the y-axis down to the x-axis. The outer one goes from 20 on the y-axis to 20 on the x-axis. The inner one goes from 15 on the y-axis to 10 on the x-axis. The shaded region is the strip between them. You need its area, in square units.
See the shape as two triangles
The shaded region has four sides, and it has no simple formula. But look at the big triangle under the outer segment, with its corner at O. It is the shaded strip plus the small white triangle. So the shaded area is the big triangle minus the small one.
Find the area of the big triangle
The big triangle has a right angle at O. Its base runs along the x-axis from 0 to 20, so it is 20 units. Its height runs up the y-axis from 0 to 20, so it is 20 units.
Watch out: this is the whole big triangle. Stopping here gives 200, choice D.
Find the area of the small triangle
The small triangle also has its right angle at O. Its base is 10 units, from 0 to 10 on the x-axis. Its height is 15 units, from 0 to 15 on the y-axis.
Watch out: 75 is the white triangle, choice A, not the shaded part. Also, pair the base and height of the same triangle. Mixing 20 and 15 gives 150, choice C.
Subtract to find the shaded area
Take the small white triangle away from the big triangle.
The shaded area is 125 square units. So the answer is B, 125.
Check your answer
In the figure, the shaded strip looks bigger than the white triangle. So the shaded area should be more than half of the big triangle, which is . 125 is more than 100. And , the whole big triangle.
More questions like this
The original DOE question
Question 13 of 27
2024 Test A Math, question 26Question
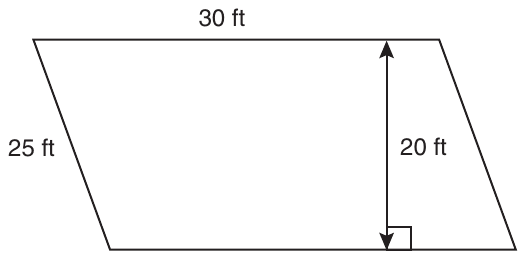
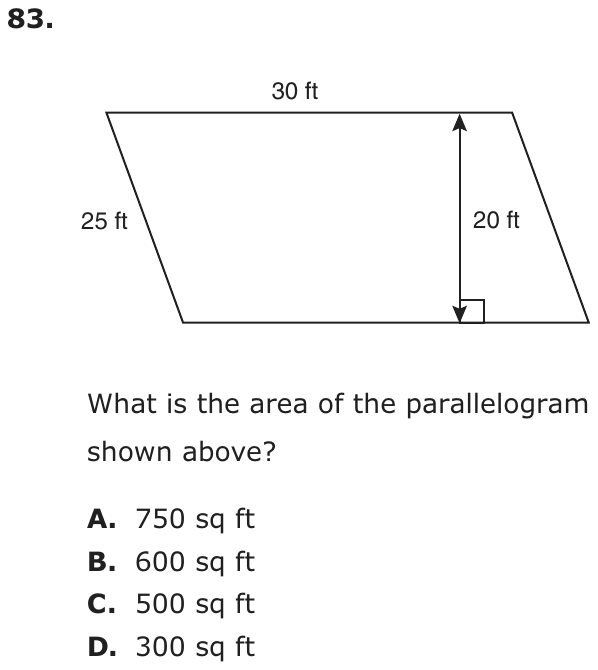
What is the area of the parallelogram shown above?
- A750 sq ft
- B600 sq ft
- C500 sq ft
- D300 sq ft
Show the answer
Correct answer: B
To find the area of a parallelogram, multiply the length of a side by the altitude for that side.
One property of parallelograms is that opposite sides are the same length.
So the bottom side of the parallelogram is 30 feet long and has an altitude of 20 feet.
Therefore, the area of the parallelogram, in square feet, is .
Question analysis
A geometry question with a figure: a parallelogram is labeled with a 30-foot top side, a 25-foot slanted side and a 20-foot height drawn at a right angle. Students find its area. The figure gives one length that is not needed, so students must pick the base and height that belong together.
- NYS standards
- 6.G.1 area of polygons
- Grade level
- Grade 6 content, by NYS standard
- Compared with grade 7
- Below grade 7 Area of a parallelogram is grade 6 content, and this is a one-step use of the formula. It is easier than typical grade 7 area work, which involves composite figures, circles or scale drawings.
- Estimated difficulty
- Routine: one familiar step, little to misread.
- Thinking it demands
- Depth of knowledge 1, recall and reproduction · mainly apply
- What makes it hard
- Solution
- 1 step
- Reading level
- Question and choices: about grade 2, 17 words.
- Students, last 30 days
- Not enough answers yet to show (it takes 10).
Why it is hard, traps and wrong answers (shows the answer)
Why it is hard
This is a one-step formula question with whole numbers, made slightly harder by one length too many. A student who multiplies the two side lengths, as for a rectangle, or brings in a triangle's one half, finds a listed choice. Matching the base to the height marked with a right angle is all it takes.
Reading a figure, table or graph minor Understanding the question
The figure labels three lengths, but only the 30-foot side and the 20-foot height drawn at a right angle to it belong together; the slanted 25-foot side is extra. (Lesh, Post & Behr, 1987; Kirsch & Mosenthal, 1990)
Something you must already know minor Working it out
The parallelogram area formula, base times height, is not given, and its height must be the perpendicular distance, not the slanted side. (Anderson & Krathwohl, 2001)
Strategy: Use base times height, where the height is the perpendicular distance between the two parallel sides chosen as bases.
Traps
- Wrong formula: Uses a related but wrong formula: perimeter for area, diameter for radius, area for volume, or a misremembered one.
- Information you don't need: The question gives numbers or facts that play no part in the answer.
The wrong answers, classified
A Wrong formula (King et al., 2004)
Multiplies the two side lengths, 30 × 25 = 750, as if a parallelogram's area were side times side like a rectangle's.
C Misreads the figure (Lesh, Post & Behr, 1987; Kirsch & Mosenthal, 1990)
Pairs the 20-foot height with the slanted 25-foot side, 25 × 20 = 500, though the height is drawn at a right angle to the 30-foot sides.
D Wrong formula (King et al., 2004)
Uses the triangle formula, 1/2 × 30 × 20 = 300, halving the base times the height.
Worked solution, step by step
Formulas used
- Area of a parallelogram
- A is the area. b is the base, one of the two parallel sides. h is the height: the straight distance between the two parallel sides, at a right angle to the base. It works because you can cut a triangle off one end, move it to the other end and make a rectangle.
Sort out the figure
A parallelogram is a four-sided shape whose opposite sides are parallel. Parallel means they never meet. The figure shows three lengths. The top side is 30 ft. The slanted left side is 25 ft. The arrow from top to bottom is 20 ft, and the small square shows a right angle. You need the area, in square feet.
Choose the base and height
The height must make a right angle with the base. The 20 ft arrow meets the bottom side at a right angle. Opposite sides of a parallelogram are equal, so the bottom side is 30 ft too. So the base is 30 ft and the height is 20 ft. Watch out: the slanted 25 ft side is not needed. Using gives choice C.
Find the area
The area is 600 sq ft. Watch out: do not multiply the two sides, . That is choice A. Do not take half either, which is for triangles and gives 300, choice D. So the answer is B, 600 sq ft.
Check your answer
Picture cutting the triangle off the left end and sliding it to the right end. The shape becomes a rectangle 30 ft long and 20 ft tall, with an area of 600 sq ft. 750 is too big, because the shape is only 20 ft tall, not 25 ft.
More questions like this
The original DOE question
Question 14 of 27
2024 Test A Math, question 39Question
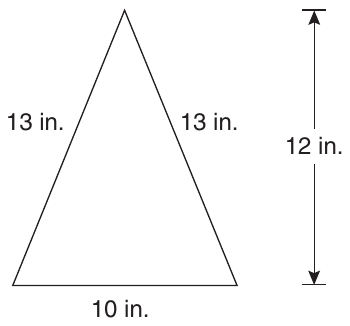
Raquel is cutting out pieces of cardboard to make a pyramid. She will use a square piece for the base and identical triangular pieces for the sides. The figure above shows the dimensions of the triangle for each side. What will be the total surface area, in square inches, of the pyramid, including the square base?
- A280
- B295
- C340
- D360
Show the answer
Correct answer: C
Surface area is found by calculating the area of each side, including the base, and adding them all together.
The base of the pyramid measures 10 inches on each side, so the area of the base is
Each triangular face has a base of 10 inches and a height of 12 inches, so the area of each face is
There are 4 triangular faces (because the square base has 4 edges, each of which will have a triangular face). So the total surface area of the pyramid is the sum of the areas of 4 triangles and 1 square.
So the total surface area is 340 square inches.
Question analysis
This surface area word problem shows one triangular face, with sides of 13 inches, a base of 10 inches and a height of 12 inches, that Raquel will use to build a cardboard pyramid with a square base. Students find the total area of the base and all the triangular sides. Picturing the solid and choosing the right measurements from the figure are the tricky parts.
- Grade level
- Grade 7 content, by NYS standard
- Compared with grade 7
- Above grade 7 Grade 7 students find the surface area of a pyramid from a drawn net or solid. Here only one triangular face is shown, so students must picture the whole pyramid, count its faces, and choose which labeled length belongs in the area formula.
- Estimated difficulty
- Hard: combines ideas, needs a plan, and has more than one tempting wrong answer.
- Thinking it demands
- Depth of knowledge 2, skills and concepts · mainly apply
- What makes it hard
- Reading a figure, table or graph moderate
- Combines ideas moderate
- Something you must already know minor
- Solution
- 4 steps
- Reading level
- Question and choices: about grade 6, 56 words.
- Corrected from the DOE handbook
- A wrong unit in the explanation was corrected.
- Students, last 30 days
- Not enough answers yet to show (it takes 10).
Why it is hard, traps and wrong answers (shows the answer)
Why it is hard
Students have to build the pyramid in their heads from one flat triangle, then choose the right measurement from three labels. The 13-inch sides look like the natural height, and using them gives a listed total; picturing a pyramid with three sloping faces gives another. Sketching the square base with a triangle on each edge, and marking 12 as the height, settles both the face count and the formula.
Reading a figure, table or graph moderate Understanding the question
The figure gives one triangle with three length labels, 13, 13 and 10, and puts its height, 12, on a separate arrow beside it, where it is easy to overlook. (Lesh, Post & Behr, 1987; Kirsch & Mosenthal, 1990)
Combines ideas moderate Working it out
The solid is never drawn: students must see that the square's side equals the triangle's 10-inch base, count four triangles, and add triangle and square areas. (Embretson, 1998; Daniel & Embretson, 2010)
Something you must already know minor Working it out
A triangle's area uses its perpendicular height, not a slanted side, and a pyramid on a square base has four triangular faces; neither fact is given. (Anderson & Krathwohl, 2001)
Strategy: Sketch the pyramid: a square base whose side is the triangle's base, and one triangular face on each side of the square. Find each area with the matching formula, then add them all.
Traps
- Misreads the figure: Reads a value, label or tick spacing in a figure, table or graph wrongly.
- Information you don't need: The question gives numbers or facts that play no part in the answer.
- Misunderstands the concept: A wrong belief about a concept: that percents can be added, that area grows like length, that averages can be averaged, that a bigger denominator means a bigger fraction.
The wrong answers, classified
A Misunderstands the concept (Smith, diSessa & Roschelle, 1993; De Bock et al., 1998; Ni & Zhou, 2005)
Counts only three triangular faces, as if the pyramid had a triangular base, so 3 × 60 + 100 = 280.
B Misunderstands the concept (Smith, diSessa & Roschelle, 1993; De Bock et al., 1998; Ni & Zhou, 2005)
Counts three faces and also uses the 13-inch side as each triangle's height: 3 × 65 + 100 = 295.
D Misreads the figure (Lesh, Post & Behr, 1987; Kirsch & Mosenthal, 1990)
Takes the 13-inch slanted side as each triangle's height instead of the 12-inch arrow beside it, so 4 × 65 + 100 = 360.
What was corrected from the DOE handbook, and why
- Explanation: The handbook ends “So the total surface area is 340 square feet.” The triangle’s dimensions are in inches and the question asks for square inches, so the site now reads “340 square inches.”
Worked solution, step by step
Formulas used
- Area of a triangle
- A is the area. b is the base, the side the triangle sits on. h is the height: the straight-up distance from the base to the top corner, at a right angle to the base. You take half because a triangle is half of a rectangle with the same base and height.
- Area of a square
- A is the area and s is the length of one side. All four sides of a square are equal, so the area is side times side.
- Surface area
- A face is one flat side of a solid shape. The surface area is the total area of the outside. Picture unfolding the solid into flat pieces. Then add up the area of every piece.
Sort out the question
Raquel’s pyramid has a square base. Each side is a triangle like the one in the figure. The triangle’s base is 10 in. Its two slanted sides are 13 in. Its height, the arrow beside it, is 12 in. You need the total surface area, including the square base, in square inches.
Picture the pyramid
Surface area is the total area of all the flat sides, called faces. Each triangle stands on one edge of the square. So each edge of the square is 10 inches, the same as the triangle’s base. A square has 4 edges, so the pyramid has 4 triangles.
Here that is 4 triangles plus 1 square. Watch out: counting only 3 triangles gives 280, choice A.
Find the area of one triangle
Each triangle is 60 square inches. Watch out: the height is 12 in., the straight-up arrow. It is not 13 in., the slanted side. Using 13 gives 65 for each triangle and 360 in all, choice D.
Find the area of the base
The base is a square with sides of 10 inches, the same as each triangle’s base.
The square base is 100 square inches.
Add all five faces
The four triangles and the square together cover 340 square inches.
So the answer is C, 340 square inches.
Check your answer
Each triangle is half of a 10 by 12 rectangle, which has an area of 120. So two triangles make 120, and four make 240. Add the base: . The units fit too: inches times inches gives square inches.
More questions like this
The original DOE question
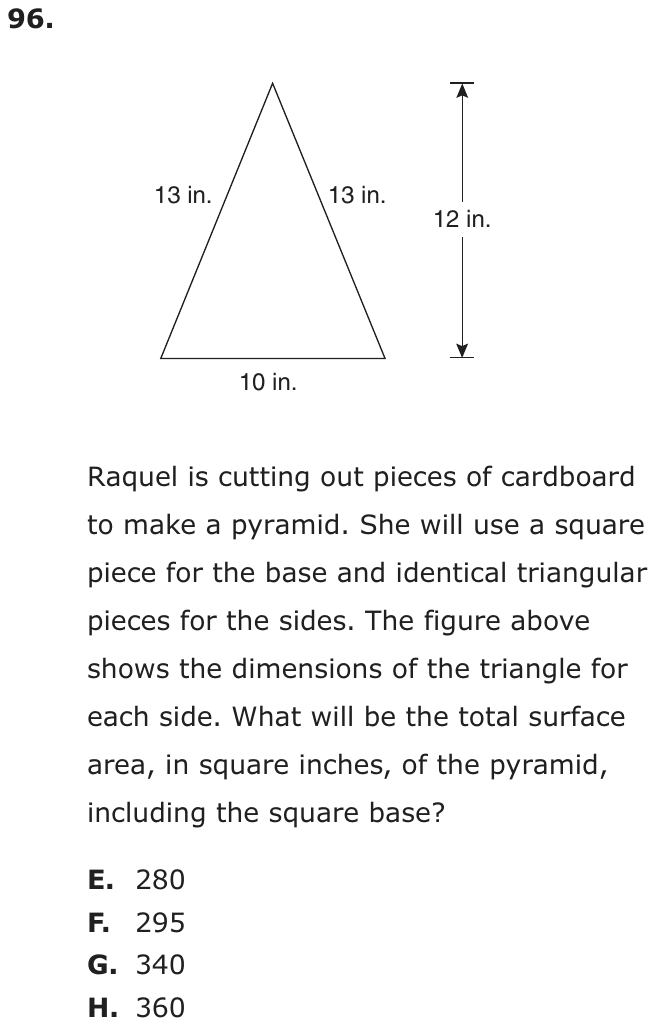
Question 15 of 27
2024 Test B Math, question 3Question
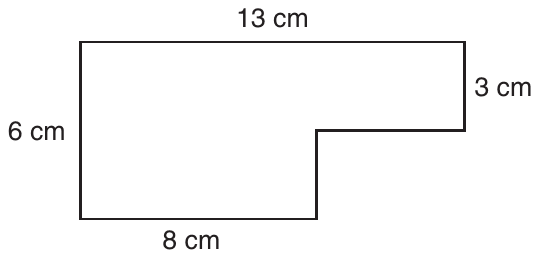
The figure above shows a scale drawing of a garden, where 1 centimeter represents 2.5 meters. What is the perimeter of the actual garden in meters?
Grid-in question: work out the answer and enter it as a number.
Show the answer
Correct answer: 95
First, find the perimeter of the figure.
Two sides do not have labels. The top of the figure measures 13 cm and the bottom shows a length measuring 8 cm, so the horizontal side without a label measures 5 cm .
The left side of the figure measures 6 cm and the right side shows a length measuring 3 cm, so the vertical side without a label measures 3 cm .
So the total perimeter of the scale drawing is
Use the scale to find the perimeter of the actual garden:
Question analysis
A grid-in on a scale drawing of an L-shaped garden, where each centimeter stands for 2.5 meters and two sides carry no labels. Students find the perimeter of the drawing, then convert it to the real garden's perimeter in meters. The unlabeled sides are easy to leave out.
- Grade level
- Grade 7 content, by NYS standard
- Compared with grade 7
- At grade 7 Scale drawings are grade 7 content, and a typical task converts one or two given lengths. Here two missing sides must be worked out and the perimeter assembled before the scale applies, more steps but nothing beyond grade 7.
- Estimated difficulty
- Moderate: several steps, or a close reading with one strong distractor.
- Thinking it demands
- Depth of knowledge 2, skills and concepts · mainly apply
- What makes it hard
- Reading a figure, table or graph moderate
- Combines ideas minor
- An answer in an unexpected form minor
- Solution
- 4 steps
- Reading level
- Question and choices: about grade 9, 24 words.
- Students, last 30 days
- Not enough answers yet to show (it takes 10).
Why it is hard, traps and wrong answers (shows the answer)
Why it is hard
The figure hides the work: it labels four of the six sides, and the missing two are short pieces of the notch that are easy to overlook. Once all six are found, the scale step is a single multiplication, but it must go the right way, since the real garden is larger than the drawing. Tracing the outline and counting six sides guards against the most common loss.
Reading a figure, table or graph moderate Understanding the question
Two sides of the notch carry no labels, so students must find them from the opposite sides: 13 − 8 = 5 cm across and 6 − 3 = 3 cm down. (Lesh, Post & Behr, 1987; Kirsch & Mosenthal, 1990)
Combines ideas minor Working it out
The perimeter of an L-shaped drawing has to be joined to a scale of 2.5 meters per centimeter, two separate skills in one answer. (Embretson, 1998; Daniel & Embretson, 2010)
An answer in an unexpected form minor Choosing the answer
With no choices, nothing flags a perimeter that is missing two sides or still in centimeters; the student must check the six-sided total alone. (Enright, Morley & Sheehan, 2002)
Strategy: Use the opposite sides to work out the two unlabeled lengths, add all six sides of the drawing, then multiply the total in centimeters by 2.5 meters per centimeter.
Traps
- Misreads the figure: Reads a value, label or tick spacing in a figure, table or graph wrongly.
- Stops one step early: A choice is a number from partway through the solution.
- Wrong operation: Adds instead of multiplying, divides the wrong way round, turns a ratio or rate upside down, or undoes a step in the wrong direction (subtracts what should be added back).
The wrong answers, classified
75 Misreads the figure (Lesh, Post & Behr, 1987; Kirsch & Mosenthal, 1990)
Adds only the four labeled sides, 13 + 3 + 8 + 6 = 30 cm, and scales that to 75 m, missing the two unlabeled sides of the notch.
38 Stops one step early (King et al., 2004; Gierl et al., 2017)
Finds the drawing's perimeter, 38 cm, correctly and grids it without applying the scale of 2.5 meters per centimeter.
15.2 Wrong operation (Hegarty, Mayer & Monk, 1995; King et al., 2004)
Divides the 38 cm perimeter by 2.5 instead of multiplying, shrinking the garden though each centimeter of the drawing stands for 2.5 meters.
Worked solution, step by step
Formulas used
- Perimeter
- P is the perimeter, the distance all the way around a shape. Add the length of every side, once each. It works for any shape with straight sides, even one with a corner cut out.
- Using a scale
- s is the scale, the number of meters that 1 centimeter on the drawing stands for. Here s is 2.5. Each centimeter on the drawing is 2.5 meters in real life, so you multiply.
Sort out what you know
The figure is a scale drawing, a small copy of the real garden. Each 1 cm on the drawing stands for 2.5 m in the real garden. You need the perimeter of the real garden in meters. The perimeter is the distance all the way around.
The shape has 6 sides. Four are labeled: 13 cm, 3 cm, 8 cm and 6 cm. The two sides around the cut-out corner have no labels.
Find the missing side across
Look at the top side, 13 cm. Below it, the bottom side (8 cm) and the short unlabeled side across the notch together reach just as far. So the missing side is the difference.
The missing side across is 5 cm.
Find the missing side going down
Now look at the left side, 6 cm. On the right, the 3 cm side and the unlabeled side going down together make the same height.
The missing side going down is 3 cm.
Add all six sides
The perimeter of the drawing is 38 cm. Watch out: adding only the four labeled sides gives 30 cm. That leads to the wrong answer 75.
Change to real meters
Each centimeter stands for 2.5 meters, so multiply by 2.5.
Here and . The real perimeter is 95 meters. Watch out: 38 is still in centimeters, so do not grid it. Dividing by 2.5 gives 15.2, which makes the garden smaller than its drawing.
So you would grid 95.
Check your answer
Slide the two notch sides out to the corner. The distance around stays the same, so it equals a 13 cm by 6 cm rectangle: . Also, 95 meters is more than 38, which fits, because each centimeter stands for more than 1 meter.
More questions like this
The original DOE question
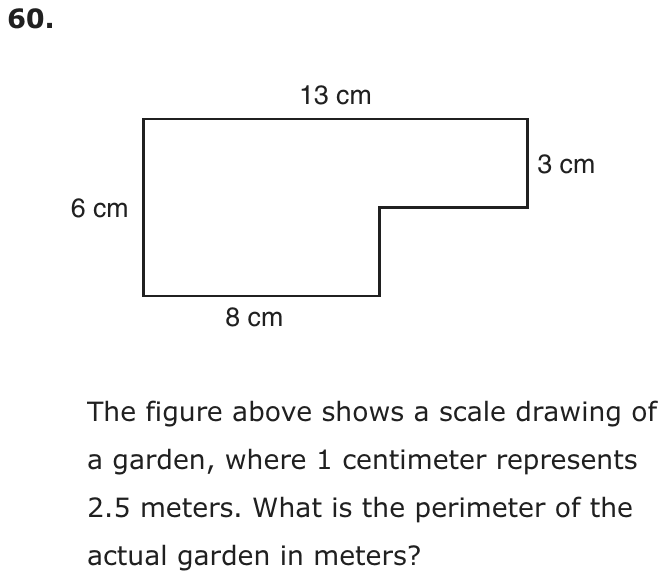
Question 16 of 27
2024 Test B Math, question 6Question
This graph shows y, the weight of a pole of length x.
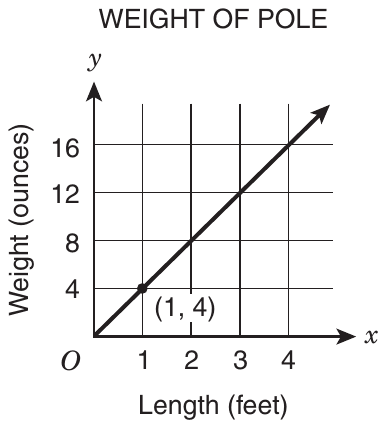
What is represented by the point with coordinates (1, 4)?
- AThe unit rate is 4 ounces per foot.
- BThe y-intercept is 4.
- CA pole 4 feet long weighs 1 ounce.
- DThe length increases 4 feet for each 1 ounce of weight.
Show the answer
Correct answer: A
The x-axis represents the length of the pole, in feet, and the y-axis represents the weight of the pole, in ounces.
The point (1, 4) means that a 1-foot pole would weigh 4 ounces.
Since the graph is linear, the pole weighs 4 ounces for every additional 1 foot of length.
So the unit rate is 4 ounces per foot.
Question analysis
A graph of a pole's weight in ounces against its length in feet is a straight line through the origin, with the point (1, 4) marked. Students decide what that point says about poles, choosing among statements about rates, intercepts and particular poles, so the meaning of each coordinate has to be pinned down.
- Grade level
- Grade 7 content, by NYS standard
- Compared with grade 7
- At grade 7 Explaining what a point on a proportional graph means in the situation is a named grade 7 skill. This is a direct, one-step example with a clear graph, typical of grade 7 classwork.
- Estimated difficulty
- Straightforward: two steps or one careful reading.
- Thinking it demands
- Depth of knowledge 2, skills and concepts · mainly understand
- What makes it hard
- Solution
- 1 step
- Reading level
- Question and choices: about grade 2, 45 words.
- Students, last 30 days
- Not enough answers yet to show (it takes 10).
Why it is hard, traps and wrong answers (shows the answer)
Why it is hard
Nothing needs computing; the question tests whether a point on a graph can be put into words. Each wrong statement misuses the same two numbers, as an intercept, with the coordinates swapped, or as a rate turned upside down. Saying the point aloud with its units, a 1-foot pole weighs 4 ounces, and comparing that sentence with each statement settles it quickly.
Reading a figure, table or graph moderate Understanding the question
The axes carry the meaning: length in feet runs along x and weight in ounces up y, so (1, 4) describes a 1-foot pole, and the line through O makes that a rate. (Lesh, Post & Behr, 1987; Kirsch & Mosenthal, 1990)
A very close wrong answer minor Choosing the answer
Both rate statements pair 4 with 1, one as ounces per foot and the other as feet per ounce; only the axis labels say which way the rate runs. (Embretson & Wetzel, 1987; Gorin & Embretson, 2006; Ascalon et al., 2007)
Something you must already know minor Working it out
The choices use the terms unit rate and y-intercept, which the question does not define, and two statements hang on knowing what each one means. (Anderson & Krathwohl, 2001)
Strategy: Note which quantity each axis measures, say in words what the x-coordinate and the y-coordinate of the marked point stand for, then compare that sentence with each choice.
Traps
- Wrong operation: Adds instead of multiplying, divides the wrong way round, turns a ratio or rate upside down, or undoes a step in the wrong direction (subtracts what should be added back).
- Misreads the figure: Reads a value, label or tick spacing in a figure, table or graph wrongly.
- Misunderstands the concept: A wrong belief about a concept: that percents can be added, that area grows like length, that averages can be averaged, that a bigger denominator means a bigger fraction.
The wrong answers, classified
B Misunderstands the concept (Smith, diSessa & Roschelle, 1993; De Bock et al., 1998; Ni & Zhou, 2005)
Takes the 4 in the point's label for the y-intercept, though the line starts at the origin, where a pole of no length weighs 0 ounces.
C Misreads the figure (Lesh, Post & Behr, 1987; Kirsch & Mosenthal, 1990)
Reads the coordinates the wrong way round, taking 1 as the weight in ounces and 4 as the length in feet.
D Wrong operation (Hegarty, Mayer & Monk, 1995; King et al., 2004)
Turns the rate upside down, describing feet of length per ounce of weight instead of ounces of weight per foot of length.
Worked solution, step by step
Formulas used
- Unit rate
- For a point on the line, y is the weight in ounces and x is the length in feet. The unit rate is the weight of 1 foot of pole. This works for a straight line that starts at the origin, the point (0, 0).
Read the axes
The graph has two axes (number lines). The x-axis, across the bottom, shows length in feet. The y-axis, going up, shows weight in ounces.
A point is written (x, y). The across number comes first, then the up number. So in (1, 4), x is 1 and y is 4.
Say what the point means
x = 1 means a length of 1 foot. y = 4 means a weight of 4 ounces. So a pole 1 foot long weighs 4 ounces.
Watch out: do not swap the numbers. “A pole 4 feet long weighs 1 ounce” reads them the wrong way round. That is choice C.See that this is a unit rate
A unit rate is an amount for 1 unit, here the ounces in 1 foot. The line starts at O, the origin (0, 0), and it is straight. So each extra foot adds the same weight.
The unit rate is 4 ounces per foot. Watch out: choice D turns this upside down. It gives feet for each ounce, not ounces for each foot.
Rule out the y-intercept
The y-intercept is where the line crosses the y-axis. This line crosses it at O, where y is 0. So the y-intercept is 0, not 4, and choice B is wrong.
So the answer is A, the unit rate is 4 ounces per foot.
Check your answer
Try another point on the line, such as (3, 12). A pole 3 feet long weighs 12 ounces. , so it is still 4 ounces per foot. The rate stays the same all along the line.
More questions like this
The original DOE question
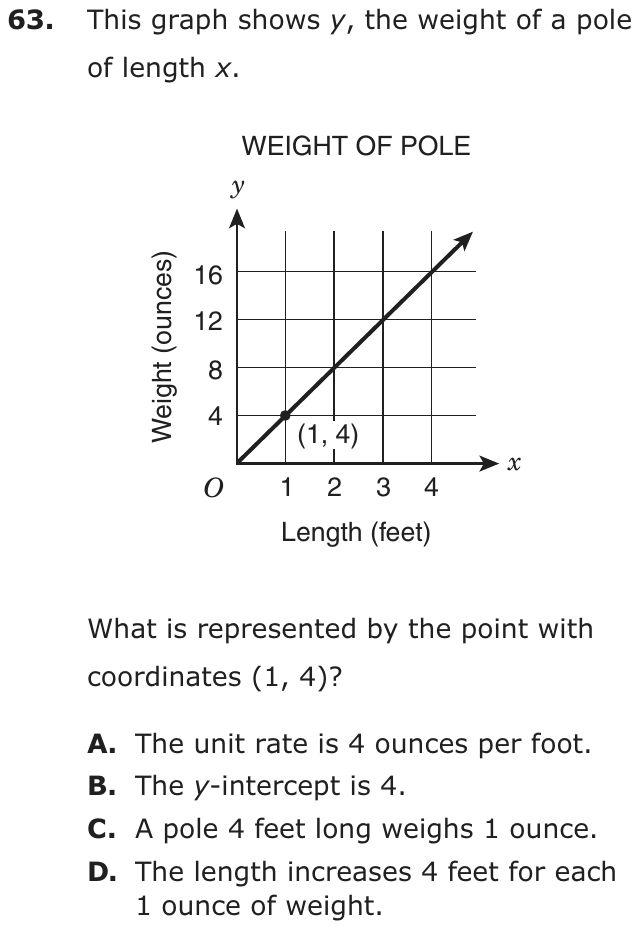
Question 17 of 27
2024 Test B Math, question 20Question
Centerville will hold a vote on whether to build a new park. The town council surveyed a random sample of 200 residents to determine whether they would be in favor of building this park. The table shows the results of the survey.
SURVEY RESULTS
| Opinion | Number of Residents |
|---|---|
| Yes | 142 |
| No | 38 |
| Undecided | 20 |
The mayor estimates that half the undecided voters will vote in favor of building the park. Based on the survey results, if the mayor is correct, how many of the 24,100 voters will be in favor of building the park?
- A17,111
- B18,316
- C19,401
- D19,521
Show the answer
Correct answer: B
If half the undecided voters (half of 20) vote in favor of building the park, the total number of “yes” votes from the survey will be 152.
There are 24,100 voters, and 200 residents were surveyed. Set up a proportion to solve:
Question analysis
A survey question: a random sample of 200 Centerville residents answered yes, no or undecided about building a park, and the mayor expects half the undecided to vote yes. Students use the sample to predict how many of 24,100 voters will favor the park. It joins a proportion from a sample with large-number arithmetic.
- Grade level
- Grade 7 content, by NYS standard
- Compared with grade 7
- At grade 7 Using a random sample to estimate a count in a whole population is a typical grade 7 proportion task. The extra step for the undecided group and the large numbers add care without going beyond grade 7.
- Estimated difficulty
- Hard: combines ideas, needs a plan, and has more than one tempting wrong answer.
- Thinking it demands
- Depth of knowledge 2, skills and concepts · mainly apply
- What makes it hard
- Error-prone arithmetic moderate
- Turning words into math moderate
- Reading a figure, table or graph minor
- Solution
- 3 steps
- Reading level
- Question and choices: about grade 5, 88 words.
- Students, last 30 days
- Not enough answers yet to show (it takes 10).
Why it is hard, traps and wrong answers (shows the answer)
Why it is hard
The setup is a sample-to-population proportion, and the trap is the mayor's assumption in the middle of the stem. Students who scale the 142 yes answers directly, or who count every undecided resident, reach believable totals that sit right among the choices. Once the count of 152 is settled, a rough estimate, about three quarters of 24,000, is enough to confirm the exact product.
Error-prone arithmetic moderate Working it out
Scaling 152 out of 200 up to 24,100 voters means computing 24,100 × 0.76, or 120.5 × 152, by hand with five-digit numbers. (Brown & Burton, 1978; Junker & Sijtsma, 2001)
Turning words into math moderate Understanding the question
The mayor's sentence adds a step: “half the undecided voters” turns the 20 undecided residents into 10 more yes votes, giving 152 before any scaling. (Hegarty, Mayer & Monk, 1995; Koedinger & Nathan, 2004)
Reading a figure, table or graph minor Understanding the question
The table gives Yes, No and Undecided counts, and the half must be taken of the Undecided row, not of the No row just above it. (Lesh, Post & Behr, 1987; Kirsch & Mosenthal, 1990)
Strategy: Count the sample's expected yes votes, including half of the undecided, write them as a fraction of 200, and multiply that fraction by 24,100; estimate first to check the choice.
Traps
- Misreads the question: Misses or misreads a condition or a word in the question: "at least", "each", "remaining", "not".
- Misreads the figure: Reads a value, label or tick spacing in a figure, table or graph wrongly.
The wrong answers, classified
A Misreads the question (Hegarty, Mayer & Monk, 1995)
Uses only the 142 yes answers, 142/200 of 24,100 = 17,111, leaving out the undecided residents the mayor expects to vote yes.
C Misreads the figure (Lesh, Post & Behr, 1987; Kirsch & Mosenthal, 1990)
Takes half of the 38 No answers instead of the 20 Undecided, reading the wrong row, so 161/200 of 24,100 ≈ 19,401.
D Misreads the question (Hegarty, Mayer & Monk, 1995)
Counts all 20 undecided residents as yes votes instead of half of them, so 162/200 of 24,100 = 19,521.
Worked solution, step by step
Formulas used
- Scaling up a sample
- A random sample is a smaller group picked by chance. Its share of yes votes should be about the same as the whole town’s share. So the two fractions are set equal. Use it to scale a survey up to a whole group.
Sort out what you know
The town surveyed 200 people. 142 said Yes, 38 said No, and 20 were Undecided (not sure yet). The mayor thinks half of the undecided people will vote yes. There are 24,100 voters in all. You need how many of them will vote yes.
Count the yes votes in the survey
Half of the 20 undecided people is . Add them to the yes votes.
So 152 of the 200 people surveyed would vote yes. Watch out: take half of the Undecided row, not the No row. Half of 38 leads to 19,401, choice C.
Find the share who vote yes
That is 76% of the people surveyed. The sample was random, so about 76% of all the voters should vote yes too. Watch out: using only the 142 yes votes gives 17,111, choice A. Counting all 20 undecided people gives 19,521, choice D.
Scale up to all the voters
Break it into easy parts. 75% is , and 1% is .
So the answer is B, 18,316.
Check your answer
Estimate. 76% is a little more than three fourths. Three fourths of 24,000 is 18,000. So the answer should be a little more than 18,000, and 18,316 fits. Also, , the same share as the survey.
More questions like this
The original DOE question
Question 18 of 27
2023 Test A Math, question 25Question
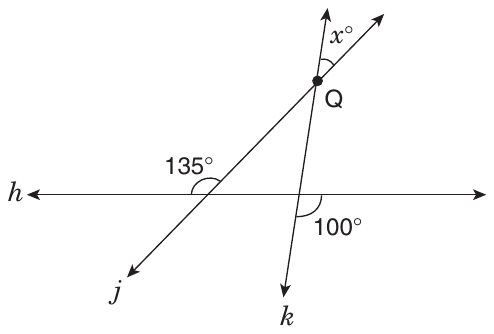
Lines j and k intersect at point Q, and h is a straight line. What is the value of x?
- A55
- B45
- C35
- D30
Show the answer
Correct answer: C
First, find the measures of the three angles inside the triangle. The lower left angle is supplementary to the one marked 135°, so the measure of that angle is . The angle on top is a vertical angle with the one marked x°, so the measure of that angle is also x°. The angle on the lower right is a vertical angle with the one marked 100°, so the measure of that angle is also 100°. Since the measures of the three interior angles of a triangle sum to 180°, set up an equation and solve for x:
Question analysis
Lines j and k cross at point Q above a straight line h, forming a triangle, with a 135° angle marked where j meets h and a 100° angle where k meets h. Students find the angle x at Q. Each marked angle lies outside the triangle, so it has to be turned into an inside angle before the triangle's angle sum can be used.
- NYS standards
- Grade level
- Grade 8 content, by NYS standard
- Compared with grade 7
- Above grade 7 Grade 7 students use supplementary and vertical angles to find unknown angles. This figure needs both, applied at three different vertices, plus the angle sum of a triangle, which New York teaches in grade 8.
- Estimated difficulty
- Hard: combines ideas, needs a plan, and has more than one tempting wrong answer.
- Thinking it demands
- Depth of knowledge 2, skills and concepts · mainly apply
- What makes it hard
- Reading a figure, table or graph major
- Combines ideas moderate
- Something you must already know minor
- Solution
- 4 steps
- Reading level
- Question and choices: about grade 2, 20 words.
- Students, last 30 days
- Not enough answers yet to show (it takes 10).
Why it is hard, traps and wrong answers (shows the answer)
Why it is hard
Every angle the solution needs has to be carried into the triangle from outside, and the two marked angles need different treatment. The 135° is supplementary to the triangle's angle, but the 100° is vertical to it, so subtracting both from 180° out of habit builds the wrong triangle. Checking which side of each line a marked angle sits on, not just how near the triangle it is, separates the two cases.
Reading a figure, table or graph major Understanding the question
None of the three marked angles is inside the triangle formed by h, j and k: the 135° is outside on the left, the 100° is below line h, and x is above Q. (Lesh, Post & Behr, 1987; Kirsch & Mosenthal, 1990)
Combines ideas moderate Working it out
Two different angle facts are needed: the 135° gives a supplementary interior angle of 45°, while the 100° and x carry into the triangle unchanged as vertical angles. (Embretson, 1998; Daniel & Embretson, 2010)
Something you must already know minor Working it out
Supplementary angles, vertical angles and the triangle's 180° sum are all assumed, and the question names none of them. (Anderson & Krathwohl, 2001)
Strategy: Mark the three angles of the triangle formed by lines h, j and k: one is supplementary to 135°, one is vertical to 100°, and the one at Q is vertical to x°.
Traps
- Misreads the figure: Reads a value, label or tick spacing in a figure, table or graph wrongly.
- Stops one step early: A choice is a number from partway through the solution.
The wrong answers, classified
A Misreads the figure (Lesh, Post & Behr, 1987; Kirsch & Mosenthal, 1990)
Takes the triangle's angle at line k as 180 − 100 = 80, the supplement of the marked angle instead of its vertical angle, so x = 180 − 45 − 80 = 55.
B Stops one step early (King et al., 2004; Gierl et al., 2017)
Finds the triangle's angle where line j meets h, 180 − 135 = 45, and gives it instead of going on to the angle at Q.
D Little reason to choose it (Haladyna & Downing, 1993; Rodriguez, 2005)
No angle fact in the figure gives 30, and the angle at Q is drawn close to its true size, so this choice mostly catches guesses.
Worked solution, step by step
Formulas used
- Angles on a straight line
- a and b are two angles side by side on a straight line. Together they make a half turn, a straight angle. So they add up to 180°. Angles like this are called supplementary.
- Vertical angles
- When two lines cross, they make an X. The angles straight across from each other in the X are called vertical angles. a and b are one such pair. They are always equal, because each one plus the angle between them makes a straight line.
- Angles of a triangle
- A, B and C are the three angles inside any triangle, in degrees. They always add up to 180°. Use it when you know two of the angles and need the third.
Sort out the figure
Lines h, j and k make a triangle. Its corners are where j crosses h, where k crosses h, and point Q. The figure marks two angles outside the triangle, 135° and 100°. You need x, the angle marked above Q.
Find the angle where j crosses h
The 135° angle is above h and to the left of j. The triangle’s angle is right next to it, on the other side of j. Together they make the straight line h. Call the triangle’s angle a.
So that corner of the triangle is 45°. Watch out: this is only one corner, not x. Stopping here gives 45, choice B.
Find the angle where k crosses h
The 100° angle is below h and to the right of k. The triangle’s angle is above h and to the left of k. Lines h and k make an X there, and these two angles are straight across from each other. They are vertical angles, so the triangle’s angle is 100°. Watch out: it is not 180 − 100 = 80. That angle is beside the 100°, not across from it. Using 80 gives 55, choice A.
Find the angle at Q
The x° angle is above Q, between the top parts of lines j and k. The triangle’s angle at Q is between the parts of j and k below Q. These two angles are straight across from each other. So they are vertical angles, and the triangle’s angle at Q is also x°.
Use the triangle’s angle sum
The three angles of the triangle must add up to 180°. Only x is unknown. So the answer is C, 35.
Check your answer
Add the triangle’s three angles: . Also, the angle at Q looks narrow in the figure, much less than a right angle of 90°. 35° fits that.
More questions like this
The original DOE question
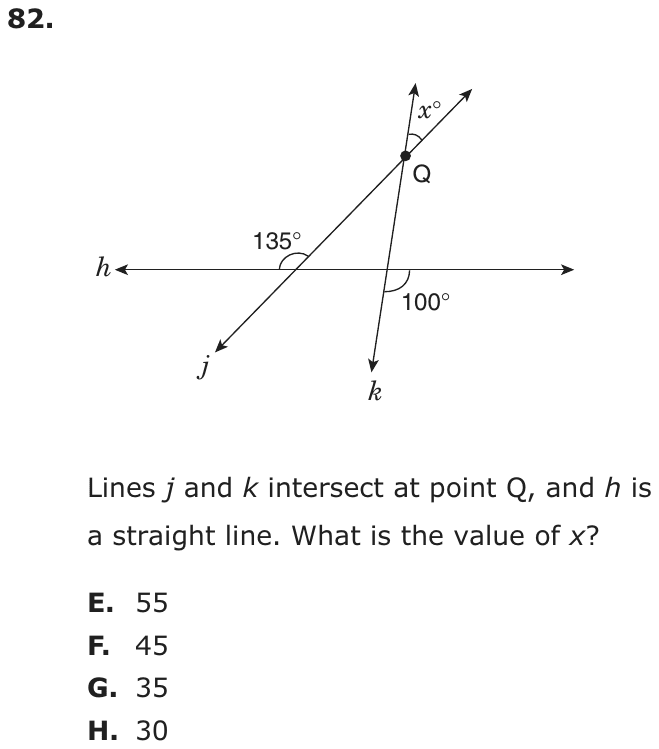
Question 19 of 27
2023 Test A Math, question 56Question

If all possible values of x are indicated by the shaded part of the number line above, which number line best shows all possible values of ?
- A

- B

- C

- D

Show the answer
Correct answer: D
The shaded region goes from to . So, the possible values of would be between the reciprocal of and the reciprocal of , which are 2 and , respectively. Find the number line in the answer options that has a shaded region that ranges from to 2, which is option D.
Question analysis
This number line question shades all possible values of x from one half to three halves and asks which number line shows all possible values of 1/x. Students find reciprocals of fractions and work out how a whole range of values changes. Keeping track of what happens to each end of the range, and placing fractions accurately on the line, makes it tricky.
- NYS standards
- Grade level
- Grade 6 content, by NYS standard
- Compared with grade 7
- Above grade 7 Reciprocals of single fractions are grade 6 work. Applying them to every value in a shaded range at once, and working out where the new range begins and ends, is reasoning about a whole set of numbers that grade 7 classes rarely practice.
- Estimated difficulty
- Hard: combines ideas, needs a plan, and has more than one tempting wrong answer.
- Thinking it demands
- Depth of knowledge 2, skills and concepts · mainly apply
- What makes it hard
- Reading a figure, table or graph moderate
- A very close wrong answer moderate
- Variables instead of numbers minor
- Solution
- 3 steps
- Reading level
- Question and choices: about grade 12, 27 words.
- Students, last 30 days
- Not enough answers yet to show (it takes 10).
Why it is hard, traps and wrong answers (shows the answer)
Why it is hard
Few students have flipped an interval before, so the question rewards testing its two ends and noticing that the order reverses. The harder part comes at the end: 2/3 falls between the tick marks, and a graph ending at the nearby 1/2 tick looks right at a glance. Students who believe a reciprocal is always at least 1, or who shift the interval instead of flipping it, reach the other graphs.
Reading a figure, table or graph moderate Understanding the question
The shaded segment's ends sit on unlabeled half-unit ticks, 1/2 and 3/2, and each choice must be read the same way, with 2/3 falling between ticks rather than on one. (Lesh, Post & Behr, 1987; Kirsch & Mosenthal, 1990)
A very close wrong answer moderate Choosing the answer
The graph from 1/2 to 2 matches the right graph's right end and differs at the left end by only a sixth of a unit, 1/2 against 2/3. (Embretson & Wetzel, 1987; Gorin & Embretson, 2006; Ascalon et al., 2007)
Variables instead of numbers minor Understanding the question
The question asks about 1/x for every x in a range, so a whole interval must be transformed, and its ends swap: the smallest x gives the largest 1/x. (Koedinger & Nathan, 2004; Enright, Morley & Sheehan, 2002)
Strategy: Take the reciprocal of each end of the shaded part, ask whether a bigger x gives a bigger or a smaller 1/x, and look for the graph whose endpoints are exactly those values.
Traps
- Misreads the figure: Reads a value, label or tick spacing in a figure, table or graph wrongly.
- Misunderstands the concept: A wrong belief about a concept: that percents can be added, that area grows like length, that averages can be averaged, that a bigger denominator means a bigger fraction.
- Wrong operation: Adds instead of multiplying, divides the wrong way round, turns a ratio or rate upside down, or undoes a step in the wrong direction (subtracts what should be added back).
The wrong answers, classified
A Wrong operation (Hegarty, Mayer & Monk, 1995; King et al., 2004)
Adds 1 to each endpoint instead of taking reciprocals, sliding the shaded part from 1/2–3/2 one unit right, to 3/2–5/2.
B Misunderstands the concept (Smith, diSessa & Roschelle, 1993; De Bock et al., 1998; Ni & Zhou, 2005)
Gets 2 from 1/2 but assumes a reciprocal cannot be less than 1, as flipping a proper fraction suggests, so it starts the shading at 1 instead of 2/3.
C Misreads the figure (Lesh, Post & Behr, 1987; Kirsch & Mosenthal, 1990)
Finds the reciprocals 2/3 and 2 but places 2/3 at the half-unit tick, 1/2, though 2/3 lies a third of the way from that tick toward 1.
Worked solution, step by step
Formulas used
- Reciprocal
- a and b are the top and bottom of a fraction. The reciprocal flips the fraction upside down. The number 1 over x is the reciprocal of x. A number times its reciprocal always makes 1.
Sort out the question
x can be any number in the shaded part of the first number line. You need the number line that shows every possible value of , the reciprocal of x. The reciprocal is the number flipped upside down, like for 2.
Read the shaded part
The ticks come every half unit. The shading starts at the tick halfway between 0 and 1, which is . It ends halfway between 1 and 2, which is , or . Both dots are filled in, so both ends count.
Find the reciprocals of the ends
Flip each end of the shaded part.
So the ends of the new shading are 2 and .
Notice that the ends swap
When x gets bigger, gets smaller. So the smallest x, , gives the biggest value, 2. The biggest x, , gives the smallest, . So runs from to 2, ends included.
Find the matching number line
lies between the half tick and 1, a third of the way from to 1. Line D starts there and ends at 2. Watch out: line C starts at the half tick, , not at . Line B starts at 1.
So the answer is D, the line shaded from to 2.
Check your answer
Test a value in the middle. x = 1 is shaded, and . On line D, 1 is shaded too. Test an end: , so really is the reciprocal of .
More questions like this
The original DOE question
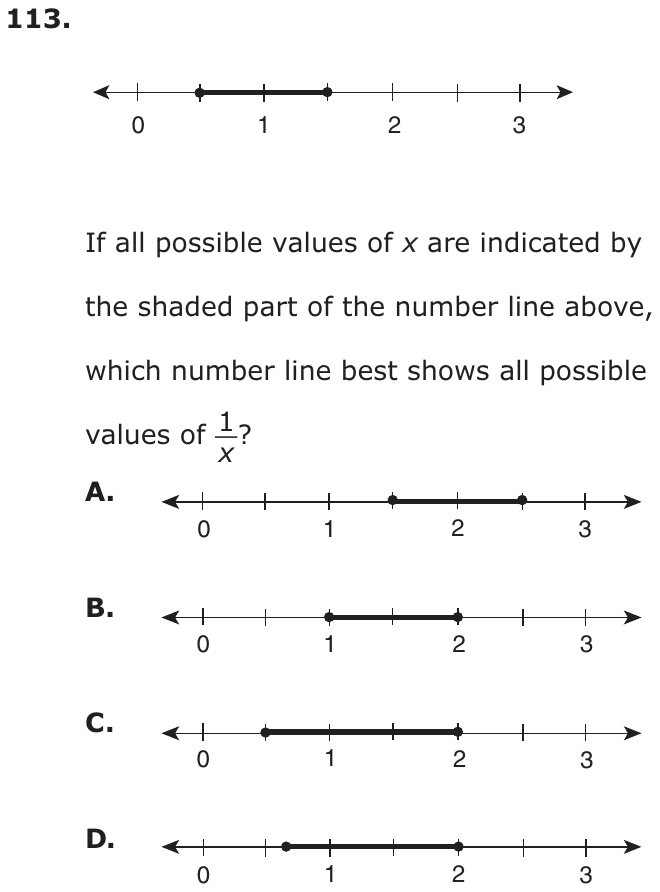
Question 20 of 27
2023 Test B Math, question 1Question
LAST YEAR’S TOTAL SALES
| Vehicles | Number |
|---|---|
| Four-door cars | 5,850 |
| Two-door cars | 2,250 |
| Trucks | 900 |
| Total | 9,000 |
The table above shows the number of each type of vehicle sold at a dealership last year. If 1,000 vehicles will be sold next month, what is the best estimate (based on last year’s sales) of the number of two-door cars that will be sold?
Grid-in question: work out the answer and enter it as a number.
Show the answer
Correct answer: 250
Let x represent the number of two-door cars that will be sold next month. Use the information in the table to set up a proportion:
Question analysis
A table shows last year's sales at a car dealership: four-door cars, two-door cars and trucks, 9,000 vehicles in all. This grid-in asks for the best estimate of how many two-door cars will be sold next month if 1,000 vehicles are sold. Students set up a proportion from the table; most of its rows are not needed.
- Grade level
- Grade 6 content, by NYS standard
- Compared with grade 7
- Below grade 7 Grade 7 proportion problems often take several steps or awkward numbers. This one scales a single share from a table to a new total, with numbers that divide cleanly, which is closer to grade 6 ratio work.
- Estimated difficulty
- Straightforward: two steps or one careful reading.
- Thinking it demands
- Depth of knowledge 2, skills and concepts · mainly apply
- What makes it hard
- Solution
- 2 steps
- Reading level
- Question and choices: about grade 4, 55 words.
- Students, last 30 days
- Not enough answers yet to show (it takes 10).
Why it is hard, traps and wrong answers (shows the answer)
Why it is hard
Once the share is seen as 2,250 out of 9,000, a quarter, the arithmetic is light, which makes this one of the easier grid-ins. Points are lost by entering the share itself as a percent, by reading the wrong row of the table, or by building a monthly average when the question supplies next month’s total. With no choices to compare, checking that the entry is a quarter of 1,000 is the only safeguard.
Turning words into math minor Understanding the question
The phrase “best estimate (based on last year’s sales)” has to become a proportion: two-door cars keep the same share of next month’s 1,000 vehicles as of last year’s 9,000. (Hegarty, Mayer & Monk, 1995; Koedinger & Nathan, 2004)
Reading a figure, table or graph minor Understanding the question
The table lists three vehicle types and a total; only the two-door row, 2,250, and the 9,000 total are needed, so the four-door and truck rows are distractions. (Lesh, Post & Behr, 1987; Kirsch & Mosenthal, 1990)
Strategy: Find what fraction of last year's 9,000 vehicles were two-door cars, simplify it, then take that fraction of the 1,000 vehicles expected next month.
Traps
- Stops one step early: A choice is a number from partway through the solution.
- Information you don't need: The question gives numbers or facts that play no part in the answer.
The wrong answers, classified
25 Stops one step early (King et al., 2004; Gierl et al., 2017)
Finds that 2,250 of 9,000 sales is 25 percent and enters that percent, stopping before taking a quarter of next month’s 1,000 vehicles.
650 Misreads the figure (Lesh, Post & Behr, 1987; Kirsch & Mosenthal, 1990)
Reads the four-door row instead of the two-door row and scales it correctly: 5,850 of 9,000 is 650 of 1,000.
187.5 Misreads the question (Hegarty, Mayer & Monk, 1995)
Divides last year’s 2,250 two-door sales by 12 months, a monthly average that ignores the stated 1,000 vehicles for next month.
Worked solution, step by step
Formulas used
- Proportion
- A proportion says two fractions are equal. Each fraction here is a part over its whole: two-door cars over all vehicles sold. Use it when a share stays the same while the total changes. Then you can find the missing part.
Sort out the question
The table shows last year’s sales. In all, 9,000 vehicles were sold, and 2,250 of them were two-door cars. Next month, 1,000 vehicles will be sold. You need about how many of them will be two-door cars.
“Based on last year’s sales” means two-door cars keep the same share of all sales. A share is a part out of a whole. The four-door and truck rows don’t matter here.
Find last year’s share of two-door cars
Last year, 2,250 out of 9,000 vehicles were two-door cars. Write that as a fraction and simplify it.
This works because . So 1 out of every 4 vehicles sold was a two-door car.
Set up the proportion and solve
Let x be the number of two-door cars next month. Next month’s share must match last year’s share.
To get x alone, multiply both sides by 1,000.
So about 250 two-door cars will be sold.
Give the answer
Watch out: one fourth is the same as 25%. Gridding 25 gives the percent, not the number of cars. Also be sure to use the two-door row. The four-door row would give 650. So you would grid 250.
Check your answer
Try it another way. Next month’s 1,000 vehicles are of last year’s 9,000. So take of the 2,250 two-door cars: . Both ways give 250 cars.
More questions like this
The original DOE question
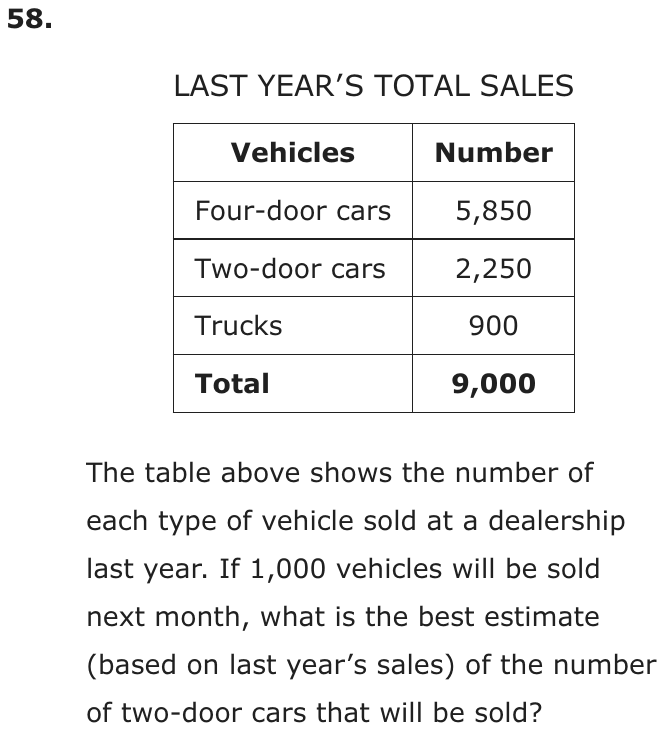
Question 21 of 27
2023 Test B Math, question 10Question
A total of 24 students in a math class took a 100-point test:
- None of the students scored 100 points.
- 75% of the students scored less than 82 points.
- The lowest score in the class was 54 points.
Which box plot best represents the test scores from this math class?
- A
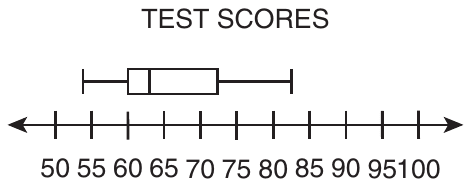
- B
- C
- D
Show the answer
Correct answer: B
Use the information in the bullet points to reason which box plot could represent the data set of test scores.
Since none of the students scored 100, the maximum value on the box plot must be less than 100.
If 75% of the students scored less than 82, then 25% scored 82 points or more. Since the third quartile (Q3) indicates (75%) of the data is to the left and (25%) of the data is to the right, it is reasonable that Q3 would be at or about 82.
Given that the lowest score in the class was 54, the minimum point on the box plot must be 54.
The box plot graph in option B is the only one that meets all three criteria.
Question analysis
Twenty-four students took a 100-point test: nobody scored 100, 75% scored below 82, and the lowest score was 54. Students choose the box plot that fits all three facts. The skill is linking each statement to a part of the plot, the whiskers, the box and the quartiles, and checking every plot closely.
- NYS standards
- 7.SP.1 box plots and interquartile range
- Grade level
- Grade 7 content, by NYS standard
- Compared with grade 7
- At grade 7 Grade 7 students usually read values off a box plot. This item runs the other way, turning a percent statement into a quartile and checking the whiskers against two more facts, but the content stays at grade 7.
- Estimated difficulty
- Moderate: several steps, or a close reading with one strong distractor.
- Thinking it demands
- Depth of knowledge 2, skills and concepts · mainly analyze
- What makes it hard
- Every choice must be checked moderate
- Reading a figure, table or graph moderate
- Something you must already know minor
- Solution
- 3 steps
- Reading level
- Question and choices: about grade 2, 45 words.
- Students, last 30 days
- Not enough answers yet to show (it takes 10).
Why it is hard, traps and wrong answers (shows the answer)
Why it is hard
The question turns three sentences into three features of a box plot, and a plot that matches two of them is easy to accept. The upper-quartile fact is the conceptual one: students who do not know that the box’s right edge marks 75 percent put 82 at the end of the whisker. The other two facts are quick visual checks, but only if every plot is actually checked.
Every choice must be checked moderate Choosing the answer
Each wrong plot fails a different fact, so all four must be tested against all three bullets: the left whisker against 54, the right whisker against 100, and the box’s right edge against 82. (Embretson & Wetzel, 1987)
Reading a figure, table or graph moderate Understanding the question
The axis is labeled every 5 points, and the deciding features fall between labels: one left whisker starts near 51 instead of 54, and box edges sit near 82.5. (Lesh, Post & Behr, 1987; Kirsch & Mosenthal, 1990)
Something you must already know minor Working it out
Nothing explains that “75% of the students scored less than 82” locates the upper quartile, the right edge of the box, rather than the highest score. (Anderson & Krathwohl, 2001)
Strategy: Turn each fact into a feature to check: where the left whisker starts, where the right whisker ends, and where the box ends. Rule out any plot that breaks one.
Traps
- Misreads the question: Misses or misreads a condition or a word in the question: "at least", "each", "remaining", "not".
- Misunderstands the concept: A wrong belief about a concept: that percents can be added, that area grows like length, that averages can be averaged, that a bigger denominator means a bigger fraction.
- Misreads the figure: Reads a value, label or tick spacing in a figure, table or graph wrongly.
The wrong answers, classified
A Misunderstands the concept (Smith, diSessa & Roschelle, 1993; De Bock et al., 1998; Ni & Zhou, 2005)
Puts 82 at the end of the right whisker, as if it were the highest score, when 75 percent below 82 marks the box’s right edge.
C Misreads the figure (Lesh, Post & Behr, 1987; Kirsch & Mosenthal, 1990)
Accepts the left whisker as starting at the lowest score, 54, when it begins near 51, just past the 50 tick.
D Misreads the question (Hegarty, Mayer & Monk, 1995)
Matches the lowest score and the box’s right edge near 82 but overlooks that a whisker reaching 100 means someone scored 100.
Worked solution, step by step
Formulas used
- Parts of a box plot
- A box plot shows five numbers. The left whisker starts at the minimum, the lowest value. The box starts at Q1, the first quartile, and ends at Q3, the third quartile. The line inside is the median, the middle value. The right whisker ends at the maximum. About a quarter of the data falls in each of the four sections.
Sort out the question
24 students took a test. You know three facts. Nobody scored 100. 75% scored less than 82. The lowest score was 54. You need the box plot that fits all three facts.
Turn each fact into a feature
Match each fact to a part of the box plot.
- The lowest score is 54, so the left whisker starts at 54.
- Nobody scored 100, so the right whisker ends before 100.
- 75% is three quarters. Three quarters of the scores are below Q3. So the box should end at about 82.
Read the number line
The ticks are 5 points apart: 50, 55, 60 and so on. A score of 54 sits just left of the 55 tick. A score of 82 sits a little less than halfway from 80 to 85. Look closely, because these points fall between labels.
Check plot A
In plot A, the right whisker ends near 82, and the box ends near 72. That would make 82 the highest score. Watch out: 75% below 82 does not make 82 the top score. It tells you where the box ends. So A is out.
Check plot C
In plot C, the left whisker starts near 51, just right of the 50 tick. But the lowest score was 54. So C is out.
Check plot D
Plot D starts at 54, and its box ends near 82. But its right whisker reaches 100. That means someone scored 100, and nobody did. Watch out: D fits two facts, so it is easy to stop early. Check all three. So D is out.
Check plot B and answer
Plot B starts at 54. Its box ends near 82. Its right whisker stops near 98, below 100. It fits all three facts. So the answer is B.
Check your answer
Go over B once more with all three facts. Its lowest point is 54. Its box ends near 82. Its highest point is under 100. Each other plot breaks one fact: A’s box, C’s left whisker and D’s right whisker.
More questions like this
The original DOE question
Question 22 of 27
2023 Test B Math, question 47Question
Four slips of paper numbered 1, 2, 3, and 4 were placed in a bag:
- One slip was selected from the bag, and the number recorded.
- Without replacement, a second slip was chosen.
- This process continued until no more slips remained in the bag.
- One part of a tree diagram representing the sample space is shown.
Which number should be placed in the box to complete this part of the tree diagram?
- A1
- B2
- C3
- D4
Show the answer
Correct answer: C
The “without replacement” statement means that the bag contained four slips for the first draw, three slips for the second draw, two slips for the third draw, and one slip for the last draw. Following the branch from the top and navigating down to the box, the 1 was chosen first, the 2 was chosen second, and the 4 was chosen third. The only remaining number is 3. The element would be 1243.
Question analysis
Four slips numbered 1 to 4 are drawn from a bag one at a time without replacement, and part of a tree diagram of the outcomes is shown. Students decide which number belongs in the empty box at the end of one branch. It tests reading a tree diagram and understanding what drawing without replacement means.
- NYS standards
- 7.SP.8b sample spaces for compound events
- Grade level
- Grade 7 content, by NYS standard
- Compared with grade 7
- Below grade 7 Tree diagrams for compound events are a grade 7 topic, but here the tree is already drawn and only one box is empty. Following a single branch to that box is shorter than typical grade 7 work with sample spaces.
- Estimated difficulty
- Routine: one familiar step, little to misread.
- Thinking it demands
- Depth of knowledge 2, skills and concepts · mainly understand
- What makes it hard
- Solution
- 2 steps
- Reading level
- Question and choices: about grade 5, 68 words.
- Students, last 30 days
- Not enough answers yet to show (it takes 10).
Why it is hard, traps and wrong answers (shows the answer)
Why it is hard
Only one branch matters, and once it is read as the slips drawn so far, 1, 2 and 4, the last slip left in the bag is the only one missing. Errors come from not counting the top 1 as a draw, from forgetting that a drawn slip stays out, or from copying a nearby number in the diagram instead of following the path.
Reading a figure, table or graph minor Understanding the question
The box hangs below the branch 1, then 2, then 4, and students must read that path from the top as the order of the first three draws. (Lesh, Post & Behr, 1987; Kirsch & Mosenthal, 1990)
Strategy: Follow the branch from the top down to the box, list the slips already drawn on that path, and name the one still left in the bag.
Traps
- Without replacement: In a second pick there is one fewer item, which changes the probability.
- Misreads the figure: Reads a value, label or tick spacing in a figure, table or graph wrongly.
The wrong answers, classified
A Misreads the figure (Lesh, Post & Behr, 1987; Kirsch & Mosenthal, 1990)
Treats the 1 at the top as the start of the diagram rather than the first slip drawn, so 1 seems still to be in the bag.
B Without replacement (Fischbein & Schnarch, 1997)
Lets slip 2, already drawn second on this branch, come up again, missing that a slip drawn without replacement stays out of the bag.
D Numbers taken from the question (Hegarty, Mayer & Monk, 1995)
Copies 4, the number directly above the box, reading the diagram as a pattern of numbers rather than as the order of the draws.
Worked solution, step by step
Sort out the question
The bag holds four slips: 1, 2, 3 and 4. Slips are drawn one at a time. “Without replacement” means a drawn slip does not go back in the bag. So each number can be drawn only once.
Read the tree diagram
A tree diagram shows the orders the draws can happen in. Each row going down is one draw. The 1 at the top is the first slip drawn. The numbers below it are the choices for the second draw, and so on.
Follow the path to the box
Start at the top and go down the lines to the box.
- First draw: 1
- Second draw: 2
- Third draw: 4
- Fourth draw: the box
Slips 1, 2 and 4 are already out of the bag.
Find the slip that is left
The bag started with 1, 2, 3 and 4. Only slip 3 has not been drawn. So it must be the fourth draw.
Watch out: The 1 at the top counts as a draw, so 1 is not left. That trap is choice A. Slip 2 was already drawn, so choice B can’t be right. And 4 is just the number above the box, choice D.
So the answer is C, 3.
Check your answer
Read the whole path: 1, 2, 4, 3. Each number from 1 to 4 shows up exactly once. That is just what should happen when no slip goes back in the bag.
More questions like this
The original DOE question
Question 23 of 27
2023 Test B Math, question 56Question
Lines s and t intersect at point P (3, 5). What is the area, in square units, of the shaded region in the graph above?
- A2
- B3
- C4
- D7
Show the answer
Correct answer: C
First, find the area of the rectangle in the graph:
Then, find the areas of the two right triangles that are not shaded:
Upper triangle:
Lower triangle:
The area of the shaded region, in square units, is calculated by subtracting the total area of the two right triangles from the area of the rectangle:
Question analysis
Two lines meet at the point (3, 5) on a coordinate grid, and the shaded region between them and the axes is a four-sided shape. Students find its area in square units. The shape is not a standard figure, so no single area formula applies to it directly.
- Grade level
- Grade 6 content, by NYS standard
- Compared with grade 7
- At grade 7 Areas of triangles and rectangles are grade 6 content, and grade 7 students often find composite areas. This region is an irregular four-sided shape with two slanted sides, so students need a plan, and the lengths come from coordinates rather than labels.
- Estimated difficulty
- Moderate: several steps, or a close reading with one strong distractor.
- Thinking it demands
- Depth of knowledge 2, skills and concepts · mainly apply
- What makes it hard
- No obvious method moderate
- Reading a figure, table or graph moderate
- Many steps minor
- Solution
- 4 steps
- Reading level
- Question and choices: about grade 4, 23 words.
- Students, last 30 days
- Not enough answers yet to show (it takes 10).
Why it is hard, traps and wrong answers (shows the answer)
Why it is hard
The question rewards a plan more than computation: the region has no name, so students must see it inside the dashed rectangle from O to P, with two right triangles cut away. Reading each triangle’s legs from the axes is the second hurdle, since the 1-unit intercepts shorten one leg of each, to 4 instead of 5 and to 2 instead of 3. Only one wrong choice, from using one coordinate as both heights, has a clear working behind it, so most errors here are guesses after a failed plan.
No obvious method moderate Working it out
The shaded shape has four sides, two of them slanted, and no formula of its own; it must be boxed in the 3-by-5 rectangle with two triangles removed, or cut along OP. (Schoenfeld, 1985)
Reading a figure, table or graph moderate Understanding the question
No lengths are labeled; every one comes from the coordinates of P (3, 5), the y-intercept 1 of line s and the x-intercept 1 of line t. (Lesh, Post & Behr, 1987; Kirsch & Mosenthal, 1990)
Many steps minor Working it out
The rectangle, two triangle areas and a subtraction make four computations, 15, 6 and 5, then 15 − 11, each built from different coordinates. (Daniel & Embretson, 2010; Enright, Morley & Sheehan, 2002)
Strategy: Draw the rectangle from O to P, find the areas of the two unshaded right triangles inside it from the coordinates, and subtract both from the rectangle's area.
Traps
- Misreads the figure: Reads a value, label or tick spacing in a figure, table or graph wrongly.
The wrong answers, classified
A Little reason to choose it (Haladyna & Downing, 1993; Rodriguez, 2005)
No common working gives 2; no rectangle or triangle built from the coordinates leaves that area, so it mostly draws students who judge the narrow region by eye.
B Misreads the figure (Lesh, Post & Behr, 1987; Kirsch & Mosenthal, 1990)
Cuts the region along OP into two triangles with bases of 1 but uses 3, the x-coordinate of P, as the height of both: 1.5 + 1.5 = 3.
D Little reason to choose it (Haladyna & Downing, 1993; Rodriguez, 2005)
No common working gives 7; half of the 3-by-5 rectangle, 7.5, comes closest, so it mostly draws students who guess the region fills about half.
Worked solution, step by step
Formulas used
- Area of a rectangle
- A is the area, in square units. l is the length and w is the width. Multiplying them counts the unit squares that fill the rectangle.
- Area of a triangle
- A is the area. b is the base, one side. h is the height: the distance from the base straight up to the far corner. A right triangle has a square corner, and the two sides that meet there are the base and height. A triangle is half of a rectangle with the same base and height.
Sort out the shaded region
The shaded region has four corners: O at (0, 0), (0, 1) on the y-axis, P at (3, 5), and (1, 0) on the x-axis. Line t meets the y-axis at (0, 1), and line s meets the x-axis at (1, 0). There is no easy formula for this shape. But the dashed lines make a rectangle around it. So find the rectangle’s area and take away the white parts.
Find the rectangle’s area
The rectangle has corners O, (3, 0), P and (0, 5). It is 3 units wide and 5 units tall.
The rectangle’s area is 15 square units.
Find the upper triangle’s area
The white triangle at the top left has corners (0, 1), (0, 5) and P. Its square corner, or right angle, is at (0, 5). One side runs up the y-axis from 1 to 5, so it is 4 units. The other runs across from 0 to 3, so it is 3 units.
Its area is 6 square units.
Find the lower triangle’s area
The white triangle at the bottom right has corners (1, 0), (3, 0) and P. Its square corner is at (3, 0). One side runs along the x-axis from 1 to 3, so it is 2 units. The other goes up from 0 to 5, so it is 5 units.
Its area is 5 square units.
Watch out: The lines cross the axes at 1, not at O. So these sides are 4 and 2, not 5 and 3.
Subtract the white triangles
Take both triangles away from the rectangle.
The shaded area is 4 square units.
So the answer is C, 4.
Check your answer
Cut the shaded region along a line from O to P. One piece has a base of 1 on the x-axis and a height of 5, since P is 5 units up. Its area is 2.5. The other has a base of 1 on the y-axis and a height of 3, since P is 3 units across. Its area is 1.5. Then 2.5 + 1.5 = 4. Using 3 for both heights gives 3, choice B.
More questions like this
The original DOE question
Question 24 of 27
2018 Test A Math, question 1Question
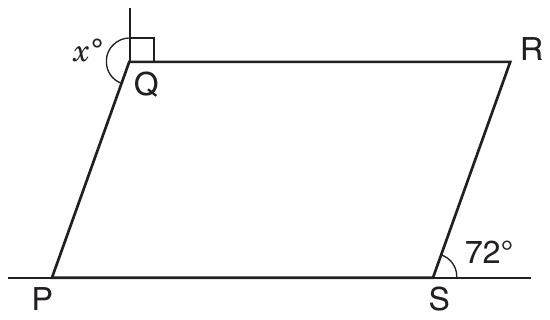
In the figure above, PQRS is a parallelogram. What is the value of ?
Grid-in question: work out the answer and enter it as a number.
Show the answer
Correct answer: 162
First, find the measure of angle PQR. The measure of angle PQR is equal to the measure of angle PSR.
m∠PSR = 180 − 72 = 108.
So, the measure of angle PQR is also 108.
108 + 90 + x = 360
198 + x = 360
x = 162
Question analysis
A grid-in geometry question about angles around a parallelogram PQRS. A 72° angle sits outside corner S on the extended base, and at corner Q a right angle and the unknown angle x complete the turn around the point. Students chain three angle facts, and the angle asked for lies outside the shape, not inside it.
- NYS standards
- Grade level
- Grade 8 content, by NYS standard
- Compared with grade 7
- Above grade 7 Grade 7 angle work usually applies one or two facts, such as supplementary or vertical angles, to find an angle. This chains three, and needs the equal opposite angles of a parallelogram, which rest on grade 8 parallel-line facts.
- Estimated difficulty
- Hard: combines ideas, needs a plan, and has more than one tempting wrong answer.
- Thinking it demands
- Depth of knowledge 2, skills and concepts · mainly apply
- What makes it hard
- Reading a figure, table or graph major
- Combines ideas moderate
- An answer in an unexpected form minor
- Solution
- 3 steps
- Reading level
- Question and choices: about grade 7, 14 words.
- Students, last 30 days
- Not enough answers yet to show (it takes 10).
Why it is hard, traps and wrong answers (shows the answer)
Why it is hard
The arithmetic is two subtractions; the difficulty is seeing which angles the marks refer to. Students lose points by treating the 72° as the parallelogram's own angle at S, or by stopping at angle PQR, the most natural number to grid. The question rewards tracing a route from S to Q before computing anything, and checking at the end that x is the angle outside the shape that the arc marks.
Reading a figure, table or graph major Understanding the question
The 72° is marked outside the parallelogram, between side SR and the base extended past S, and x sits outside corner Q, between QP and a vertical ray that meets QR at a right-angle mark. (Lesh, Post & Behr, 1987; Kirsch & Mosenthal, 1990)
Combines ideas moderate Working it out
Three angle facts have to be chained: a straight line gives the angle inside S, opposite angles of a parallelogram carry it to Q, and the angles around Q make a full 360° turn. (Embretson, 1998; Daniel & Embretson, 2010)
An answer in an unexpected form minor Choosing the answer
As a grid-in there are no choices to check against, so a student who stops at angle PQR, inside the parallelogram, gets no signal that the job is unfinished. (Enright, Morley & Sheehan, 2002)
Strategy: Use the straight line at S to find the parallelogram's angle there, carry it to the opposite corner Q, then take that angle and the right angle away from 360.
Traps
- Stops one step early: A choice is a number from partway through the solution.
The wrong answers, classified
108 Stops one step early (King et al., 2004; Gierl et al., 2017)
Finds angle PSR = 180 − 72 = 108 and carries it to angle PQR, then grids that interior angle instead of the angle x outside it.
198 Misreads the figure (Lesh, Post & Behr, 1987; Kirsch & Mosenthal, 1990)
Reads the 72° as the parallelogram's interior angle at S, so takes angle PQR as 72 and grids 360 − 90 − 72 = 198.
252 Misreads the figure (Lesh, Post & Behr, 1987; Kirsch & Mosenthal, 1990)
Overlooks the right-angle mark at Q and subtracts only the 108° angle PQR from 360, giving 252.
Worked solution, step by step
Formulas used
- Angles on a straight line
- a and b are two angles side by side on a straight line. Together they make a half turn, so they always add up to 180 degrees. Use it when an angle you need shares a straight line with an angle you know.
- Opposite angles of a parallelogram
- The symbol ∠ means angle. ∠PQR is the angle at corner Q, between sides QP and QR. ∠PSR is the angle at the opposite corner, S. In a parallelogram, opposite corners always have equal angles, because the shape leans the same way at both.
- Angles around a point
- a, b and c are angles that fit around one point with no gaps and no overlaps. Going all the way around is a full turn, which is 360 degrees. So the angles add up to 360.
Sort out what the figure shows
PQRS is a parallelogram. That is a four-sided shape whose opposite sides are parallel, which means they never meet. You need the value of x, in degrees.
Look closely at the marks. The 72° angle is outside the shape, at S. It sits between side SR and the base line, which keeps going past S. At Q, a vertical line meets side QR. The small square means a right angle, 90°. The angle x is outside the shape too. It runs from that vertical line around to side QP.
Find the angle inside corner S
Angle PSR is the shape’s own angle at S. It sits right next to the 72° angle, on the same straight base line. So the two angles add up to 180°.
So angle PSR is 108°. Watch out: 72° is not the inside angle at S. Using 72 as the inside angle leads to the wrong answer 198.
Carry the angle over to Q
Corners Q and S are opposite each other. In a parallelogram, opposite angles are equal. So angle PQR matches angle PSR.
So angle PQR is 108°. Watch out: this is not x. Angle PQR is inside the shape, and x is outside it. Stopping here and gridding 108 is the most common mistake.
Add the angles around Q
Three angles fill the space all the way around point Q. They are the right angle (90°), angle PQR (108°) and x. Together they make a full turn.
Watch out: don’t skip the right angle at Q. Leaving out the 90 gives 252.
Solve for x
Subtract 198 from 360 to find what is left for x.
So x is 162°. So you would grid 162.
Check your answer
Add the three angles at Q: . That is a full turn. Also, the arc for x is wider than a right angle but not as wide as a straight line. So x should be between 90° and 180°, and 162° is.
More questions like this
The original DOE question
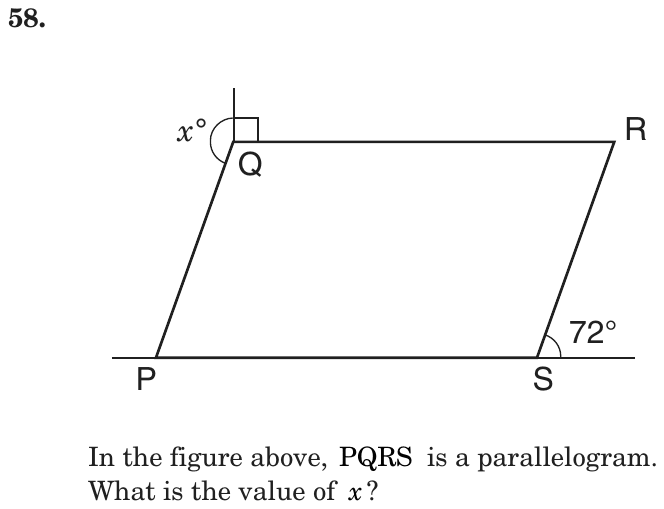
Question 25 of 27
2018 Test A Math, question 12Question
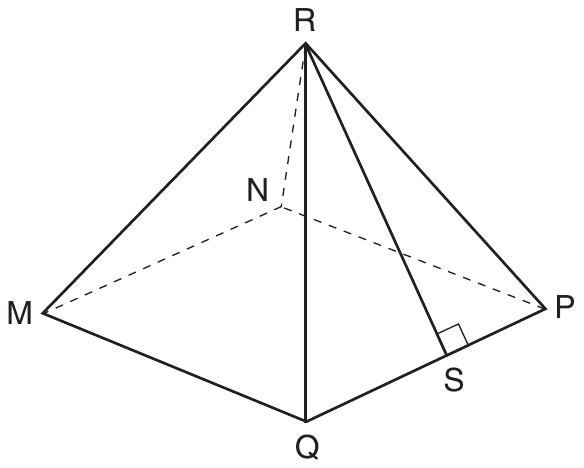
In the pyramid above, each triangular face has the same area, and the base MNPQ is a square that measures 8 centimeters on each side. If the length of = 6 centimeters, what is the surface area of the pyramid excluding the base?
- A48 sq cm
- B96 sq cm
- C128 sq cm
- D160 sq cm
Show the answer
Correct answer: B
Line segment is the altitude, or height, of triangle QRP. The length of is 8 cm. Use that information to find the area of triangle QRP:
sq cm.
There are 4 congruent triangles in the pyramid, so the surface area is
4 × 24 = 96 sq cm
Question analysis
A geometry question about the surface area of a square pyramid, leaving out its base. The base edges are 8 cm and segment RS, the height of one triangular face drawn from the top to a base edge, is 6 cm. Students find one face's area and multiply by the number of faces, reading excluding the base carefully.
- Grade level
- Grade 7 content, by NYS standard
- Compared with grade 7
- At grade 7 Surface area of a right pyramid from its faces is named in the grade 7 standards, and this is a direct two-step case. It matches typical grade 7 work, though the drawing's slant height must be read correctly.
- Estimated difficulty
- Moderate: several steps, or a close reading with one strong distractor.
- Thinking it demands
- Depth of knowledge 2, skills and concepts · mainly apply
- What makes it hard
- Solution
- 2 steps
- Reading level
- Question and choices: about grade 5, 49 words.
- Students, last 30 days
- Not enough answers yet to show (it takes 10).
Why it is hard, traps and wrong answers (shows the answer)
Why it is hard
Once RS is read as the height of a face, the computation is short: one triangle, then four of them. Points go to the figure and to one word. Students who count only the faces drawn in front, or who include the square base, reach listed choices, and the bold "excluding" is all that separates the lateral area from the total. The statement that every face has the same area is what makes multiplying by four valid.
Reading a figure, table or graph moderate Understanding the question
The drawing shows two lateral faces in front and two behind dashed edges, and RS, with its right-angle mark at S, is the height of face QRP, not of the pyramid. (Lesh, Post & Behr, 1987; Kirsch & Mosenthal, 1990)
Something you must already know minor Working it out
The triangle area formula, one half times base times height, and the fact that a square pyramid has four lateral faces are both assumed, not given. (Anderson & Krathwohl, 2001)
Strategy: Find the area of one triangular face with one half times base times height, using RS as the height, then multiply by the four congruent faces.
Traps
- Misreads the question: Misses or misreads a condition or a word in the question: "at least", "each", "remaining", "not".
- A formula you must know: Needs a formula the test does not give: area, circumference, volume, probability rules.
The wrong answers, classified
A Misreads the figure (Lesh, Post & Behr, 1987; Kirsch & Mosenthal, 1990)
Finds one face as ½ × 8 × 6 = 24 but counts only the two faces drawn in front, 2 × 24 = 48, missing the two hidden ones.
C Numbers taken from the question (Hegarty, Mayer & Monk, 1995)
Uses only the 8 cm edge, as both base and height of each face, 4 × ½ × 8 × 8 = 128, and never uses RS.
D Misreads the question (Hegarty, Mayer & Monk, 1995)
Finds the four faces, 96 sq cm, then adds the 8 × 8 = 64 sq cm base that the question says to exclude.
Worked solution, step by step
Formulas used
- Area of a triangle
- A is the area. b is the base, the side the triangle sits on. h is the height: the straight-up distance from the base to the top corner, at a right angle to the base. You take half because a triangle is half of a rectangle with the same base and height.
Sort out the pyramid
The pyramid sits on a square base, MNPQ. Each side of the square is 8 cm. Four triangle faces rise from the base and meet at the top point, R. Every face has the same area. Segment RS is 6 cm. You need the area of the four faces, “excluding the base”. Excluding means leaving it out.
See what RS measures
RS runs from R down face QRP to point S on edge QP. The small square at S marks a right angle. So RS is the height of triangle QRP. The base of that triangle is QP, one side of the square, so it is 8 cm.
Find the area of one face
Use the triangle formula with base 8 cm and height 6 cm.
One face has an area of 24 sq cm.
Add the four faces
All four faces are the same, so multiply by 4.
Watch out: only two faces are drawn in front. The other two hide behind the dashed lines. Counting just two faces gives 48, choice A. Watch out: don’t add the base, . That gives 160, choice D. So the answer is B, 96 sq cm.
Check your answer
Each face fits inside an 8 by 6 rectangle, with an area of 48 sq cm. The triangle is half of that, 24 sq cm, and four faces make 96 sq cm. That is less than 160, which would include the base.
More questions like this
The original DOE question
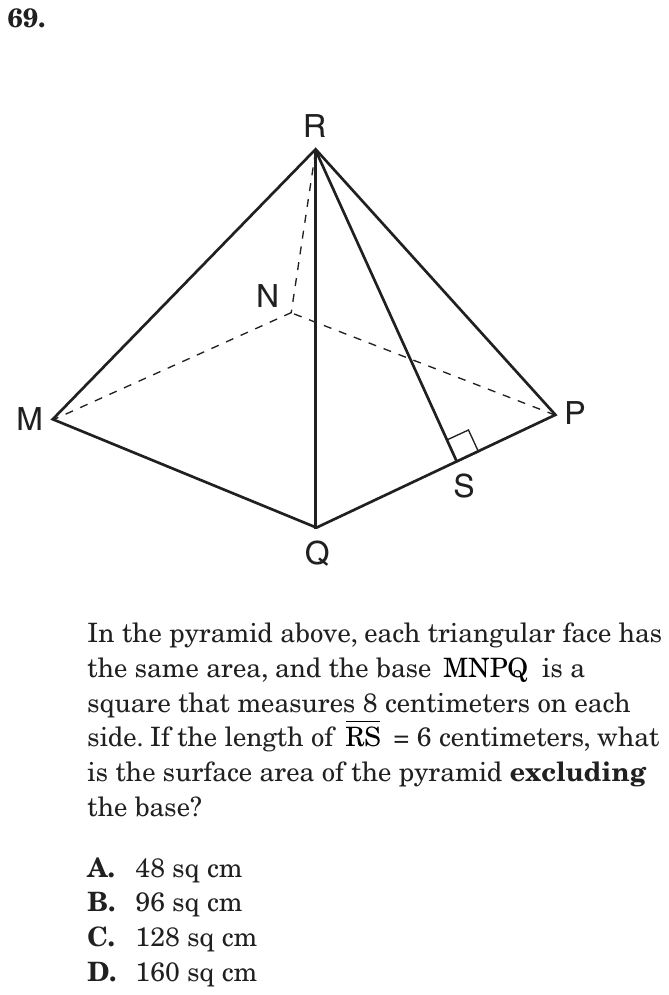
Question 26 of 27
2018 Test A Math, question 18Question
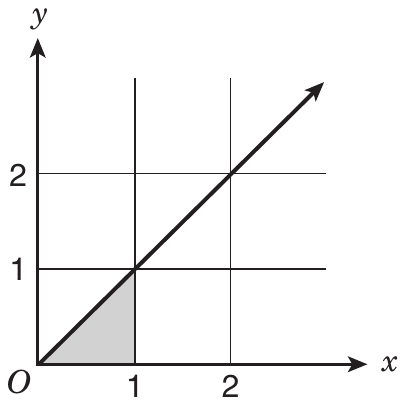
What is the area of the shaded region in the graph above?
- A0.25 square unit
- B0.5 square unit
- C1 square unit
- D1.5 square units
Show the answer
Correct answer: B
The shaded region is a right triangle. Each leg is 1 unit in length.
So the area is
or 0.5 sq unit
Question analysis
A coordinate grid question: find the area of a shaded right triangle with corners at the origin, (1, 0) and (1, 1), under a diagonal line. Students read the base and height from the grid and apply the triangle area formula. The figure does most of the work; the task is recalling the formula correctly.
- Grade level
- Grade 6 content, by NYS standard
- Compared with grade 7
- Below grade 7 Finding a triangle's area from a grid is grade 6 work, and this takes one step with whole-unit legs. It is easier than typical grade 7 area problems, which use composite figures or scale drawings.
- Estimated difficulty
- Routine: one familiar step, little to misread.
- Thinking it demands
- Depth of knowledge 1, recall and reproduction · mainly apply
- What makes it hard
- Solution
- 1 step
- Reading level
- Question and choices: about grade 2, 20 words.
- Students, last 30 days
- Not enough answers yet to show (it takes 10).
Why it is hard, traps and wrong answers (shows the answer)
Why it is hard
This is a quick formula question with legs of 1. The main risk is the one-half in the triangle formula: leaving it out gives the area of the whole grid square, which is a listed choice. Seeing that the diagonal cuts the unit square exactly in half gives a check that needs no formula at all.
Reading a figure, table or graph minor Understanding the question
The legs of the shaded triangle, from O to (1, 0) and up to (1, 1), are read off the grid lines; the line running on to (2, 2) is not part of the region. (Lesh, Post & Behr, 1987; Kirsch & Mosenthal, 1990)
Something you must already know minor Working it out
The triangle area formula, one half times base times height, is needed and not given; the shaded triangle is half of one grid square. (Anderson & Krathwohl, 2001)
Strategy: Read the two legs straight off the grid, then apply the triangle area formula, base times height divided by two.
Traps
- A formula you must know: Needs a formula the test does not give: area, circumference, volume, probability rules.
The wrong answers, classified
A Misreads the figure (Lesh, Post & Behr, 1987; Kirsch & Mosenthal, 1990)
Judges the shaded triangle by eye as a quarter of the 1-by-1 grid square instead of the half that the diagonal from O to (1, 1) cuts off.
C Wrong formula (King et al., 2004)
Multiplies base by height, 1 × 1 = 1, and leaves out the one-half, giving the whole unit square instead of the triangle.
D Little reason to choose it (Haladyna & Downing, 1993; Rodriguez, 2005)
No common working gives 1.5, which is more than the whole grid square around the shaded triangle; it mostly draws guesses.
Worked solution, step by step
Formulas used
- Area of a triangle
- A is the area. b is the base, the side the triangle sits on. h is the height: the straight-up distance from the base to the top corner, at a right angle to the base. You take half because a triangle is half of a rectangle with the same base and height.
Sort out the shaded region
The shaded region is a triangle. Its corners are O, the point (1, 0) and the point (1, 1). O is the origin, the point (0, 0) where the axes meet. The line keeps going up to (2, 2), but only the small triangle is shaded. You need its area in square units.
Read the base and height
The base lies along the x-axis, from O to 1. So the base is 1 unit. The height goes straight up from (1, 0) to (1, 1). So the height is 1 unit too. The base and height meet at a right angle, as the grid lines show.
Use the triangle formula
The area is 0.5 square unit. Watch out: don’t forget the one half. is the whole grid square, choice C. So the answer is B, 0.5 square unit.
Check your answer
The grid square from 0 to 1 has an area of 1 square unit. The slanted line cuts it corner to corner into two equal triangles. The shaded one is half the square, so 0.5 square unit.
More questions like this
The original DOE question
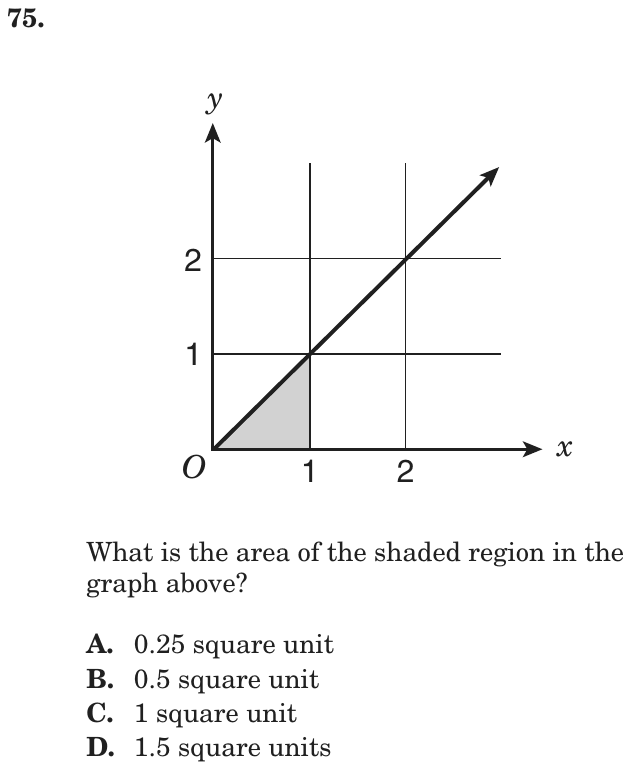
Question 27 of 27
2018 Test B Math, question 5Question
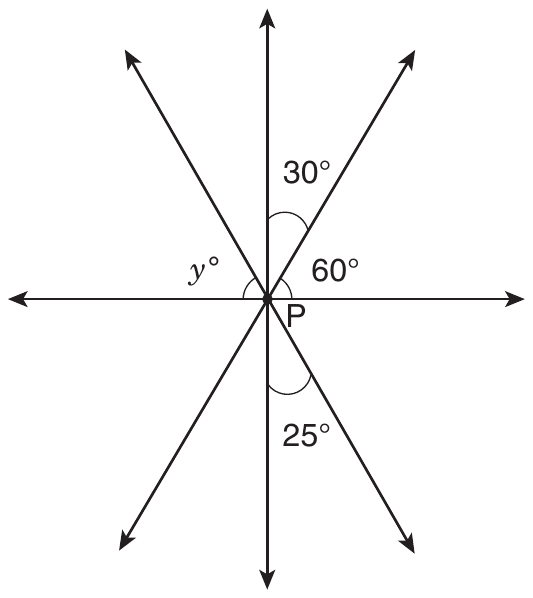
Four straight lines intersect at point P as shown above. What is the value of ?
Grid-in question: work out the answer and enter it as a number.
Show the answer
Correct answer: 65
Call the missing angle in the top half of the figure .
The sum of the four angles on the top of the figure is equal to 180°.
Since is a vertical angle with the 25° angle, then is also 25°. Use that to solve for .
Question analysis
This grid-in angle question shows four straight lines crossing at a single point P and asks for the size of an unknown angle y. Students combine vertical angles with the fact that angles along a straight line add to 180 degrees. One angle they need is unlabeled and must be found from its vertical partner.
- NYS standards
- 7.G.5 angle relationships and equations
- Grade level
- Grade 7 content, by NYS standard
- Compared with grade 7
- At grade 7 Using vertical angles and straight angles to write an equation for an unknown angle is a core grade 7 geometry task. Four lines create more angles than usual, but the reasoning stays at grade 7.
- Estimated difficulty
- Moderate: several steps, or a close reading with one strong distractor.
- Thinking it demands
- Depth of knowledge 2, skills and concepts · mainly apply
- What makes it hard
- Reading a figure, table or graph major
- Combines ideas moderate
- An answer in an unexpected form minor
- Solution
- 3 steps
- Reading level
- Question and choices: about grade 4, 16 words.
- Students, last 30 days
- Not enough answers yet to show (it takes 10).
Why it is hard, traps and wrong answers (shows the answer)
Why it is hard
The arithmetic is one subtraction; the work is in seeing the figure correctly. Students have to notice that a fourth angle sits between the 30° angle and y, recognize it as the vertical partner of the 25° angle, and then use the straight line. The drawing is not to scale: y is drawn close to the 60° angle across the vertical line, which rewards anyone who computes rather than eyeballs.
Reading a figure, table or graph major Understanding the question
Four lines make eight angles around P but only three are labeled; above the horizontal line sit 60°, 30°, an unlabeled angle and y°, and that unlabeled angle is easy to overlook. (Lesh, Post & Behr, 1987; Kirsch & Mosenthal, 1990)
Combines ideas moderate Working it out
The solution joins two facts: the unlabeled angle is vertical to the 25° angle below P, and the four angles above the horizontal line make a straight angle of 180°. (Embretson, 1998; Daniel & Embretson, 2010)
An answer in an unexpected form minor Choosing the answer
As a grid-in, nothing confirms the result, and the drawing shows y at about 60°, so a reading of the picture produces a number that looks right. (Enright, Morley & Sheehan, 2002)
Strategy: Pick a straight line through P and list the angles on one side of it; replace the unlabeled one with the labeled angle vertical to it, then subtract from 180.
Traps
- Misreads the figure: Reads a value, label or tick spacing in a figure, table or graph wrongly.
- Stops one step early: A choice is a number from partway through the solution.
- Trusting the picture: The figure suggests something it does not state; work from the given facts.
The wrong answers, classified
90 Misreads the figure (Lesh, Post & Behr, 1987; Kirsch & Mosenthal, 1990)
Misses the unlabeled angle between the 30° angle and y, so subtracts only 30 and 60 from 180.
115 Stops one step early (King et al., 2004; Gierl et al., 2017)
Adds the three known angles beside y, 25 + 30 + 60, and grids that sum without subtracting it from 180.
60 Trusting the picture (Lesh, Post & Behr, 1987)
Judges from the drawing, where y looks like a mirror image of the 60° angle across the vertical line, instead of computing it.
Worked solution, step by step
Formulas used
- Angles on a straight line
- a, b, c and d are angles that sit side by side along one side of a straight line, all meeting at one point. Together they make a half turn, which is 180 degrees. This works for any number of angles, not just four.
- Vertical angles
- When two lines cross, they make an X. Angle 1 and angle 2 are opposite each other across the crossing point. Angles like these are called vertical angles. They are always equal.
Look closely at the figure
Four lines cross at point P. Look above the flat, or horizontal, line. From right to left there are four angles: 60°, 30°, an angle with no label, and y°.
Below the horizontal line there is a 25° angle. You need to find y.
Find the unlabeled angle
The unlabeled angle sits between the up-and-down, or vertical, line and the slanted line rising to the left.
That slanted line keeps going through P and down to the right. The 25° angle sits between that same line and the vertical line, below P.
So the two angles are opposite each other across P. They are vertical angles, so they are equal. The unlabeled angle is 25°.
Add the angles above the line
The four angles above the horizontal line fill one side of a straight line. So they add up to 180°.
Solve for y
Take 115 away from 180 to get y alone.
Watch out: Do not skip the unlabeled angle. Using only 30 and 60 gives 90. Do not stop at the sum, 115, either. And do not guess from the picture. Angle y looks like 60°, but the drawing is not exact.
So you would grid 65.
Check your answer
Add all four angles above the horizontal line: . They fill a straight line exactly, so 65 fits.
More questions like this
The original DOE question