7.RP.2b constant of proportionality
Question 1 of 23
2026 Practice Test A Math, question 37Question
When a student buys 4 notebooks, the total cost is $12. Each notebook costs the same amount. Select each point on the graph that best represents y, the total cost of x notebooks.
Select all the correct answers.
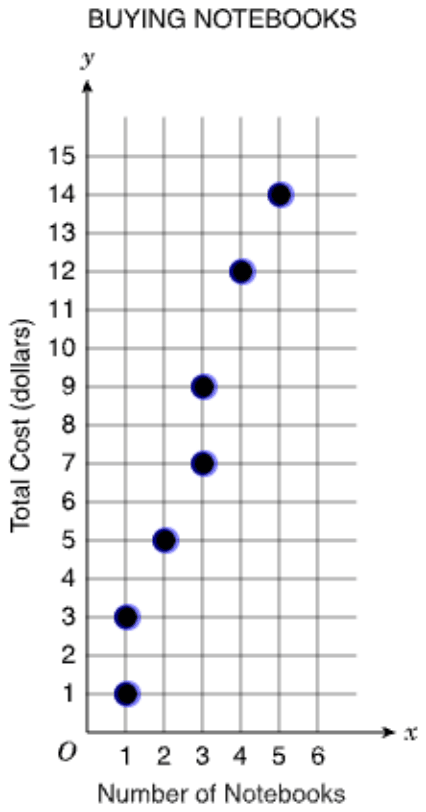
On the test you click the points in the figure; here, choose them below. The DOE has not published how answers with several parts are scored; this site counts one right only when every part is right.
- A(1, 1)
- B(1, 3)
- C(2, 5)
- D(3, 7)
- E(3, 9)
- F(4, 12)
- G(5, 14)
Show the answer
Correct answer: B, E, and F
Solution:
There are three correct points: (1, 3), (3, 9), and (4, 12).
Find the cost per notebook: .
The equation of the line is , where y is the total cost of x notebooks.
Check each point by plugging the x-value into the equation . If the y-value from the equation matches the y-value of the point, then the point is on the line .
Check all seven points:
(1, 1) y-values do not match; incorrect point
(1, 3) y-values match; CORRECT point
(2, 5) y-values do not match; incorrect point
(3, 7) y-values do not match; incorrect point
(3, 9) y-values match; CORRECT point
(4, 12) y-values match; CORRECT point
(5, 14) y-values do not match; incorrect point
Question analysis
A graph titled Buying Notebooks shows seven points, and students select every point that fits the total cost of buying notebooks, given the cost of a few notebooks and that each costs the same. It tests finding a unit rate and recognizing points of a proportional relationship. Some points line up in tempting patterns, and the item does not say how many to select.
- NYS standards
- Grade level
- Grade 7 content, by NYS standard
- Compared with grade 7
- At grade 7 Finding a unit rate and deciding which points fit a proportional relationship are grade 7 skills, and the arithmetic here is easy. What adds demand is testing all seven points with no count given, since one miss or extra pick loses the item.
- Estimated difficulty
- Straightforward: two steps or one careful reading.
- Thinking it demands
- Depth of knowledge 2, skills and concepts · mainly apply
- What makes it hard
- Solution
- 2 steps
- Reading level
- Question and choices: about grade 5, 36 words.
- Students, last 30 days
- Not enough answers yet to show (it takes 10).
Why it is hard, traps and wrong answers (shows the answer)
Why it is hard
Finding the price is one division, 12 ÷ 4 = 3, so the question is really about checking: each chosen dot must fit y = 3x exactly, and the item does not say how many do. The graph punishes judging by eye, since a straight row of dots climbs from (1, 3) at $2 a notebook and two dots sit a single gridline off the true line. Multiplying each x by 3 and reading each y from the axis, not from the pattern, settles all seven.
Every choice must be checked moderate Choosing the answer
Seven dots must each be tested against $3 a notebook, and the item never says how many fit; one missed point or one extra loses the whole item, so no dot can be skipped. (Embretson & Wetzel, 1987)
Reading a figure, table or graph minor Understanding the question
The graph stacks two dots above 1 notebook and two above 3, and each total cost has to be read off a grid ruled at every dollar up to 15. (Lesh, Post & Behr, 1987; Kirsch & Mosenthal, 1990)
A very close wrong answer minor Choosing the answer
(5, 14) sits one gridline below (5, 15), where 5 notebooks at $3 would be, and (2, 5) sits one below (2, 6), so judging by the line's direction cannot rule either out. (Embretson & Wetzel, 1987; Gorin & Embretson, 2006; Ascalon et al., 2007)
Strategy: Work out the cost of one notebook from the total given in the question, then multiply each point's x-coordinate by that price and keep only the points whose y-coordinate matches exactly.
Traps
- Misunderstands the concept: A wrong belief about a concept: that percents can be added, that area grows like length, that averages can be averaged, that a bigger denominator means a bigger fraction.
- Misreads the figure: Reads a value, label or tick spacing in a figure, table or graph wrongly.
The wrong answers, classified
A Little reason to choose it (Haladyna & Downing, 1993; Rodriguez, 2005)
No working from 4 notebooks for $12 makes one notebook cost $1, so this lowest dot mostly catches guesses, such as taking the dot nearest the origin as a start.
C Misunderstands the concept (Smith, diSessa & Roschelle, 1993; De Bock et al., 1998; Ni & Zhou, 2005)
Takes the straight row (1, 3), (2, 5), (3, 7) as the graph because its dots line up, though it climbs $2 a notebook and would meet the y-axis at $1, not the origin.
D Misunderstands the concept (Smith, diSessa & Roschelle, 1993; De Bock et al., 1998; Ni & Zhou, 2005)
Prefers the lower of the two dots above 3 notebooks because it continues the evenly spaced row from (1, 3) and (2, 5), instead of checking that 3 notebooks cost $9.
G Misreads the figure (Lesh, Post & Behr, 1987; Kirsch & Mosenthal, 1990)
Finds that 5 notebooks cost 5 × $3 = $15, then reads the dot above 5 as sitting on the top gridline, 15, when it is one line lower, at 14.
Worked solution, step by step
Formulas used
- Unit price
- The unit price is what one item costs. Divide the total cost by the number of items bought. This works because every notebook costs the same, so the total splits into equal parts.
- A proportional relationship
- y is the total cost in dollars, and x is the number of notebooks. k is the price of one notebook, the number you always multiply by. A point fits only if its y is exactly k times its x. The graph is a straight line through (0, 0).
Sort out the question
Four notebooks cost $12, and each one costs the same. On the graph, x is the number of notebooks, and y is the total cost in dollars. The graph shows seven points. You must select every point that fits. The question does not say how many fit, so test all seven.
Find the price of one notebook
Split the $12 equally among the 4 notebooks:
Each notebook costs $3. So the total cost is 3 times the number of notebooks:
Test each point
For each point, multiply its x by 3. Keep the point only if the result equals its y.
Choice Point 3 × x Fits? A (1, 1) 3 No B (1, 3) 3 Yes C (2, 5) 6 No D (3, 7) 9 No E (3, 9) 9 Yes F (4, 12) 12 Yes G (5, 14) 15 No Watch for look-alike points
Watch out: the dots (1, 3), (2, 5) and (3, 7) sit in a neat straight row. But that row climbs $2 per notebook, not $3. Lining up is not enough: (2, 5) and (3, 7), choices C and D, do not fit.
Watch out: 5 notebooks cost dollars. The dot above 5 sits one gridline lower, at 14. Read the y-axis carefully, and you will skip choice G.
Name the points
Three points fit: (1, 3), (3, 9) and (4, 12). On the test, you click each of these dots on the graph. On this site, you check their boxes. So the answers are B, E and F.
Check your answer
All three points fit : , and . They also line up with (0, 0), since 0 notebooks cost $0. And (4, 12) is the fact the question gave you.
More questions like this
The original DOE question
Question 2 of 23
2026 Practice Test B Math, question 16Question
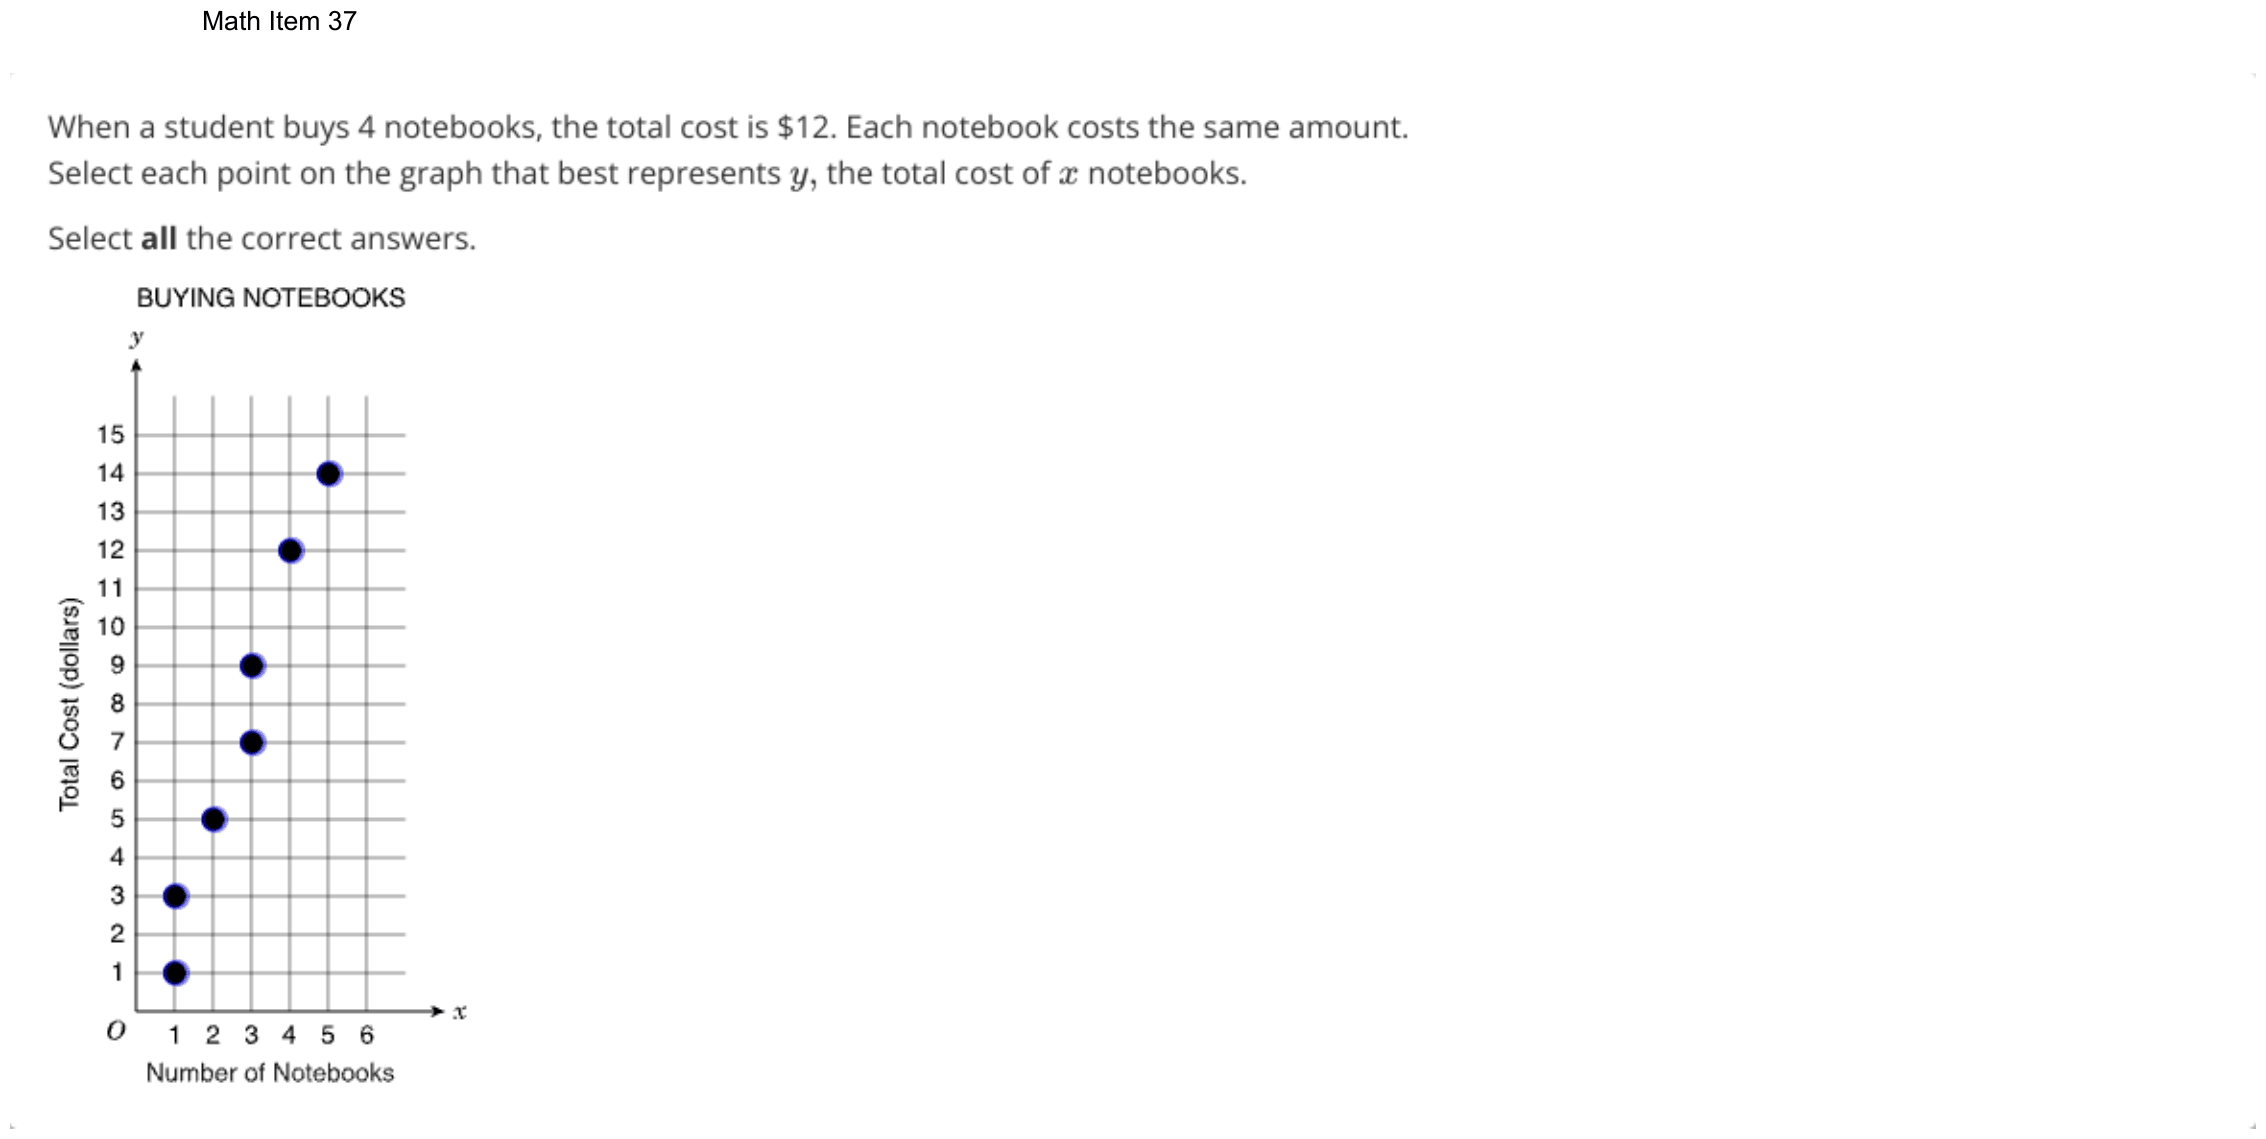
Which tables represent a proportional relationship between the number of books purchased and the total cost?
Select the two correct answers.
Choose every answer that is correct, then check. The DOE has not published how answers with several parts are scored; this site counts one right only when every part is right.
- A
Number of Books Purchased 10 15 20 25 Total Cost ($) 40 60 80 100 - B
Number of Books Purchased 10 15 20 25 Total Cost ($) 70 110 150 250 - C
Number of Books Purchased 10 15 20 25 Total Cost ($) 80 120 160 200 - D
Number of Books Purchased 10 15 20 25 Total Cost ($) 90 130 170 210 - E
Number of Books Purchased 10 15 20 25 Total Cost ($) 100 100 100 100
Show the answer
Correct answer: A and C
The two tables that represent a proportional relationship are tables A and C.
In table A, the total costs divided by the numbers of books for each set of quantities are:
These ratios are equivalent; therefore, these quantities are in a proportional relationship.
In table C, the total costs divided by the numbers of books for each set of quantities are:
These ratios are equivalent; therefore, these quantities are in a proportional relationship.
Question analysis
Five tables list the total cost of buying 10, 15, 20 and 25 books, and students select the two tables that show a proportional relationship between books and cost. It tests recognizing proportional relationships from a constant unit rate. A steady rise in cost is not enough on its own, so each pair of values has to be checked.
- Grade level
- Grade 7 content, by NYS standard
- Compared with grade 7
- At grade 7 Deciding from a table whether two quantities are proportional is a core grade 7 skill, and the divisions here are easy. The demand lies in checking every column of five tables rather than judging by how the costs change.
- Estimated difficulty
- Straightforward: two steps or one careful reading.
- Thinking it demands
- Depth of knowledge 2, skills and concepts · mainly apply
- What makes it hard
- A very close wrong answer moderate
- Every choice must be checked minor
- Something you must already know minor
- Solution
- 2 steps
- Reading level
- Question and choices: about grade 5, 51 words.
- Students, last 30 days
- Not enough answers yet to show (it takes 10).
Why it is hard, traps and wrong answers (shows the answer)
Why it is hard
The divisions are easy, so the question tests what proportional means. Three tables grow by the same amount for every 5 books, and the one with a $10 head start looks just as regular as the right one it copies; only its cost per book, drifting from $9 down to $8.40, gives it away. The flat $100 table and the one that jumps to $250 catch fewer students, and dividing the first and last column of each table is a quick, reliable check.
A very close wrong answer moderate Choosing the answer
The table running $90, $130, $170, $210 is the $80-to-$200 table with $10 added to every cost; both climb $40 for each 5 books, and only the cost per book separates them. (Embretson & Wetzel, 1987; Gorin & Embretson, 2006; Ascalon et al., 2007)
Every choice must be checked minor Choosing the answer
Five tables of four columns each have to be tested by dividing cost by books, and both right tables must be picked to score, so no table can be judged from one column. (Embretson & Wetzel, 1987)
Something you must already know minor Working it out
Students must know that proportional means the same cost per book in every column, a line through zero, not merely a cost that grows by the same amount each time. (Anderson & Krathwohl, 2001)
Strategy: Divide the total cost by the number of books in every column of each table; a table is proportional only when that cost per book stays the same all the way across.
Traps
- Misunderstands the concept: A wrong belief about a concept: that percents can be added, that area grows like length, that averages can be averaged, that a bigger denominator means a bigger fraction.
The wrong answers, classified
B Misunderstands the concept (Smith, diSessa & Roschelle, 1993; De Bock et al., 1998; Ni & Zhou, 2005)
Sees the cost climb $40 for each 5 books across the first three columns and stops checking, though the cost per book goes $7, about $7.33, $7.50, then $10.
D Misunderstands the concept (Smith, diSessa & Roschelle, 1993; De Bock et al., 1998; Ni & Zhou, 2005)
Takes the steady rise of $40 for every 5 books as proportional, but 90 ÷ 10 = 9 while 210 ÷ 25 = 8.4, so the cost per book is not constant.
E Misunderstands the concept (Smith, diSessa & Roschelle, 1993; De Bock et al., 1998; Ni & Zhou, 2005)
Mistakes a cost that never changes for a constant ratio, though $100 for 10 books is $10 a book and $100 for 25 books is $4 a book.
Worked solution, step by step
Formulas used
- Cost per book
- This is the unit rate, the price of one book. Divide the total cost in dollars by the number of books bought. If every book has the same price, this number comes out the same in every column.
- A proportional relationship
- x is the number of books, and y is the total cost in dollars. k is the cost per book, a number that never changes. In a proportional relationship, y is always k times x. So 0 books cost $0, and twice as many books cost twice as much.
Sort out the question
Each table shows the total cost of 10, 15, 20 and 25 books. Proportional means the cost per book is the same in every column. In other words, each book has one fixed price. You must pick the two tables where that is true.
Test the first table
Divide each total cost by its number of books. For table A:
Every column gives $4 per book. So table A is proportional.
Test the other four tables
Do the same division for every table. The numbers are dollars per book:
Table 10 books 15 books 20 books 25 books Same? A 4 4 4 4 Yes B 7 about 7.33 7.50 10 No C 8 8 8 8 Yes D 9 about 8.67 8.50 8.40 No E 10 about 6.67 5 4 No Only tables A and C keep the same price all the way across.
Watch for steady growth
Watch out: table D climbs $40 for every 5 more books, just like table C. That steady climb looks proportional, but it is not enough. D starts $10 higher than C, so its price per book slides from $9 down to $8.40.
Watch out: table E never changes. But $100 for 10 books is $10 each, and $100 for 25 books is $4 each. A total that stays the same is not a price that stays the same.
Name the two answers
Table A charges $4 per book and table C charges $8 per book, in every column. On the test, you check the box next to each of those tables. So the answers are A and C.
Check your answer
In a proportional table, twice the books cost twice as much. In table A, 10 books cost $40 and 20 books cost $80, which is double. In table C, $80 doubles to $160. In table D, $90 would have to double to $180, but the table shows $170. So D fails.
More questions like this
The original DOE question
Question 3 of 23
2026 Practice Test C Math, question 27Question
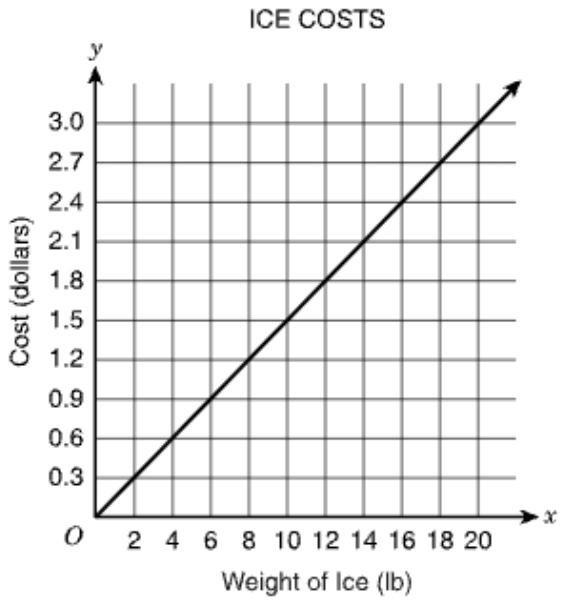
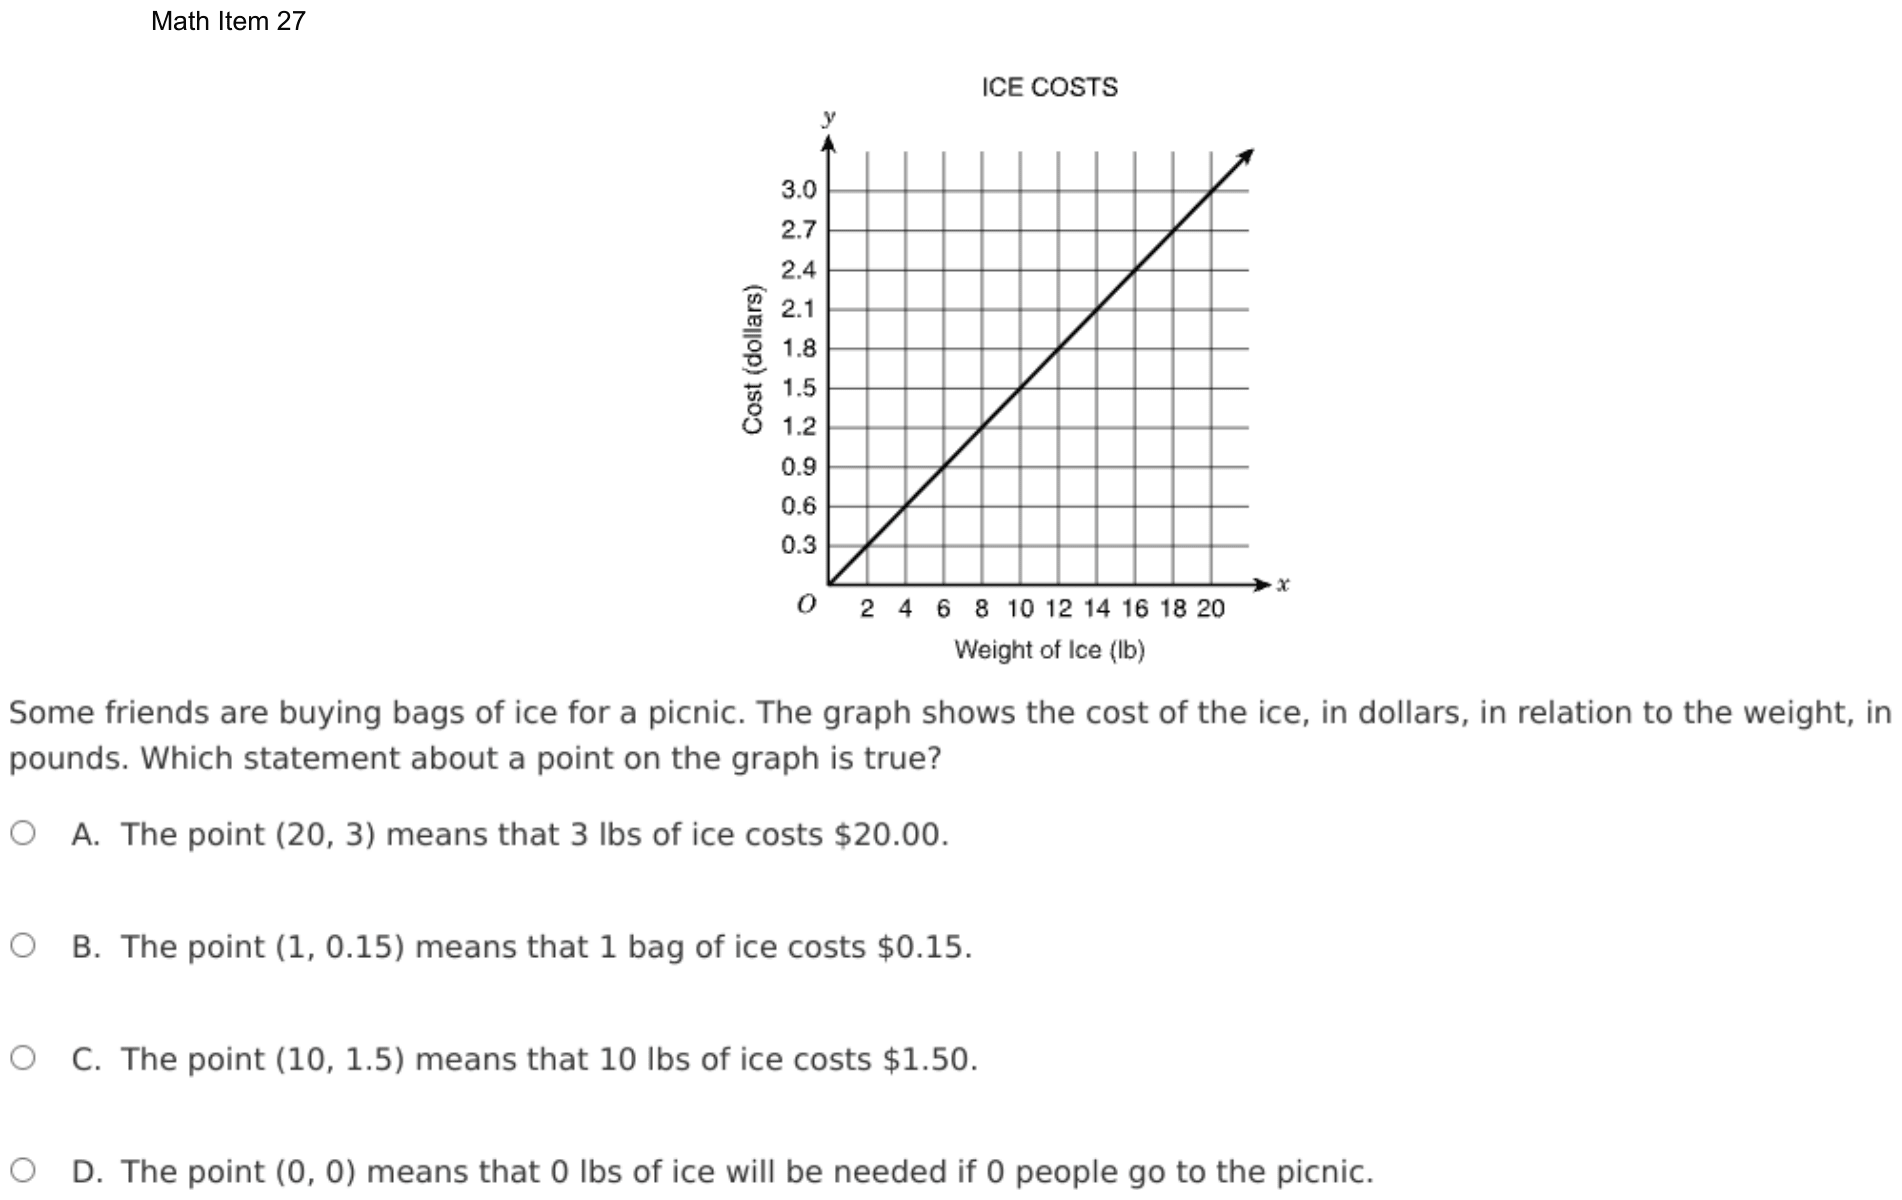
Some friends are buying bags of ice for a picnic. The graph shows the cost of the ice, in dollars, in relation to the weight, in pounds. Which statement about a point on the graph is true?
- AThe point (20, 3) means that 3 lbs of ice costs $20.00.
- BThe point (1, 0.15) means that 1 bag of ice costs $0.15.
- CThe point (10, 1.5) means that 10 lbs of ice costs $1.50.
- DThe point (0, 0) means that 0 lbs of ice will be needed if 0 people go to the picnic.
Show the answer
Correct answer: C
The x-axis represents the weight, in pounds (lbs), of ice purchased, and the y-axis represents the cost of the ice, in dollars.
The x-value in the point (10, 1.5) represents 10 lbs of ice, and the y-value represents 1.5 dollars, or $1.50. Therefore, the cost of 10 lbs of ice is $1.50.
Question analysis
Some friends buying ice for a picnic use a graph of the ice's cost in dollars against its weight in pounds, a straight line from the origin. Students pick the statement that correctly explains what a point on the graph means. Each statement names a point that really is on the line, so the units and the order of the coordinates decide.
- Grade level
- Grade 7 content, by NYS standard
- Compared with grade 7
- At grade 7 Explaining what a point on a proportional graph means in its situation is a named grade 7 skill. The graph is clear and starts at the origin, but each statement has to be read closely against the axis labels.
- Estimated difficulty
- Straightforward: two steps or one careful reading.
- Thinking it demands
- Depth of knowledge 2, skills and concepts · mainly understand
- What makes it hard
- Reading a figure, table or graph moderate
- Every choice must be checked minor
- Solution
- 2 steps
- Reading level
- Question and choices: about grade 2, 77 words.
- Students, last 30 days
- Not enough answers yet to show (it takes 10).
Why it is hard, traps and wrong answers (shows the answer)
Why it is hard
Nothing needs computing, but each statement attaches words to two numbers, and three of them attach the wrong words. The point (1, 0.15) is the unit rate students are trained to look for, and the “bags” in the stem’s story make its statement sound right, though the graph measures pounds. Saying each point aloud as so many pounds for so many dollars exposes the swapped coordinates and the extra people as well.
Reading a figure, table or graph moderate Understanding the question
Each statement must be checked against the axis labels: x is the weight of ice in pounds and y the cost in dollars, on a grid ruled every 2 pounds and every $0.30. (Lesh, Post & Behr, 1987; Kirsch & Mosenthal, 1990)
Every choice must be checked minor Choosing the answer
All four statements name a point that really lies on the line, (1, 0.15) included, so being on the graph rules nothing out; only the meaning given to each coordinate does. (Embretson & Wetzel, 1987)
Strategy: Read both axis labels and their units first, then for each choice say in words what its x-coordinate and its y-coordinate stand for, and compare that with the statement.
Traps
- Misreads the figure: Reads a value, label or tick spacing in a figure, table or graph wrongly.
- Units or scale: The answer is wanted in other units, or a rate or scale must be converted first.
- Misunderstands the concept: A wrong belief about a concept: that percents can be added, that area grows like length, that averages can be averaged, that a bigger denominator means a bigger fraction.
The wrong answers, classified
A Misreads the figure (Lesh, Post & Behr, 1987; Kirsch & Mosenthal, 1990)
Reads the point (20, 3) backward, taking 20 as the price and 3 as the weight, though x counts pounds of ice and y counts dollars.
B Units or scale (King et al., 2004)
Confirms that (1, 0.15) is on the line, the cost of 1 pound, but accepts “1 bag” because the friends buy bags, though the x-axis measures pounds.
D Misunderstands the concept (Smith, diSessa & Roschelle, 1993; De Bock et al., 1998; Ni & Zhou, 2005)
Knows (0, 0) is on every proportional graph and accepts a true-sounding story about people, though the graph never counts people; the point means 0 pounds cost $0.
Worked solution, step by step
Formulas used
- Unit rate
- The cost is in dollars, and the weight is in pounds. The unit rate is the cost of just 1 pound. On a straight line through the origin, it is the same at every point. So you can find it from any point you can read.
Sort out the question
The graph is called ICE COSTS. Read both axes first:
- The x-axis, across the bottom, is the weight of the ice in pounds (lb).
- The y-axis, up the side, is the cost in dollars.
A point is written (x, y), weight first and cost second. So a point means: x pounds of ice cost y dollars. You need the statement that says this correctly.
Find the cost of one pound
The line reaches $3.00 at 20 pounds. Use the unit rate formula:
So 1 pound of ice costs $0.15. This helps you test each point.
Test the point in choice C
Find 10 on the weight axis and go straight up to the line. The line crosses there at 1.5 on the cost axis. The unit rate agrees:
So the point (10, 1.5) means 10 pounds of ice cost $1.50. That is exactly what choice C says.
Check the other statements
Each one names a real point on the line. The problem is the meaning it gives the numbers.
Watch out: choice A reads (20, 3) backward. It means 20 pounds cost $3, not 3 pounds cost $20.
Watch out: choice B is tricky. The point (1, 0.15) is on the line, but the x-axis counts pounds, not bags. So it means 1 pound costs $0.15.
Choice D talks about people, but the graph never counts people. The point (0, 0) means 0 pounds cost $0.
Give the answer
Only choice C gives the right meaning to both numbers.
So the answer is C, 10 lbs of ice costs $1.50.
Check your answer
Use halves. The point (20, 3) says 20 pounds cost $3.00. Half as much ice, 10 pounds, should cost half as much. Half of $3.00 is $1.50. That matches choice C.
More questions like this
The original DOE question
Question 4 of 23
2026 Practice Test C Math, question 29Question
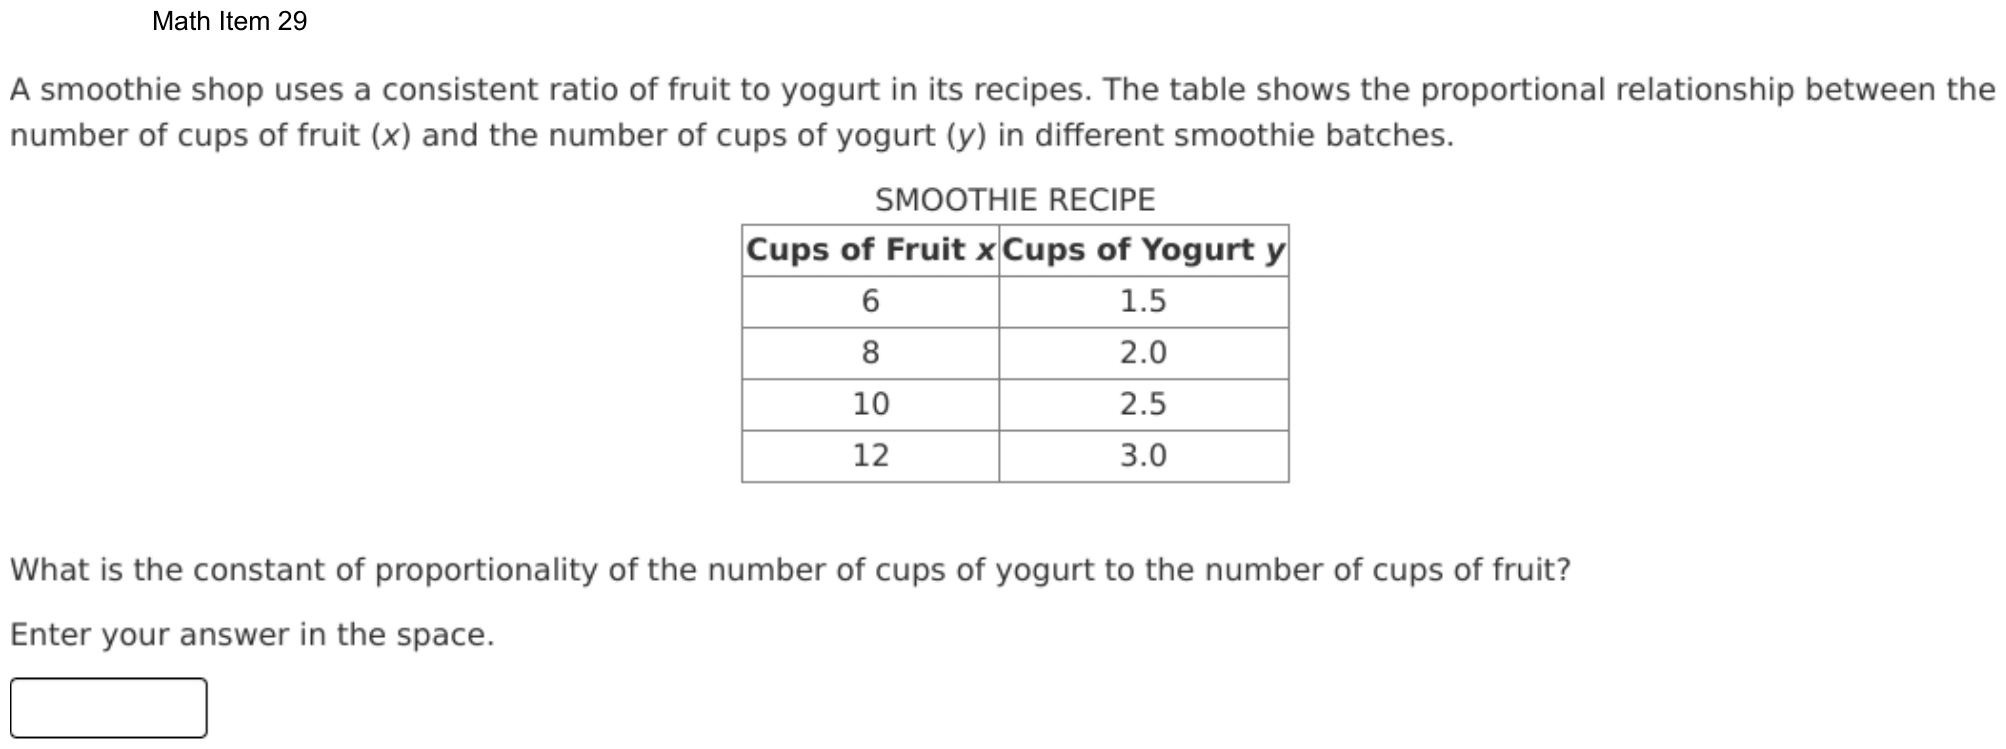
A smoothie shop uses a consistent ratio of fruit to yogurt in its recipes. The table shows the proportional relationship between the number of cups of fruit (x) and the number of cups of yogurt (y) in different smoothie batches.
SMOOTHIE RECIPE
| Cups of Fruit x | Cups of Yogurt y |
|---|---|
| 6 | 1.5 |
| 8 | 2.0 |
| 10 | 2.5 |
| 12 | 3.0 |
What is the constant of proportionality of the number of cups of yogurt to the number of cups of fruit?
Enter your answer in the space.
Fill-in question: work out the answer and type it as a number.
Show the answer
Correct answer: 0.25
To find p, the constant of proportionality of the number of cups of yogurt, y, to the number of cups of fruit, x, use the equation .
The table shows that there are 1.5 cups of yogurt for 6 cups of fruit.
The constant of proportionality is 0.25.
Question analysis
A smoothie shop's recipe table lists cups of fruit and cups of yogurt for four batches in a proportional relationship. Students type the constant of proportionality of yogurt to fruit. It tests finding a unit rate from a table, and since fruit is listed first while the question names yogurt first, the ratio is easy to take upside down.
- Grade level
- Grade 7 content, by NYS standard
- Compared with grade 7
- At grade 7 Finding the constant of proportionality in a table is a core grade 7 skill, and these values are friendly decimals. Typing the answer with no choices, and taking the ratio in the order the question gives, are the added demands.
- Estimated difficulty
- Straightforward: two steps or one careful reading.
- Thinking it demands
- Depth of knowledge 2, skills and concepts · mainly apply
- What makes it hard
- Turning words into math moderate
- An answer in an unexpected form minor
- Solution
- 1 step
- Reading level
- Question and choices: about grade 6, 75 words.
- Students, last 30 days
- Not enough answers yet to show (it takes 10).
Why it is hard, traps and wrong answers (shows the answer)
Why it is hard
Any row gives the answer with one division, and the values divide evenly, so the points are lost on direction. Fruit fills the first column and comes first in the stem’s own ratio, which invites dividing it by the yogurt. The table also climbs by a steady half cup of yogurt, a number that looks like a constant but ignores the 2 cups of fruit added each time. Checking that 0.25 times each fruit value gives its yogurt value settles it.
Turning words into math moderate Understanding the question
The opening sentence speaks of a ratio of fruit to yogurt, but the question asks for the constant of yogurt to fruit, so the division is y ÷ x, against the table’s column order. (Hegarty, Mayer & Monk, 1995; Koedinger & Nathan, 2004)
An answer in an unexpected form minor Choosing the answer
The constant is typed into a box with no choices, so 4, the ratio taken the other way round, is a believable entry that nothing on screen questions. (Enright, Morley & Sheehan, 2002)
Strategy: Check which quantity the question names first, divide that column by the other in any row, and confirm the quotient is the same in a second row.
Traps
- Wrong operation: Adds instead of multiplying, divides the wrong way round, turns a ratio or rate upside down, or undoes a step in the wrong direction (subtracts what should be added back).
- Misunderstands the concept: A wrong belief about a concept: that percents can be added, that area grows like length, that averages can be averaged, that a bigger denominator means a bigger fraction.
- Numbers taken from the question: Combines the numbers in the question without a model of the situation, or is simply a number that appears in the question.
The wrong answers, classified
4 Wrong operation (Hegarty, Mayer & Monk, 1995; King et al., 2004)
Divides cups of fruit by cups of yogurt, 6 ÷ 1.5 = 4, following the stem’s “ratio of fruit to yogurt” and turning the requested constant upside down.
0.5 Misunderstands the concept (Smith, diSessa & Roschelle, 1993; De Bock et al., 1998; Ni & Zhou, 2005)
Takes the steady rise of 0.5 cup of yogurt from row to row as the constant, ignoring that the fruit rises by 2 cups each time.
1.5 Numbers taken from the question (Hegarty, Mayer & Monk, 1995)
Gives 1.5, the first yogurt value in the table, as if the constant were an amount in one batch rather than a ratio of two amounts.
Worked solution, step by step
Formulas used
- Constant of proportionality
- k is the constant of proportionality. y and x are two matching amounts from the same row of the table. In a proportional relationship, y = kx, so y is always k times x. That is why dividing y by x gives the same k in every row.
Sort out the question
The table lists cups of fruit (x) and cups of yogurt (y) for four batches. You need the constant of proportionality of yogurt to fruit.
That is the number of cups of yogurt for each 1 cup of fruit. It is also the number you multiply x by to get y.
Divide yogurt by fruit
Use the first row: 6 cups of fruit and 1.5 cups of yogurt. Yogurt goes on top, because the question says yogurt to fruit:
So there is 0.25 cup, or one quarter of a cup, of yogurt for each cup of fruit.
Watch out: the first sentence says fruit to yogurt, but the question asks the other way. Dividing turns the answer upside down.
Check two more rows
The constant must be the same in every row. Test two more:
They match. Watch out: the yogurt goes up by 0.5 cup from row to row. That 0.5 is not the constant. The fruit goes up by 2 cups at the same time, and .
Enter the number
Type only the number in the box, with no units. You can type 0.25 or .25. On this site, 1/4 counts too.
So you would enter 0.25.
Check your answer
Multiply each amount of fruit by 0.25. , , and . Every result matches the yogurt column. Also, each batch has less yogurt than fruit, so the constant should be less than 1.
More questions like this
The original DOE question
Question 5 of 23
2026 Practice Test C Math, question 47Question
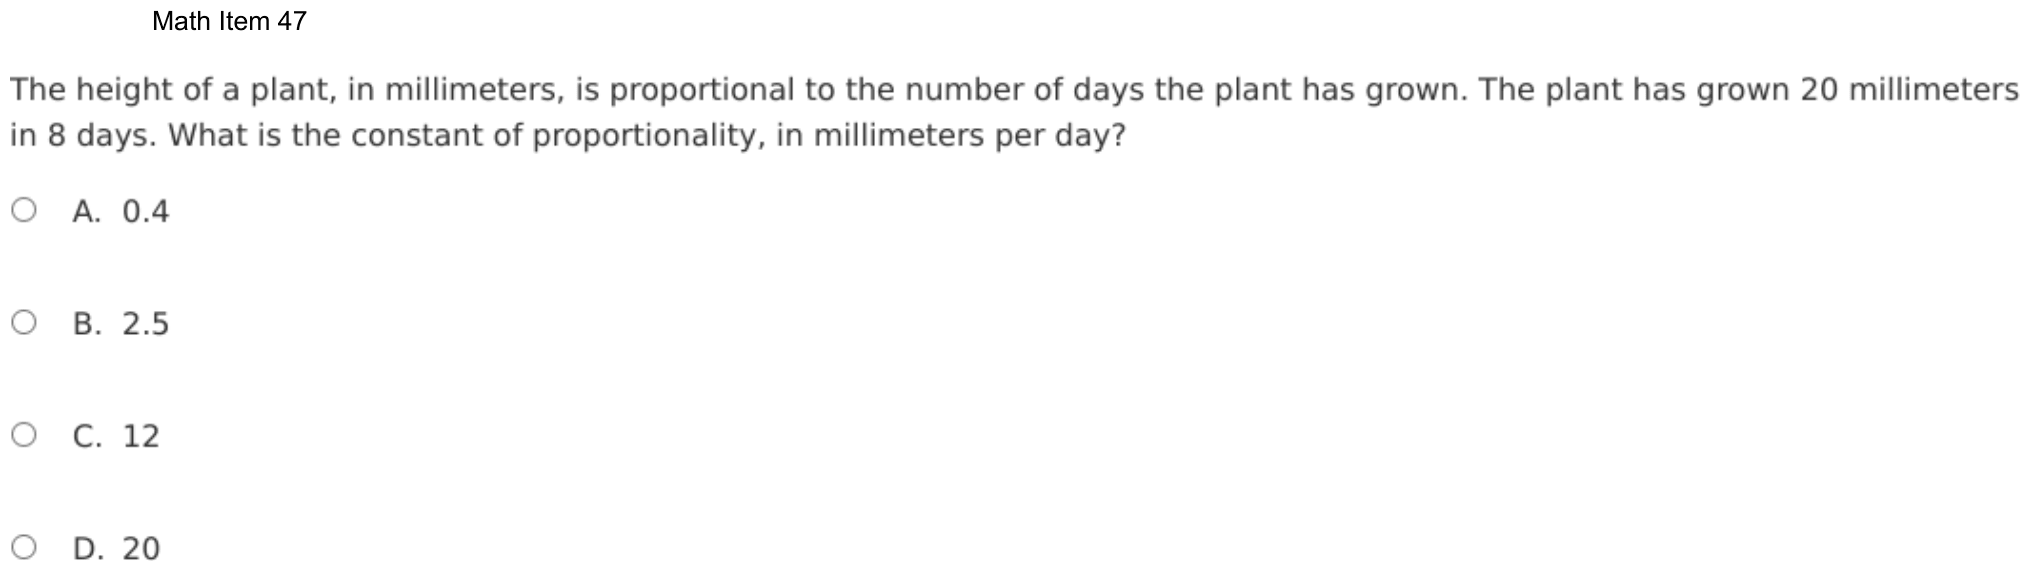
The height of a plant, in millimeters, is proportional to the number of days the plant has grown. The plant has grown 20 millimeters in 8 days. What is the constant of proportionality, in millimeters per day?
- A0.4
- B2.5
- C12
- D20
Show the answer
Correct answer: B
The constant of proportionality is determined by dividing the number of millimeters by the number of days:
Question analysis
A plant's height in millimeters is proportional to the number of days it has grown, and it grew 20 millimeters in 8 days. Students find the constant of proportionality in millimeters per day. It tests finding a unit rate, and the order of the division decides whether the rate comes out in the units asked for.
- Grade level
- Grade 7 content, by NYS standard
- Compared with grade 7
- Below grade 7 Finding a constant of proportionality from one pair of values is a basic grade 7 skill. With one division and the units named in the question, it asks less than most grade 7 problems.
- Estimated difficulty
- Routine: one familiar step, little to misread.
- Thinking it demands
- Depth of knowledge 1, recall and reproduction · mainly apply
- What makes it hard
- Solution
- 1 step
- Reading level
- Question and choices: about grade 7, 35 words.
- Students, last 30 days
- Not enough answers yet to show (it takes 10).
Why it is hard, traps and wrong answers (shows the answer)
Why it is hard
One division gives the constant, and the question itself names the order by asking for millimeters per day. The tempting slip is dividing the smaller number by the larger, 8 by 20, out of habit, which gives a rate in days per millimeter. A plant that grows 20 millimeters in 8 days grows more than 2 millimeters a day, a quick sense check on any result.
Something you must already know minor Working it out
Students must know that the constant is the height divided by the days; the units in the question, millimeters per day, name the order of the division. (Anderson & Krathwohl, 2001)
Strategy: Use the units in the question, millimeters per day, as the instruction: divide the millimeters grown by the number of days.
Traps
- Wrong operation: Adds instead of multiplying, divides the wrong way round, turns a ratio or rate upside down, or undoes a step in the wrong direction (subtracts what should be added back).
- Numbers taken from the question: Combines the numbers in the question without a model of the situation, or is simply a number that appears in the question.
The wrong answers, classified
A Wrong operation (Hegarty, Mayer & Monk, 1995; King et al., 2004)
Divides the days by the millimeters, 8 ÷ 20 = 0.4, which gives days per millimeter, the rate turned upside down.
C Numbers taken from the question (Hegarty, Mayer & Monk, 1995)
Subtracts the days from the millimeters, 20 − 8 = 12, combining the two numbers without thinking about a rate.
D Numbers taken from the question (Hegarty, Mayer & Monk, 1995)
Gives the 20 millimeters the plant grew over all 8 days, the total growth, rather than the growth for each single day.
Worked solution, step by step
Formulas used
- Constant of proportionality
- Here y is the height in millimeters, and x is the number of days. k is the growth in one day, in millimeters per day. In a proportional relationship, y = kx, so dividing y by x gives k.
Sort out the question
The plant’s height is proportional to the number of days it grows. It grew 20 millimeters (mm) in 8 days.
You need the constant of proportionality in millimeters per day. Per day means for each day. So you need how much the plant grows in one day.
Divide millimeters by days
The units tell you the order: millimeters per day means millimeters divided by days. Use the formula:
So the plant grows 2.5 mm each day.
Avoid the tempting slips
Watch out: , choice A, is days per millimeter. That is the rate upside down.
Choice C, 12, comes from . Subtracting does not make a rate. Choice D, 20, is the growth over all 8 days, not one day.
Give the answer
The constant of proportionality is 2.5 mm per day.
So the answer is B, 2.5.
Check your answer
Multiply back. At 2.5 mm a day for 8 days, the plant grows mm. That matches. Also, 2 mm a day would give only 16 mm, and 3 mm a day would give 24 mm. So the rate must be between 2 and 3.
More questions like this
The original DOE question
Question 6 of 23
2026 Practice Test C Math, question 48Question
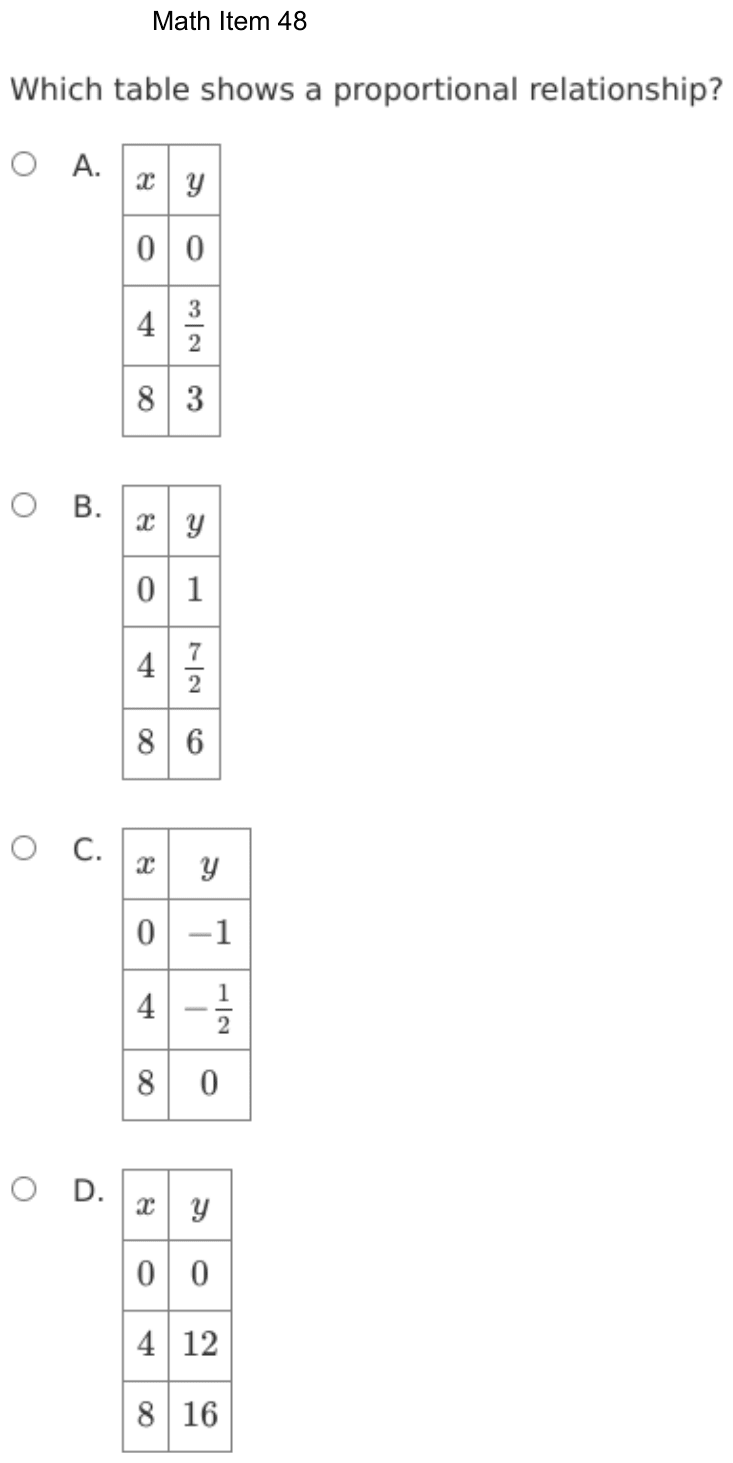
Which table shows a proportional relationship?
- A
x y 0 0 4 8 3 - B
x y 0 1 4 8 6 - C
x y 0 −1 4 8 0 - D
x y 0 0 4 12 8 16
Show the answer
Correct answer: A
The first table is the only one with a constant of proportionality, .
In each ordered pair, .
Question analysis
Four tables each give y for x = 0, 4 and 8, with some values written as fractions or negatives. Students choose the table that shows a proportional relationship. It tests recognizing proportional relationships from a table, which means checking every row against one rule rather than judging by the pattern.
- Grade level
- Grade 7 content, by NYS standard
- Compared with grade 7
- At grade 7 Deciding from a table whether a relationship is proportional is a core grade 7 skill. The fractions and negative values in the tables make each ratio a careful check rather than a glance.
- Estimated difficulty
- Straightforward: two steps or one careful reading.
- Thinking it demands
- Depth of knowledge 2, skills and concepts · mainly apply
- What makes it hard
- Every choice must be checked moderate
- Error-prone arithmetic minor
- Solution
- 2 steps
- Reading level
- Question and choices: about grade 9, 13 words.
- Students, last 30 days
- Not enough answers yet to show (it takes 10).
Why it is hard, traps and wrong answers (shows the answer)
Why it is hard
Two quick tests decide proportionality, and the tables are built so that each test alone lets a wrong table through. The last table starts at (0, 0) like the right one, while the middle two grow by equal steps like the right one. Only checking that y ÷ x is the same in every row with x not 0 separates the one table whose ratio stays at 3/8.
Every choice must be checked moderate Choosing the answer
Each table has to be tested row by row, and two of them start at (0, 0), so the opening row settles nothing; only y ÷ x in the other rows separates them. (Embretson & Wetzel, 1987)
Error-prone arithmetic minor Working it out
The y-values include 3/2, 7/2 and −1/2, so the ratios mean dividing fractions by 4, such as (3/2) ÷ 4 = 3/8, and comparing them with 3 ÷ 8. (Brown & Burton, 1978; Junker & Sijtsma, 2001)
Strategy: For each table, divide y by x in every row where x is not zero, and check that the quotient never changes and that y is 0 when x is 0.
Traps
- Misunderstands the concept: A wrong belief about a concept: that percents can be added, that area grows like length, that averages can be averaged, that a bigger denominator means a bigger fraction.
- Checks only one number: Tries one value in each choice and takes the first that works, when that value happens to work for a wrong choice too; a second value would rule it out.
The wrong answers, classified
B Misunderstands the concept (Smith, diSessa & Roschelle, 1993; De Bock et al., 1998; Ni & Zhou, 2005)
Sees y rise by the same 5/2 each time x rises by 4 and takes the steady change as proportional, missing that y is 1 when x is 0.
C Misreads the figure (Lesh, Post & Behr, 1987; Kirsch & Mosenthal, 1990)
Spots a 0 in the y column and a steady rise of 1/2, but that 0 belongs to x = 8, while at x = 0 the table gives −1.
D Checks only one number (Schoenfeld, 1985)
Checks only the row (0, 0), which every proportional table has, or only 12 ÷ 4 = 3, without testing 16 ÷ 8 = 2 in the last row.
Worked solution, step by step
Formulas used
- Proportional relationship
- y and x are the two amounts in each row. k is the constant of proportionality, the same number in every row. Two tests follow from it. When x is 0, y must be 0. And y ÷ x must equal k in every row where x is not 0.
Sort out the question
Each table gives y for x = 0, 4 and 8. You need the one that shows a proportional relationship. That means y is always the same number times x.
Use two tests. First, y must be 0 when x is 0. Second, y ÷ x must be the same in the other rows.
Test the row where x is 0
Look at the top row of each table:
- Table A: y = 0. It passes.
- Table B: y = 1. It fails.
- Table C: y = −1. It fails.
- Table D: y = 0. It passes.
Watch out: tables B and C go up by equal steps. Steady steps are not enough, because they do not start at 0. Table C does have a 0, but it is next to x = 8.
Test the ratio in table A
Divide y by x. Dividing by 4 is the same as multiplying by :
Both rows give . Table A passes both tests.
Test the ratio in table D
Divide y by x in the same way:
The ratios are different, so table D is not proportional.
Watch out: table D starts at (0, 0) like a proportional table. If you check only that row, or only the row with 4, you will pick choice D.
Give the answer
Only table A starts at (0, 0) and keeps y ÷ x the same.
So the answer is A, the table with y = 0, and 3.
Check your answer
Use the rule for table A, . When x = 4, . When x = 8, . Both match. Doubling x from 4 to 8 also doubles y.
More questions like this
The original DOE question
Question 7 of 23
2026 Practice Test D Math, question 11Question
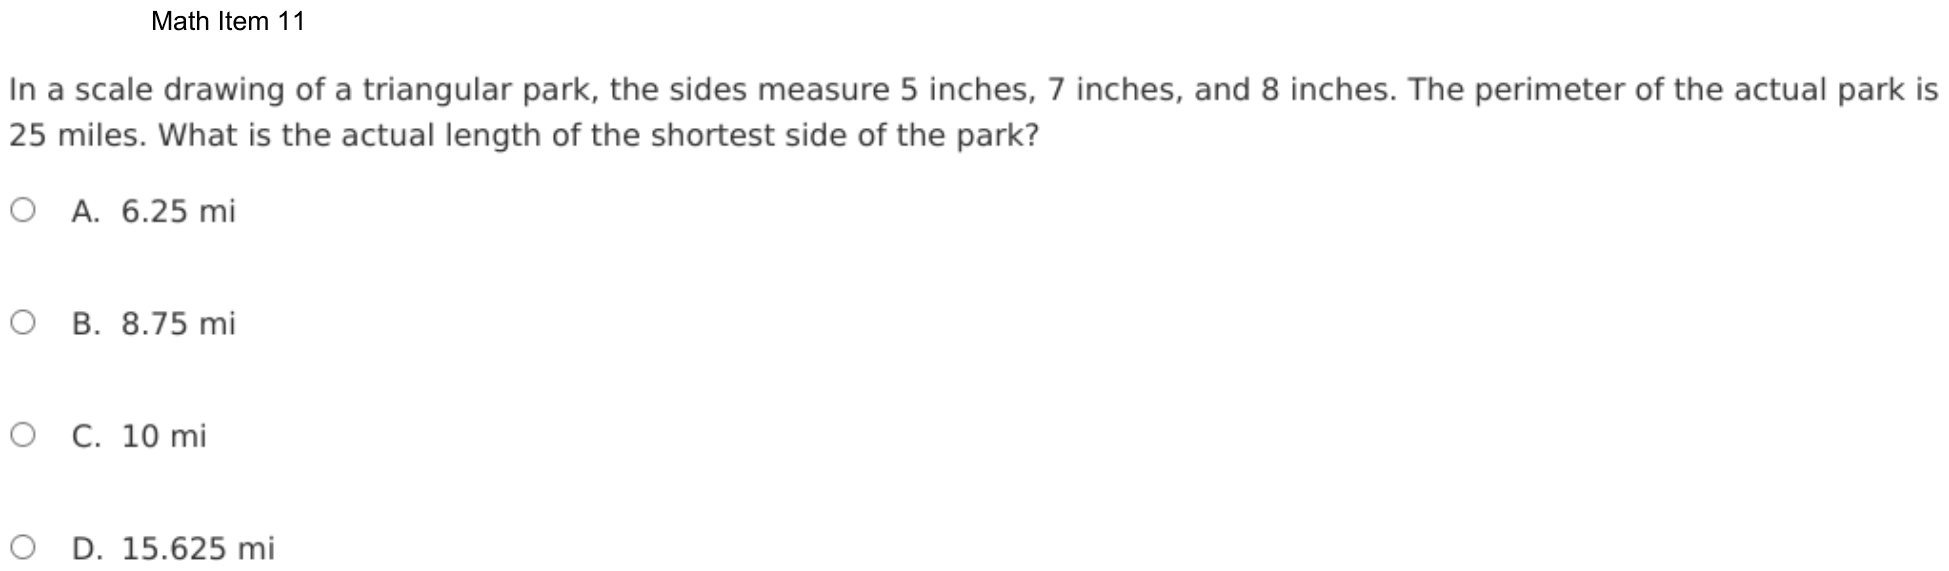
In a scale drawing of a triangular park, the sides measure 5 inches, 7 inches, and 8 inches. The perimeter of the actual park is 25 miles. What is the actual length of the shortest side of the park?
- A6.25 mi
- B8.75 mi
- C10 mi
- D15.625 mi
Show the answer
Correct answer: A
To find the perimeter of a triangle, add the measures of the three sides. The perimeter of the scale drawing is inches.
Now, use the perimeters to find the scale factor for the scale drawing to the actual perimeter.
The scale factor is 20 inches to 25 miles, which reduces to a scale factor of 4 inches to 5 miles. Note that the scale for the perimeter is the same as the scale for the side lengths.
Since the smallest side on the scale drawing is 5 inches, use the scale factor to find the actual side length of the smallest side:
Question analysis
A scale drawing of a triangular park has sides of 5, 7 and 8 inches, and the real park's perimeter is 25 miles. Students find the actual length of the park's shortest side. It tests scale drawings and proportional reasoning; the scale is not given directly, so it must be worked out from the two perimeters first.
- Grade level
- Grade 7 content, by NYS standard
- Compared with grade 7
- At grade 7 Scale drawings are a grade 7 topic, and this is a standard scale problem. The one twist is that the scale is not stated: it must come from comparing the two perimeters before any side can be converted.
- Estimated difficulty
- Straightforward: two steps or one careful reading.
- Thinking it demands
- Depth of knowledge 2, skills and concepts · mainly apply
- What makes it hard
- Turning words into math minor
- Many steps minor
- Solution
- 3 steps
- Reading level
- Question and choices: about grade 2, 39 words.
- Students, last 30 days
- Not enough answers yet to show (it takes 10).
Why it is hard, traps and wrong answers (shows the answer)
Why it is hard
A scale drawing multiplies every length by one factor, and the perimeter shares that factor, so the work is short once the two perimeters are paired. The common loss is reasoning with differences: the perimeter grows by 5, so a side seems to grow by 5 as well. Converting to miles per inch first, then checking that the three real sides add back to 25 miles, guards against that error and against scaling the wrong side.
Turning words into math minor Understanding the question
The 25 miles is the park's perimeter, not a side, so it must be matched with the drawing's perimeter, 5 + 7 + 8 = 20 inches, before any side can be scaled. (Hegarty, Mayer & Monk, 1995; Koedinger & Nathan, 2004)
Many steps minor Working it out
Three operations in a row, adding the sides, dividing 25 by 20 for 1.25 miles per inch, and multiplying the 5-inch side, each produce a number the next step needs. (Daniel & Embretson, 2010; Enright, Morley & Sheehan, 2002)
Strategy: Add the three drawn sides to get the drawing's perimeter, divide the real perimeter by it to find the miles per inch, then multiply the shortest drawn side by that scale.
Traps
- Answers a different question: A choice is right for another quantity: the other unknown, the rest instead of the part, the part instead of the whole.
- Misreads the question: Misses or misreads a condition or a word in the question: "at least", "each", "remaining", "not".
The wrong answers, classified
B Answers a different question (King et al., 2004; Hegarty, Mayer & Monk, 1995)
Finds the scale of 1.25 miles per inch but applies it to the 7-inch side, the middle one, giving 8.75 miles instead of the shortest side.
C Misunderstands the concept (Smith, diSessa & Roschelle, 1993; De Bock et al., 1998; Ni & Zhou, 2005)
Keeps a constant difference instead of a constant ratio: the perimeter grows by 5, from 20 to 25, so it adds 5 to the 5-inch side.
D Misreads the question (Hegarty, Mayer & Monk, 1995)
Pairs the 25 miles with the longest side, 8 inches, instead of the 20-inch perimeter, so each inch seems to be 3.125 miles and 5 inches 15.625.
Worked solution, step by step
Formulas used
- Perimeter of a triangle
- P is the perimeter, the distance all the way around. a, b and c are the lengths of the three sides. You add them because going once around the triangle covers each side once.
- Using a scale
- The drawing length is measured on the drawing, in inches. Miles per inch is how many real miles each inch stands for. In a scale drawing, every length is multiplied by the same number, so the perimeter and each side use the same scale.
Sort out the question
A scale drawing is a smaller copy, with every length shrunk by the same amount. The drawing’s sides are 5, 7 and 8 inches. The real park’s perimeter, the distance all the way around, is 25 miles. You need the real length of the shortest side.
Find the drawing’s perimeter
Add the three sides of the drawing:
The drawing’s perimeter is 20 inches. It stands for the real perimeter of 25 miles.
Watch out: 25 miles is the whole way around, not one side. Matching it with the 8-inch side gives 15.625 miles, choice D.
Find the scale
20 inches stand for 25 miles. Divide to find how many miles 1 inch stands for:
So each inch on the drawing is 1.25 miles in the park.
Scale the shortest side
The shortest side on the drawing is 5 inches. Multiply it by the scale:
The real shortest side is 6.25 miles.
Watch out: the perimeter grew by 5, from 20 to 25, but you cannot just add 5 to a side. That gives 10 miles, choice C. Scaling multiplies. Also use the 5-inch side, not the 7-inch side, which gives 8.75 miles, choice B.
So the answer is A, 6.25 mi.
Check your answer
Scale all three sides: 5 × 1.25 = 6.25, 7 × 1.25 = 8.75 and 8 × 1.25 = 10. Add them: 6.25 + 8.75 + 10 = 25 miles. That is the park’s perimeter, so the scale is right.
More questions like this
The original DOE question
Question 8 of 23
2026 Practice Test D Math, question 16Question
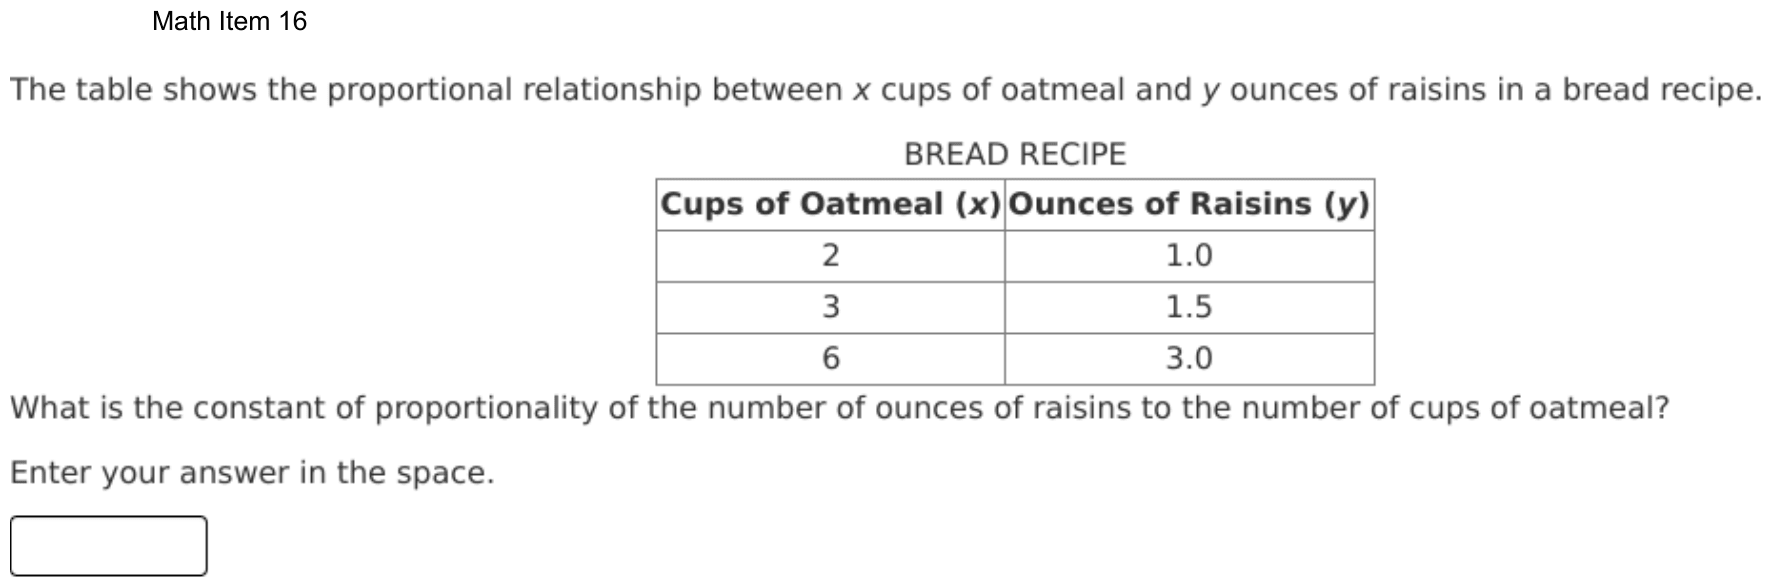
The table shows the proportional relationship between x cups of oatmeal and y ounces of raisins in a bread recipe.
BREAD RECIPE
| Cups of Oatmeal (x) | Ounces of Raisins (y) |
|---|---|
| 2 | 1.0 |
| 3 | 1.5 |
| 6 | 3.0 |
What is the constant of proportionality of the number of ounces of raisins to the number of cups of oatmeal?
Enter your answer in the space.
Fill-in question: work out the answer and type it as a number.
Show the answer
Correct answer: 0.5
To find p, the constant of proportionality of ounces of raisins, y, to cups of oatmeal, x, use the equation .
The table shows that there is 1 ounce of raisins for 2 cups of oatmeal.
The constant of proportionality is 0.5.
Question analysis
A table for a bread recipe lists cups of oatmeal and the ounces of raisins that go with them, in a proportional relationship. Students type the constant of proportionality of raisins to oatmeal. It tests reading a unit rate from a table, and the order in which the question names the two quantities matters.
- NYS standards
- 7.RP.2b constant of proportionality
- Grade level
- Grade 7 content, by NYS standard
- Compared with grade 7
- Below grade 7 Finding a constant of proportionality from a table is a grade 7 standard, and here a single division in one row gives it. The demand is lighter than typical grade 7 work; the order of the ratio in the wording needs the most care.
- Estimated difficulty
- Straightforward: two steps or one careful reading.
- Thinking it demands
- Depth of knowledge 1, recall and reproduction · mainly apply
- What makes it hard
- Turning words into math moderate
- An answer in an unexpected form minor
- Solution
- 1 step
- Reading level
- Question and choices: about grade 6, 56 words.
- Students, last 30 days
- Not enough answers yet to show (it takes 10).
Why it is hard, traps and wrong answers (shows the answer)
Why it is hard
Every row gives the same ratio, so the division itself is easy; the question tests which quantity goes on top. Because oatmeal comes first in the table and its numbers are the larger ones, dividing cups by ounces feels natural and produces a clean whole number. Writing the relationship as y = kx, raisins equal k times oatmeal, and checking it on a second row such as 3 cups and 1.5 ounces fixes the order.
Turning words into math moderate Understanding the question
The phrase “of the number of ounces of raisins to the number of cups of oatmeal” fixes the order y ÷ x, while the table lists oatmeal first, inviting 2 ÷ 1.0. (Hegarty, Mayer & Monk, 1995; Koedinger & Nathan, 2004)
An answer in an unexpected form minor Choosing the answer
The constant is typed in with no choices, so an upside-down ratio of 2, a whole number, looks as finished as the decimal the table actually gives. (Enright, Morley & Sheehan, 2002)
Strategy: Divide an ounces-of-raisins value by the cups of oatmeal in the same row, in the order the question names them, and check that every row gives the same value.
Traps
- Wrong operation: Adds instead of multiplying, divides the wrong way round, turns a ratio or rate upside down, or undoes a step in the wrong direction (subtracts what should be added back).
- Numbers taken from the question: Combines the numbers in the question without a model of the situation, or is simply a number that appears in the question.
The wrong answers, classified
2 Wrong operation (Hegarty, Mayer & Monk, 1995; King et al., 2004)
Divides cups of oatmeal by ounces of raisins, 2 ÷ 1.0, turning the ratio upside down: cups per ounce instead of ounces per cup.
1 Numbers taken from the question (Hegarty, Mayer & Monk, 1995)
Reads the first raisin amount, 1.0 ounce, as the constant without dividing it by the 2 cups of oatmeal in the same row.
Worked solution, step by step
Formulas used
- Constant of proportionality
- x and y are two amounts that grow together at the same rate. k is the constant of proportionality, the number you always multiply x by to get y. Here y is ounces of raisins and x is cups of oatmeal, so k is ounces of raisins per cup of oatmeal.
Sort out the question
The table shows cups of oatmeal, x, and ounces of raisins, y. Proportional means the raisins are always the same multiple of the oatmeal. That multiple is the constant of proportionality. The question asks for raisins to oatmeal. So you want ounces of raisins for each cup of oatmeal: y ÷ x.
Divide y by x in one row
Use the first row of the table: 2 cups of oatmeal go with 1.0 ounce of raisins.
So there is 0.5 ounce of raisins for each cup of oatmeal.
Check the other rows
A constant must be the same in every row:
Every row gives 0.5, so the rule is .
Watch out: the table lists oatmeal first, which tempts you to divide 2 by 1.0. That gives 2, which is cups per ounce, the ratio upside down. And 1.0 alone is just one raisin amount, not the constant.
Enter the answer
Type the constant in the box as a number, with no units. On this site, 0.5, .5 and 1/2 all count.
So you would enter 0.5.
Check your answer
Multiply each oatmeal amount by 0.5: 2 × 0.5 = 1.0, 3 × 0.5 = 1.5 and 6 × 0.5 = 3.0. Each result matches the raisins in its row. Also, every raisin number is smaller than its oatmeal number, so the constant must be less than 1.
More questions like this
The original DOE question
Question 9 of 23
2026 Practice Test D Math, question 41Question
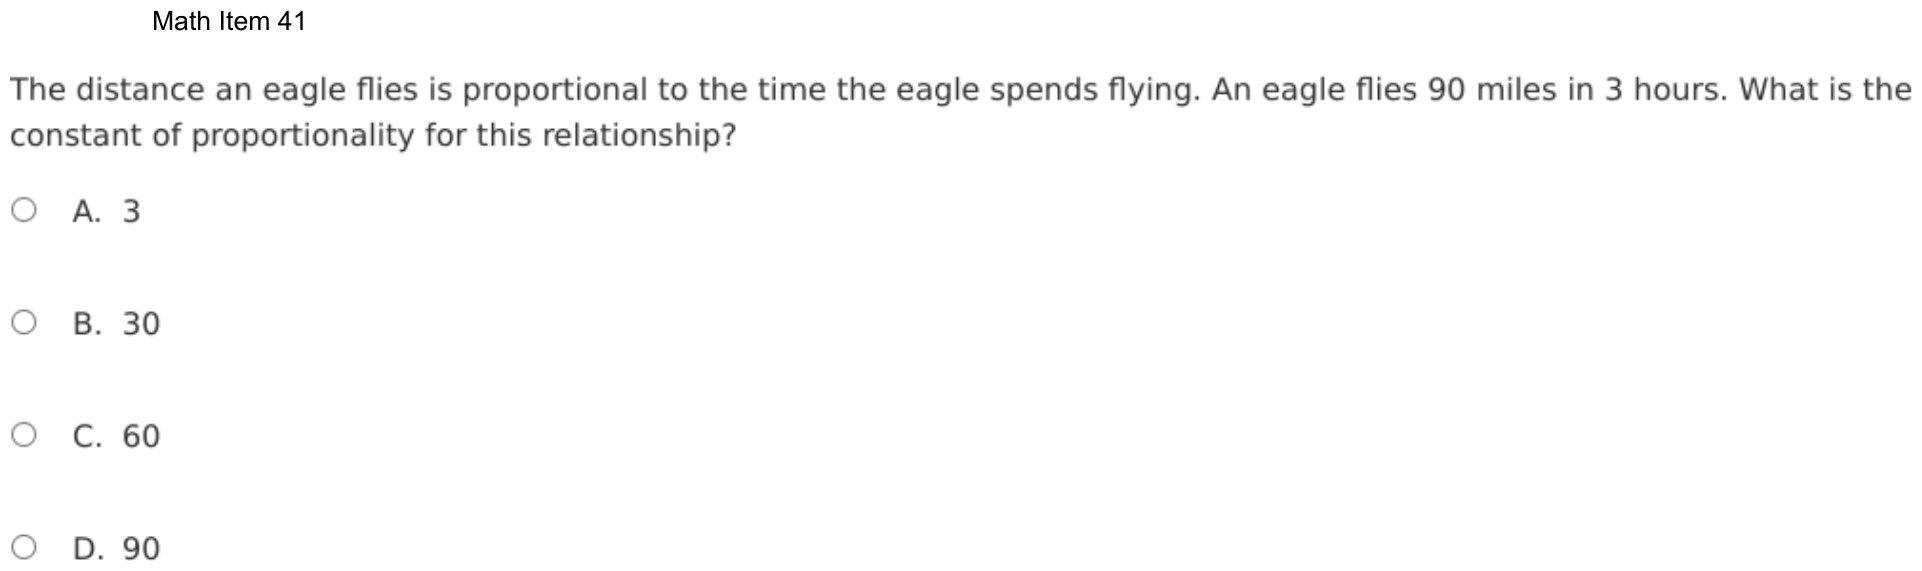
The distance an eagle flies is proportional to the time the eagle spends flying. An eagle flies 90 miles in 3 hours. What is the constant of proportionality for this relationship?
- A3
- B30
- C60
- D90
Show the answer
Correct answer: B
The constant of proportionality is the ratio of y (90) to x (3). . So the constant of proportionality is 30.
Question analysis
An eagle flies 90 miles in 3 hours, and the distance it flies is proportional to its flying time. This proportional relationship question asks for the constant of proportionality. Students need to know that the constant is the unit rate, here miles per hour, and find it from the two values given.
- NYS standards
- 7.RP.2b constant of proportionality
- Grade level
- Grade 7 content, by NYS standard
- Compared with grade 7
- Below grade 7 Grade 7 students find constants of proportionality in tables, graphs and equations. This one is a single division of miles by hours given in a sentence, the same unit rate work students do in grade 6.
- Estimated difficulty
- Routine: one familiar step, little to misread.
- Thinking it demands
- Depth of knowledge 1, recall and reproduction · mainly apply
- What makes it hard
- Solution
- 1 step
- Reading level
- Question and choices: about grade 7, 29 words.
- Students, last 30 days
- Not enough answers yet to show (it takes 10).
Why it is hard, traps and wrong answers (shows the answer)
Why it is hard
One division answers the question, so it is among the easiest on the test. The wrong choices are the two numbers in the stem and one unrelated value, so a student who knows what the constant means is not tempted. Checking that the constant times 3 hours gives back the 90 miles confirms it.
Something you must already know minor Working it out
Students must know that the constant of proportionality is the unit rate, distance over time, here the miles flown in a single hour; the stem gives only the term. (Anderson & Krathwohl, 2001)
Strategy: Divide the distance by the time, because the constant of proportionality is the distance flown in one hour, then check by multiplying it by the 3 hours.
Traps
- Numbers taken from the question: Combines the numbers in the question without a model of the situation, or is simply a number that appears in the question.
The wrong answers, classified
A Numbers taken from the question (Hegarty, Mayer & Monk, 1995)
Gives the 3 hours printed in the stem as the constant, instead of the miles flown in each hour.
C Little reason to choose it (Haladyna & Downing, 1993; Rodriguez, 2005)
No working from 90 miles and 3 hours leads to 60, which may echo the 60 minutes in an hour, so it mostly attracts guesses.
D Numbers taken from the question (Hegarty, Mayer & Monk, 1995)
Gives the 90 miles, the distance for the whole 3-hour flight, as if the eagle covered it in a single hour.
Worked solution, step by step
Formulas used
- Proportional relationship
- x is one amount, here the time in hours, and y is the other, here the distance in miles. k is the constant of proportionality. It is the same for every pair, and it equals y divided by x. Here it is the miles flown in 1 hour.
Sort out the question
The eagle flies 90 miles in 3 hours. Proportional means the distance is always the same number times the time. That number is the constant of proportionality. You need to find it.
Divide the distance by the time
Use the formula. The distance is y and the time is x:
The constant is 30. It means the eagle flies 30 miles in each hour.
Avoid the numbers in the question
Watch out: 3 is the number of hours, choice A. And 90 is the distance for all 3 hours, choice D. Neither is the distance for 1 hour.
So the answer is B, 30.
Check your answer
Multiply back. At 30 miles each hour, the eagle flies miles in 3 hours. That matches the question. Hour by hour, it goes 30, 60, then 90 miles.
More questions like this
The original DOE question
Question 10 of 23
2024 Test A Math, question 14Question
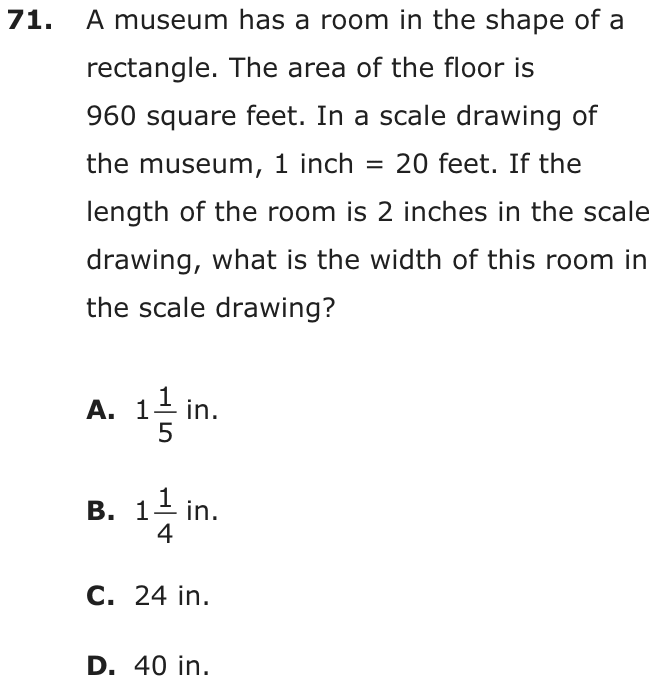
A museum has a room in the shape of a rectangle. The area of the floor is 960 square feet. In a scale drawing of the museum, 1 inch = 20 feet. If the length of the room is 2 inches in the scale drawing, what is the width of this room in the scale drawing?
- A in.
- B in.
- C24 in.
- D40 in.
Show the answer
Correct answer: A
The scale is 1 inch = 20 feet, and the length in the scale drawing is 2 inches, so the actual length is 40 feet.
The actual width is 24 feet.
Let x equal the width of the scale drawing, in inches.
Question analysis
A scale drawing problem: a museum room has a floor area of 960 square feet, the drawing's scale is 1 inch to 20 feet, and the room is 2 inches long in the drawing. Students find the room's width in the drawing. They must move between drawing inches and real feet, and back again, without mixing them.
- Grade level
- Grade 7 content, by NYS standard
- Compared with grade 7
- At grade 7 Scale drawings are grade 7 content, and grade 7 tasks usually convert one length. This one converts to real size, uses the area to find a second side, and converts back: three steps with a units trap.
- Estimated difficulty
- Moderate: several steps, or a close reading with one strong distractor.
- Thinking it demands
- Depth of knowledge 2, skills and concepts · mainly apply
- What makes it hard
- Combines ideas moderate
- Much to keep track of minor
- Solution
- 3 steps
- Reading level
- Question and choices: about grade 2, 57 words.
- Students, last 30 days
- Not enough answers yet to show (it takes 10).
Why it is hard, traps and wrong answers (shows the answer)
Why it is hard
Scale questions usually convert one length; this one needs a round trip, from the drawing to the real room and back. The real width of 24 feet appears partway through and is a choice, so students who lose track of units stop there. The last conversion, 24/20, then has to be written as a mixed number, and its fraction part is where a hurried student slips.
Combines ideas moderate Working it out
The 960 square feet is a real-world area, so the scale cannot be applied to it directly; the length must go to feet, the width come from the area, and then return to inches. (Embretson, 1998; Daniel & Embretson, 2010)
Much to keep track of minor Working it out
Four lengths in two units are in play, 2 inches, 40 feet, 24 feet and the width on the drawing, and each must stay labeled with its unit. (Sweller, 1988; Carpenter, Just & Shell, 1990)
Strategy: Convert the 2-inch length to real feet, divide the area by it to get the real width, then use the scale to change that width back to inches.
Traps
- Units or scale: The answer is wanted in other units, or a rate or scale must be converted first.
- Answers a different question: A choice is right for another quantity: the other unknown, the rest instead of the part, the part instead of the whole.
The wrong answers, classified
B An arithmetic slip (Junker & Sijtsma, 2001)
Gets the real width of 24 feet and divides by 20 correctly, but writes the remainder 4/20 as 1/4 instead of 1/5.
C Units or scale (King et al., 2004)
Finds the room's real width, 960 ÷ 40 = 24 feet, and gives it as the drawing's width without converting back at 1 inch per 20 feet.
D Answers a different question (King et al., 2004; Hegarty, Mayer & Monk, 1995)
Converts the 2-inch length to the real 40 feet and gives that number, answering for the length instead of the width and in the wrong units.
Worked solution, step by step
Formulas used
- Area of a rectangle
- A is the area, the space the floor covers. l is the length and w is the width. The floor is like rows of 1-foot squares, with w rows and l squares in each row. So you multiply.
- Using the scale
- The scale says 1 inch on the drawing stands for 20 feet in the real room. The drawing length is in inches, and the real length is in feet. To go back from feet to inches, divide by 20.
Sort out the question
The real room is a rectangle with a floor area of 960 square feet. On the drawing, 1 inch stands for 20 feet. The room is 2 inches long on the drawing. You need its width on the drawing, in inches. The area is in real feet, so you must switch between the drawing and the room.
Find the real length
The real room is 40 feet long. Watch out: 40 is the real length, not the width on the drawing. Choosing 40 in., choice D, is wrong.
Find the real width
Use the area of the rectangle. You know the area and the length.
The real room is 24 feet wide. Watch out: this width is in real feet. Choosing 24 in., choice C, skips changing it back to the drawing.
Change the width to the drawing
Every 20 feet is 1 inch on the drawing. So undo the scale: divide the real width by 20.
To simplify , divide the top and bottom by 4. Watch out: it is , not , so choice B is wrong. So the answer is A, in.
Check your answer
Go the other way. On the drawing, the room is 2 inches by inches. In real feet that is 40 by 24, since . And square feet, the real area.
More questions like this
The original DOE question
Question 11 of 23
2024 Test A Math, question 46Question
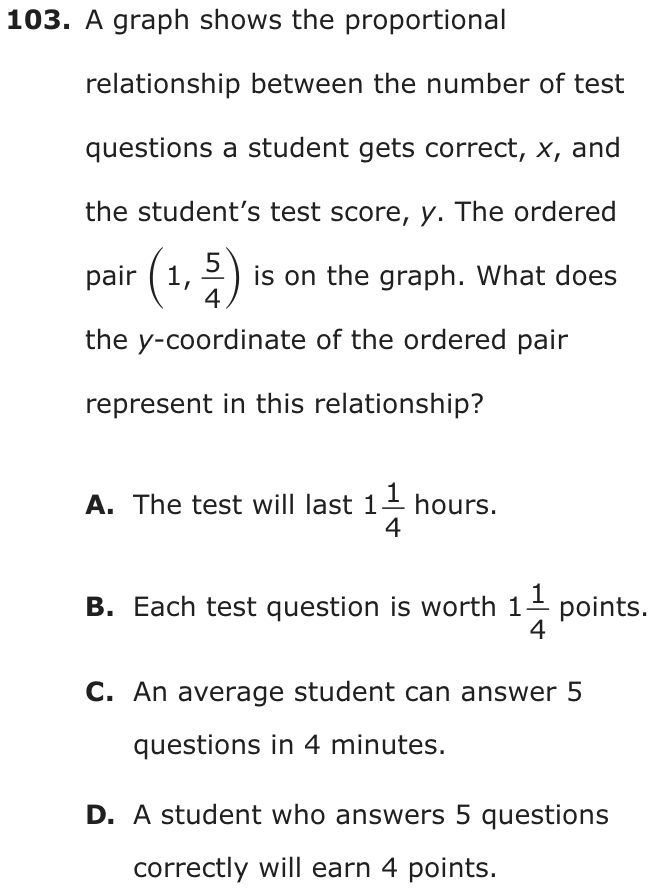
A graph shows the proportional relationship between the number of test questions a student gets correct, x, and the student’s test score, y. The ordered pair is on the graph. What does the y-coordinate of the ordered pair represent in this relationship?
- AThe test will last hours.
- BEach test question is worth points.
- CAn average student can answer 5 questions in 4 minutes.
- DA student who answers 5 questions correctly will earn 4 points.
Show the answer
Correct answer: B
The graph represents a proportional relationship, which means the y-intercept of the graph is (0, 0).
This means that the point represents the unit rate for this situation.
In this situation, x represents the number of questions answered correctly, and y represents the number of points received.
Therefore, for each question answered correctly, the student receives , or , points.
Question analysis
A proportional relationship links the number of test questions a student gets right, x, to the test score, y, and the point (1, 5/4) lies on its graph. Students decide what the y-coordinate of that point means in the situation. The choices reuse the numbers 5, 4 and 1 1/4 in different ways, so the meaning of each coordinate must be kept straight.
- Grade level
- Grade 7 content, by NYS standard
- Compared with grade 7
- At grade 7 Explaining what a point on the graph of a proportional relationship means is named in the grade 7 standards. This item is a direct case, with the graph described in words rather than drawn and only one point to interpret.
- Estimated difficulty
- Straightforward: two steps or one careful reading.
- Thinking it demands
- Depth of knowledge 2, skills and concepts · mainly understand
- What makes it hard
- Solution
- 2 steps
- Reading level
- Question and choices: about grade 7, 73 words.
- Students, last 30 days
- Not enough answers yet to show (it takes 10).
Why it is hard, traps and wrong answers (shows the answer)
Why it is hard
The question checks one idea: when x is 1, the y-coordinate is the score for one correct answer, the unit rate. The pitfall is reading 5/4 as two separate numbers, 5 and 4, and attaching them to questions and points the wrong way round. Ruling out the choices about hours and minutes is quick, since the relationship never mentions time.
Variables instead of numbers minor Understanding the question
No graph is drawn: the relationship and the point (1, 5/4) exist only in words, so students must say for themselves that x counts correct answers and y counts points. (Koedinger & Nathan, 2004; Enright, Morley & Sheehan, 2002)
An answer in an unexpected form minor Choosing the answer
The point gives 5/4, but two choices write it as 1 1/4 and two split it into 5 and 4, so the right reading must be recognized in another form. (Enright, Morley & Sheehan, 2002)
Strategy: Say in words what x and y stand for, then read the ordered pair as a sentence: when x has the first value, y has the second.
Traps
- Wrong operation: Adds instead of multiplying, divides the wrong way round, turns a ratio or rate upside down, or undoes a step in the wrong direction (subtracts what should be added back).
- Numbers taken from the question: Combines the numbers in the question without a model of the situation, or is simply a number that appears in the question.
The wrong answers, classified
A Numbers taken from the question (Hegarty, Mayer & Monk, 1995)
Attaches 1 1/4 to hours of testing, matching the number while ignoring that y measures the test score, not time.
C Numbers taken from the question (Hegarty, Mayer & Monk, 1995)
Reads 5/4 as 5 questions in 4 minutes, using the numbers 5 and 4 with units that the relationship never measures.
D Wrong operation (Hegarty, Mayer & Monk, 1995; King et al., 2004)
Reads 5/4 as 5 correct answers for 4 points, turning the rate upside down; the point means 1 correct answer earns 5/4 points.
Worked solution, step by step
Formulas used
- Proportional relationship
- x and y are two amounts that change together, here right answers and the test score. k is the constant of proportionality: how much y goes with 1 of x. In a proportional relationship, y is always the same number times x. So when x is 1, y equals k.
Sort out the question
x is the number of questions a student gets right. y is the student’s test score, in points. An ordered pair such as lists x first and y second. The y-coordinate is the second number, . You need what that number means.
Read the point as a sentence
In the point, x is 1 and y is . Put those into words: a student who gets 1 question right scores points.
Use the proportional rule
The relationship is proportional. So the score is always the same number times the questions right.
So k is . Every right answer adds the same points. That makes the points for each question.
Write it as a mixed number
A mixed number is a whole number plus a fraction. Four quarters make 1 whole, so five quarters are 1 whole and 1 quarter.
Each question right is worth points.
Match the choices
Choice B says each question is worth points. That matches. Watch out: choice D splits into 5 and 4. But 5 right answers earn points, not 4. Choices A and C talk about time, which this relationship does not measure.
So the answer is B, each test question is worth points.
Check your answer
Try another point. A student with 4 right answers scores points. That fits B, since four questions at points each make 5 points. It does not fit D, which says 5 questions earn 4 points.
More questions like this
The original DOE question
Question 12 of 23
2024 Test A Math, question 48Question
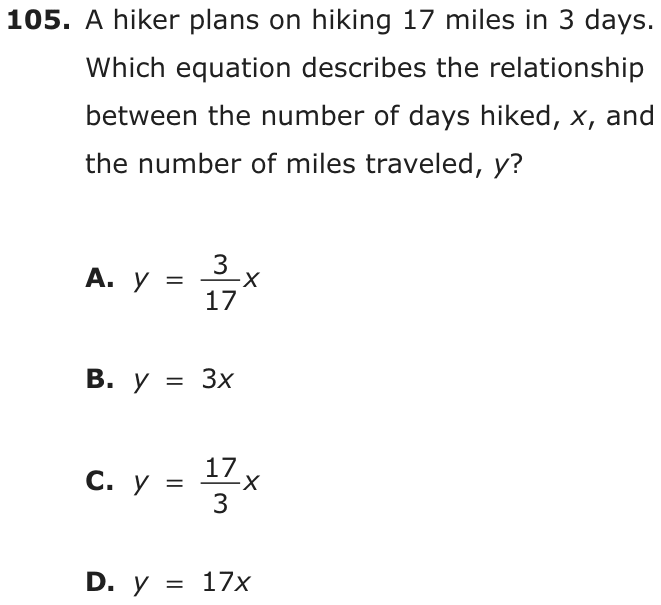
A hiker plans on hiking 17 miles in 3 days. Which equation describes the relationship between the number of days hiked, x, and the number of miles traveled, y?
- A
- B
- C
- D
Show the answer
Correct answer: C
There is a proportional relationship between the number of miles traveled, y, and the number of days hiked, x.
So the equation describes the relationship.
Question analysis
A hiker plans to cover 17 miles in 3 days, and this proportional relationship question asks for the equation linking days hiked, x, to miles traveled, y. Students find the constant rate and write it as an equation of the form y = kx. Putting the right quantity on top of the rate is the main decision.
- Grade level
- Grade 7 content, by NYS standard
- Compared with grade 7
- At grade 7 Writing an equation y = kx for a proportional relationship is a core grade 7 skill, and this is the textbook form. The only extra demand is keeping the rate's direction straight: miles per day or days per mile.
- Estimated difficulty
- Straightforward: two steps or one careful reading.
- Thinking it demands
- Depth of knowledge 2, skills and concepts · mainly apply
- What makes it hard
- A very close wrong answer moderate
- Turning words into math minor
- Solution
- 2 steps
- Reading level
- Question and choices: about grade 7, 31 words.
- Students, last 30 days
- Not enough answers yet to show (it takes 10).
Why it is hard, traps and wrong answers (shows the answer)
Why it is hard
Writing y = kx is routine, so the question rests on putting the right number on top of the rate. Two choices use one number from the stem with no division at all, and one inverts the rate. Substituting x = 3 into each equation is the fastest check, since only one of them gives y = 17.
A very close wrong answer moderate Choosing the answer
The coefficients 17/3 and 3/17 use the same two numbers, one the other inverted, so only checking that 3 days gives 17 miles separates the two equations. (Embretson & Wetzel, 1987; Gorin & Embretson, 2006; Ascalon et al., 2007)
Turning words into math minor Understanding the question
With x as days and y as miles, "17 miles in 3 days" becomes miles per day, 17 ÷ 3, the number that multiplies x. (Hegarty, Mayer & Monk, 1995; Koedinger & Nathan, 2004)
Strategy: Find the constant of proportionality as miles per day, since y is miles and x is days, then write y equals that constant times x; check with x = 3.
Traps
- Wrong operation: Adds instead of multiplying, divides the wrong way round, turns a ratio or rate upside down, or undoes a step in the wrong direction (subtracts what should be added back).
- Numbers taken from the question: Combines the numbers in the question without a model of the situation, or is simply a number that appears in the question.
The wrong answers, classified
A Wrong operation (Hegarty, Mayer & Monk, 1995; King et al., 2004)
Divides days by miles, 3/17, the number of days per mile, turning the rate upside down.
B Numbers taken from the question (Hegarty, Mayer & Monk, 1995)
Uses the 3 days as the rate, writing y = 3x, a number from the question with no division.
D Numbers taken from the question (Hegarty, Mayer & Monk, 1995)
Uses the 17 total miles as if they were covered in one day, writing y = 17x without dividing by the 3 days.
Worked solution, step by step
Formulas used
- Constant of proportionality
- x and y are two amounts that change together. k is the constant of proportionality: how much y goes with 1 of x. In a proportional relationship, y divided by x gives the same k every time.
- Proportional relationship
- kx means k times x. In a proportional relationship, y is always k times x. Here x is the number of days and y is the miles. k is the miles for each day. Use it to write the equation once you know k.
Sort out the question
The hiker plans 17 miles in 3 days. x is the number of days, and y is the number of miles. You need an equation that links them. Assume the hiker goes the same distance each day. Then y is always the same number times x.
Find the miles for each day
That number is the constant of proportionality, k. It is miles divided by days.
That is miles each day. Watch out: miles go on top, because y is miles. is days per mile, upside down. That is choice A.
Write the equation
Watch out: 17 is the miles for all 3 days, not for 1 day. So , choice D, is too fast. And , choice B, uses the days as the rate.So the answer is C, .
Check your answer
Put in x = 3, for 3 days: . That is 17 miles, which matches the plan. Try choice A the same way: . That is less than 1 mile, far too short.
More questions like this
The original DOE question
Question 13 of 23
2024 Test A Math, question 55Question
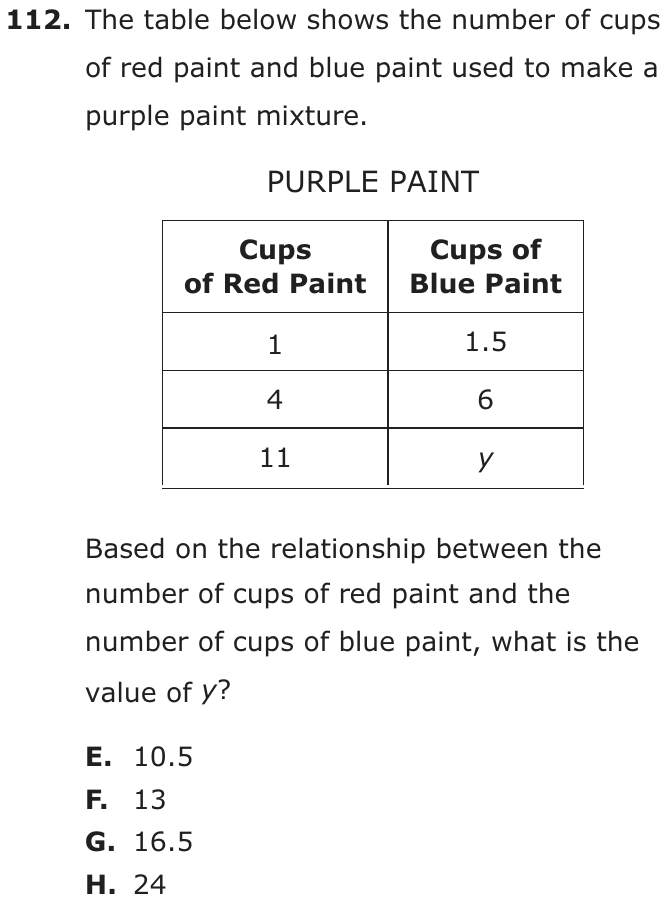
The table below shows the number of cups of red paint and blue paint used to make a purple paint mixture.
PURPLE PAINT
| Cups of Red Paint | Cups of Blue Paint |
|---|---|
| 1 | 1.5 |
| 4 | 6 |
| 11 | y |
Based on the relationship between the number of cups of red paint and the number of cups of blue paint, what is the value of y?
- A10.5
- B13
- C16.5
- D24
Show the answer
Correct answer: C
Divide the number of cups of blue paint by the number of cups of red paint to find the constant of proportionality.
Multiply to find the value of y.
Question analysis
A table gives cups of red and blue paint for a purple mixture: 1 and 1.5, 4 and 6, and 11 and an unknown y. This ratio table question asks for y based on the relationship between the two colors. The tricky part is noticing whether the relationship works by multiplying or by adding.
- Grade level
- Grade 7 content, by NYS standard
- Compared with grade 7
- Below grade 7 Finding a constant of proportionality from a table is grade 7 work, but here one row already pairs 1 cup of red with its cups of blue, so a single multiplication finishes it, lighter than typical grade 7 tasks.
- Estimated difficulty
- Routine: one familiar step, little to misread.
- Thinking it demands
- Depth of knowledge 2, skills and concepts · mainly apply
- What makes it hard
- Solution
- 2 steps
- Reading level
- Question and choices: about grade 4, 57 words.
- Students, last 30 days
- Not enough answers yet to show (it takes 10).
Why it is hard, traps and wrong answers (shows the answer)
Why it is hard
The relationship is multiplicative, 1.5 cups of blue for every cup of red, and one multiplication finishes the question. The trap is additive thinking: red grows by 7 cups from the second row to the third, and adding the same 7 to the blue column gives a listed answer. Testing a rule on every row exposes the additive one, since blue is 0.5 more than red in the first row but 2 more in the second.
Reading a figure, table or graph minor Understanding the question
The table's first row, 1 cup of red to 1.5 cups of blue, hands over the constant of proportionality; the other two rows only confirm it. (Lesh, Post & Behr, 1987; Kirsch & Mosenthal, 1990)
Strategy: Use the row with 1 cup of red paint to read the cups of blue per cup of red, multiply that rate by 11, and check the rate against the row with 4 cups.
Traps
- Misunderstands the concept: A wrong belief about a concept: that percents can be added, that area grows like length, that averages can be averaged, that a bigger denominator means a bigger fraction.
- Stops one step early: A choice is a number from partway through the solution.
The wrong answers, classified
A Stops one step early (King et al., 2004; Gierl et al., 2017)
Scales only the jump from 4 to 11 cups of red, 7 × 1.5 = 10.5, and forgets to add the 6 cups of blue already there.
B Misunderstands the concept (Smith, diSessa & Roschelle, 1993; De Bock et al., 1998; Ni & Zhou, 2005)
Thinks additively: red goes up 7 cups from 4 to 11, so adds the same 7 to the 6 cups of blue, getting 13.
D Numbers taken from the question (Hegarty, Mayer & Monk, 1995)
Multiplies the two numbers in the second row, 4 × 6 = 24, without finding how the two columns are related.
Worked solution, step by step
Formulas used
- Constant of proportionality
- x and y are two amounts that change together. k is the constant of proportionality: how much y goes with 1 of x. In a proportional relationship, y divided by x gives the same k every time.
- Proportional relationship
- x is the cups of red paint, and y is the cups of blue paint. k is the cups of blue for each cup of red. In a proportional relationship, y is always k times x. Use it to find y for any amount of red.
Sort out the table
The table shows cups of red and blue paint for the same purple. 1 cup of red goes with 1.5 cups of blue. 4 cups of red go with 6 cups of blue. You need y, the cups of blue for 11 cups of red. The same color means the paints mix at the same rate in every row.
Find the blue for each cup of red
Both rows give 1.5. So there are always 1.5 cups of blue for each cup of red. This number is the constant of proportionality.
Use the rate for 11 cups
Think of it as 11 cups plus half of 11 cups: . So y is 16.5 cups of blue.
Avoid the traps and answer
Watch out: red goes up 7 cups from 4 to 11. Adding the same 7 cups to the 6 cups of blue gives 13, choice B. Paint mixes by multiplying, not by adding. Watch out: , choice A, is only the extra blue for the 7 extra cups of red.So the answer is C, 16.5.
Check your answer
Divide to check: . That matches the other rows. Also, every row has more blue than red, so y must be more than 11. That rules out 10.5.
More questions like this
The original DOE question
Question 14 of 23
2024 Test A Math, question 57Question
An ice cream shop sells 16 cups of ice cream for $48 and 4 cups for $12. There is a proportional relationship between the number of cups of ice cream and the cost. What is the constant of proportionality for this relationship?
- A3 cups per dollar
- B3 dollars per cup
- C4 cups per dollar
- D4 dollars per cup
Show the answer
Correct answer: B
There is a proportional relationship between the cost and the number of cups of ice cream.
Divide the cost by the number of cups of ice cream to find the constant of proportionality.
The constant is the cost per cup, 3 dollars.
Question analysis
An ice cream shop sells 16 cups for $48 and 4 cups for $12, and the cost is proportional to the number of cups. This proportional relationship question asks for the constant of proportionality, with its units. The choices pair two numbers with two kinds of units, so the units of the rate matter as much as the number.
- Grade level
- Grade 7 content, by NYS standard
- Compared with grade 7
- Below grade 7 Grade 7 students find constants of proportionality in tables, graphs and equations. Here one division gives the number, as in grade 6 unit pricing, and the real demand is attaching the right units to it.
- Estimated difficulty
- Straightforward: two steps or one careful reading.
- Thinking it demands
- Depth of knowledge 2, skills and concepts · mainly apply
- What makes it hard
- A very close wrong answer moderate
- Something you must already know minor
- Solution
- 2 steps
- Reading level
- Question and choices: about grade 4, 50 words.
- Students, last 30 days
- Not enough answers yet to show (it takes 10).
Why it is hard, traps and wrong answers (shows the answer)
Why it is hard
One division gives the number, so the question is really about units. The cost depends on the number of cups, and dividing $48 by 16 cups gives the dollars for each cup; reversing the label describes a shop where one dollar buys three cups. The second offer, 4 cups for $12, is a built-in check that the rate stays the same.
A very close wrong answer moderate Choosing the answer
Two choices carry the number 3, "3 cups per dollar" and "3 dollars per cup", so finding 48 ÷ 16 is not enough; the units decide. (Embretson & Wetzel, 1987; Gorin & Embretson, 2006; Ascalon et al., 2007)
Something you must already know minor Working it out
Students must know that dividing dollars by cups gives dollars per cup: a quotient's units read as the top quantity per the bottom one. (Anderson & Krathwohl, 2001)
Strategy: Divide one quantity by the other for one offer, check that the other offer gives the same quotient, and label it with the numerator's units per the denominator's units.
Traps
- Wrong operation: Adds instead of multiplying, divides the wrong way round, turns a ratio or rate upside down, or undoes a step in the wrong direction (subtracts what should be added back).
- Numbers taken from the question: Combines the numbers in the question without a model of the situation, or is simply a number that appears in the question.
The wrong answers, classified
A Wrong operation (Hegarty, Mayer & Monk, 1995; King et al., 2004)
Gets 3 from 48 ÷ 16 but labels it cups per dollar, turning the rate upside down; at these prices a dollar buys only 1/3 of a cup.
C Numbers taken from the question (Hegarty, Mayer & Monk, 1995)
Divides the two cup amounts, 16 ÷ 4 = 4, and attaches cups per dollar, a ratio of like quantities given made-up units.
D Numbers taken from the question (Hegarty, Mayer & Monk, 1995)
Divides the two costs, $48 ÷ $12 = 4, or the two cup counts, and calls the result dollars per cup.
Worked solution, step by step
Formulas used
- Constant of proportionality
- In a proportional relationship, y is always the same number, k, times x. Here x is the number of cups and y is the cost in dollars. So k is y divided by x. Its units are the top’s units per the bottom’s units: dollars per cup.
Sort out the question
16 cups cost $48, and 4 cups cost $12. The cost is proportional to the cups. That means the cost is always the same number times the number of cups. That number is the constant of proportionality. You need it with the right units.
Divide cost by cups
For each offer, divide the cost in dollars by the number of cups.
Both offers give 3. So the constant is 3.
Name the units
Dollars are on top and cups are on the bottom. So the units are dollars per cup. 3 dollars per cup means each cup costs $3. Watch out: two choices use 3. Choice A, 3 cups per dollar, flips the rate. Then 16 cups would cost only about $5, not $48.
Avoid the traps and answer
Watch out: dividing two costs, , or two cup counts, , gives 4. That compares like amounts, so it is not a cost for each cup. It leads to choice C or D.So the answer is B, 3 dollars per cup.
Check your answer
Multiply back. At 3 dollars per cup, 16 cups cost , which is $48. And 4 cups cost , which is $12. Both match the shop’s prices.
More questions like this
The original DOE question
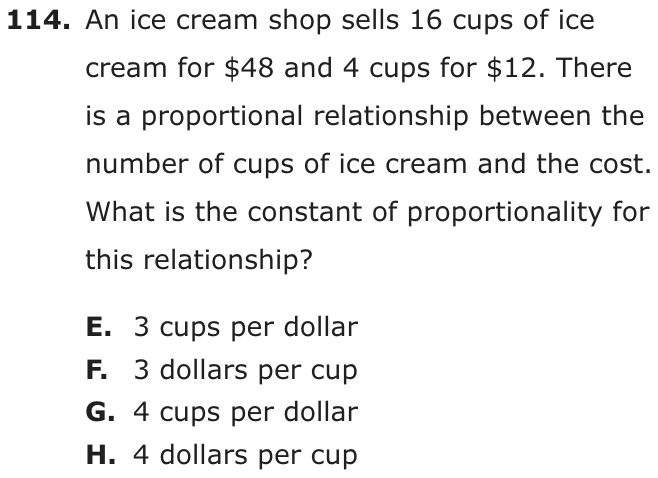
Question 15 of 23
2024 Test B Math, question 6Question
This graph shows y, the weight of a pole of length x.
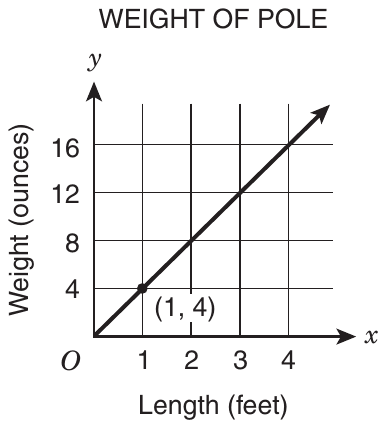
What is represented by the point with coordinates (1, 4)?
- AThe unit rate is 4 ounces per foot.
- BThe y-intercept is 4.
- CA pole 4 feet long weighs 1 ounce.
- DThe length increases 4 feet for each 1 ounce of weight.
Show the answer
Correct answer: A
The x-axis represents the length of the pole, in feet, and the y-axis represents the weight of the pole, in ounces.
The point (1, 4) means that a 1-foot pole would weigh 4 ounces.
Since the graph is linear, the pole weighs 4 ounces for every additional 1 foot of length.
So the unit rate is 4 ounces per foot.
Question analysis
A graph of a pole's weight in ounces against its length in feet is a straight line through the origin, with the point (1, 4) marked. Students decide what that point says about poles, choosing among statements about rates, intercepts and particular poles, so the meaning of each coordinate has to be pinned down.
- Grade level
- Grade 7 content, by NYS standard
- Compared with grade 7
- At grade 7 Explaining what a point on a proportional graph means in the situation is a named grade 7 skill. This is a direct, one-step example with a clear graph, typical of grade 7 classwork.
- Estimated difficulty
- Straightforward: two steps or one careful reading.
- Thinking it demands
- Depth of knowledge 2, skills and concepts · mainly understand
- What makes it hard
- Solution
- 1 step
- Reading level
- Question and choices: about grade 2, 45 words.
- Students, last 30 days
- Not enough answers yet to show (it takes 10).
Why it is hard, traps and wrong answers (shows the answer)
Why it is hard
Nothing needs computing; the question tests whether a point on a graph can be put into words. Each wrong statement misuses the same two numbers, as an intercept, with the coordinates swapped, or as a rate turned upside down. Saying the point aloud with its units, a 1-foot pole weighs 4 ounces, and comparing that sentence with each statement settles it quickly.
Reading a figure, table or graph moderate Understanding the question
The axes carry the meaning: length in feet runs along x and weight in ounces up y, so (1, 4) describes a 1-foot pole, and the line through O makes that a rate. (Lesh, Post & Behr, 1987; Kirsch & Mosenthal, 1990)
A very close wrong answer minor Choosing the answer
Both rate statements pair 4 with 1, one as ounces per foot and the other as feet per ounce; only the axis labels say which way the rate runs. (Embretson & Wetzel, 1987; Gorin & Embretson, 2006; Ascalon et al., 2007)
Something you must already know minor Working it out
The choices use the terms unit rate and y-intercept, which the question does not define, and two statements hang on knowing what each one means. (Anderson & Krathwohl, 2001)
Strategy: Note which quantity each axis measures, say in words what the x-coordinate and the y-coordinate of the marked point stand for, then compare that sentence with each choice.
Traps
- Wrong operation: Adds instead of multiplying, divides the wrong way round, turns a ratio or rate upside down, or undoes a step in the wrong direction (subtracts what should be added back).
- Misreads the figure: Reads a value, label or tick spacing in a figure, table or graph wrongly.
- Misunderstands the concept: A wrong belief about a concept: that percents can be added, that area grows like length, that averages can be averaged, that a bigger denominator means a bigger fraction.
The wrong answers, classified
B Misunderstands the concept (Smith, diSessa & Roschelle, 1993; De Bock et al., 1998; Ni & Zhou, 2005)
Takes the 4 in the point's label for the y-intercept, though the line starts at the origin, where a pole of no length weighs 0 ounces.
C Misreads the figure (Lesh, Post & Behr, 1987; Kirsch & Mosenthal, 1990)
Reads the coordinates the wrong way round, taking 1 as the weight in ounces and 4 as the length in feet.
D Wrong operation (Hegarty, Mayer & Monk, 1995; King et al., 2004)
Turns the rate upside down, describing feet of length per ounce of weight instead of ounces of weight per foot of length.
Worked solution, step by step
Formulas used
- Unit rate
- For a point on the line, y is the weight in ounces and x is the length in feet. The unit rate is the weight of 1 foot of pole. This works for a straight line that starts at the origin, the point (0, 0).
Read the axes
The graph has two axes (number lines). The x-axis, across the bottom, shows length in feet. The y-axis, going up, shows weight in ounces.
A point is written (x, y). The across number comes first, then the up number. So in (1, 4), x is 1 and y is 4.
Say what the point means
x = 1 means a length of 1 foot. y = 4 means a weight of 4 ounces. So a pole 1 foot long weighs 4 ounces.
Watch out: do not swap the numbers. “A pole 4 feet long weighs 1 ounce” reads them the wrong way round. That is choice C.See that this is a unit rate
A unit rate is an amount for 1 unit, here the ounces in 1 foot. The line starts at O, the origin (0, 0), and it is straight. So each extra foot adds the same weight.
The unit rate is 4 ounces per foot. Watch out: choice D turns this upside down. It gives feet for each ounce, not ounces for each foot.
Rule out the y-intercept
The y-intercept is where the line crosses the y-axis. This line crosses it at O, where y is 0. So the y-intercept is 0, not 4, and choice B is wrong.
So the answer is A, the unit rate is 4 ounces per foot.
Check your answer
Try another point on the line, such as (3, 12). A pole 3 feet long weighs 12 ounces. , so it is still 4 ounces per foot. The rate stays the same all along the line.
More questions like this
The original DOE question
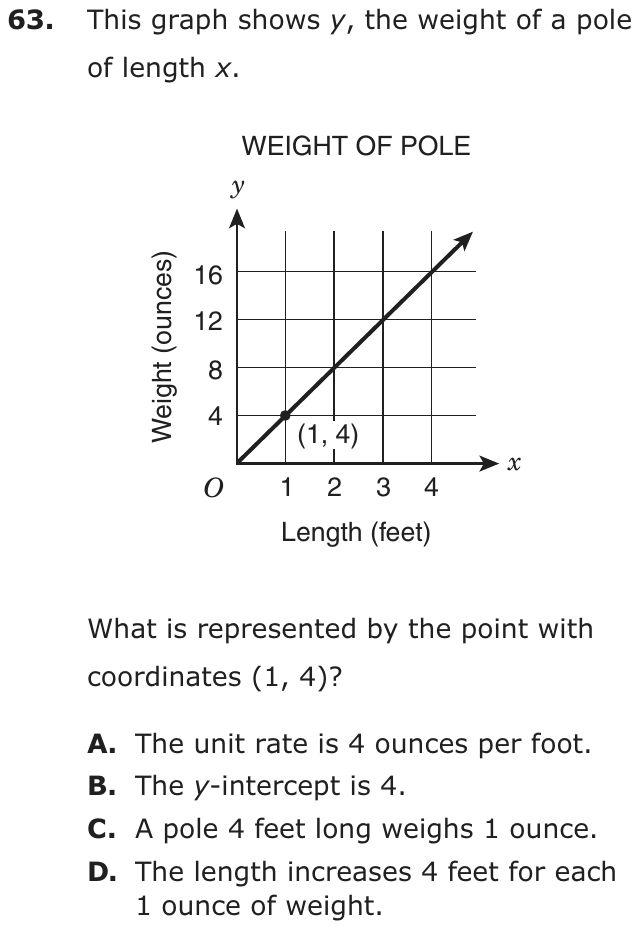
Question 16 of 23
2024 Test B Math, question 19Question
Serena was studying the number of water stations for different lengths of races. The table below shows the data she collected.
WATER STATIONS IN RACES
| Length of Race (mi) | Number of Water Stations |
|---|---|
| 3 | 2 |
| 12 | 8 |
| 18 | 12 |
Which equation represents the relationship between the length of the race, x miles, and the number of water stations, y?
- A
- B
- C
- D
Show the answer
Correct answer: A
There is a proportional relationship between the length of the race, x miles, and the number of water stations, y. The constant of proportionality is
Therefore, the equation represents this relationship.
Question analysis
A table from a study of races shows the number of water stations for races of 3, 12 and 18 miles. Students choose the equation that links the race length x to the number of stations y. It tests reading a relationship from a table and expressing it as an equation in x and y.
- Grade level
- Grade 7 content, by NYS standard
- Compared with grade 7
- At grade 7 Writing an equation for a relationship given in a table is a central grade 7 skill. With three clean rows and whole numbers, this is a typical grade 7 exercise.
- Estimated difficulty
- Straightforward: two steps or one careful reading.
- Thinking it demands
- Depth of knowledge 2, skills and concepts · mainly apply
- What makes it hard
- A very close wrong answer moderate
- Reading a figure, table or graph minor
- Solution
- 2 steps
- Reading level
- Question and choices: about grade 6, 57 words.
- Students, last 30 days
- Not enough answers yet to show (it takes 10).
Why it is hard, traps and wrong answers (shows the answer)
Why it is hard
The table is small and its numbers are friendly, so the question comes down to which way the ratio runs and whether every row is checked. One wrong equation fits only the first row and another fits none, so testing a single row is not enough. Putting the 12-mile race into each equation, which should give 8 stations, leaves only one rule standing.
A very close wrong answer moderate Choosing the answer
The coefficients 2/3 and 3/2 use the same two digits, and only dividing stations by miles, 2 ÷ 3, rather than miles by stations, separates them. (Embretson & Wetzel, 1987; Gorin & Embretson, 2006; Ascalon et al., 2007)
Reading a figure, table or graph minor Understanding the question
The table lists miles first and stations second, while each equation puts stations, y, alone on the left, so every row must be read as an (x, y) pair. (Lesh, Post & Behr, 1987; Kirsch & Mosenthal, 1990)
Strategy: Test each equation on all three rows of the table, not just the first; only a rule that fits every row represents the relationship.
Traps
- Wrong operation: Adds instead of multiplying, divides the wrong way round, turns a ratio or rate upside down, or undoes a step in the wrong direction (subtracts what should be added back).
- Checks only one number: Tries one value in each choice and takes the first that works, when that value happens to work for a wrong choice too; a second value would rule it out.
- Numbers taken from the question: Combines the numbers in the question without a model of the situation, or is simply a number that appears in the question.
The wrong answers, classified
B Wrong operation (Hegarty, Mayer & Monk, 1995; King et al., 2004)
Divides race length by water stations, 3 ÷ 2, turning the ratio upside down, so the rule gives more stations than miles.
C Numbers taken from the question (Hegarty, Mayer & Monk, 1995)
Builds an addition rule from the gap of 6 between 18 and 12 in the last row, with the sign reversed, and it fits no row of the table.
D Checks only one number (Schoenfeld, 1985)
Checks only the first row, where 3 − 1 = 2 works, without testing the 12- and 18-mile races, where it gives 11 and 17.
Worked solution, step by step
Formulas used
- Proportional relationship
- x is the race length in miles, and y is the number of water stations. k is the constant of proportionality, the number of stations for each mile. Find it with y ÷ x. If every row gives the same k, the table is proportional.
Sort out the table
Each row of the table is a pair of numbers. The first is the race length, x, in miles. The second is the number of water stations, y. You need the equation that works for every row.
Divide y by x in each row
See if every row has the same ratio of stations to miles. Divide y by x.
Miles (x) Stations (y) y ÷ x 3 2 12 8 18 12 Every row gives 2/3. So the relationship is proportional: y is always the same number times x.
Write the equation
Here k is the ratio you found, .
Watch out: divide stations by miles, not miles by stations. 3 ÷ 2 gives 3/2, choice B. That rule would give more stations than miles.Test the other choices and answer
Watch out: test every row, not just the first one. Choice D, y = x − 1, works for 3 miles. But it gives 11 stations for 12 miles, not 8. Choice C, y = x + 6, gives 9 stations for 3 miles, not 2.So the answer is A, .
Check your answer
Put each race length into . , and . All three match the table.
More questions like this
The original DOE question
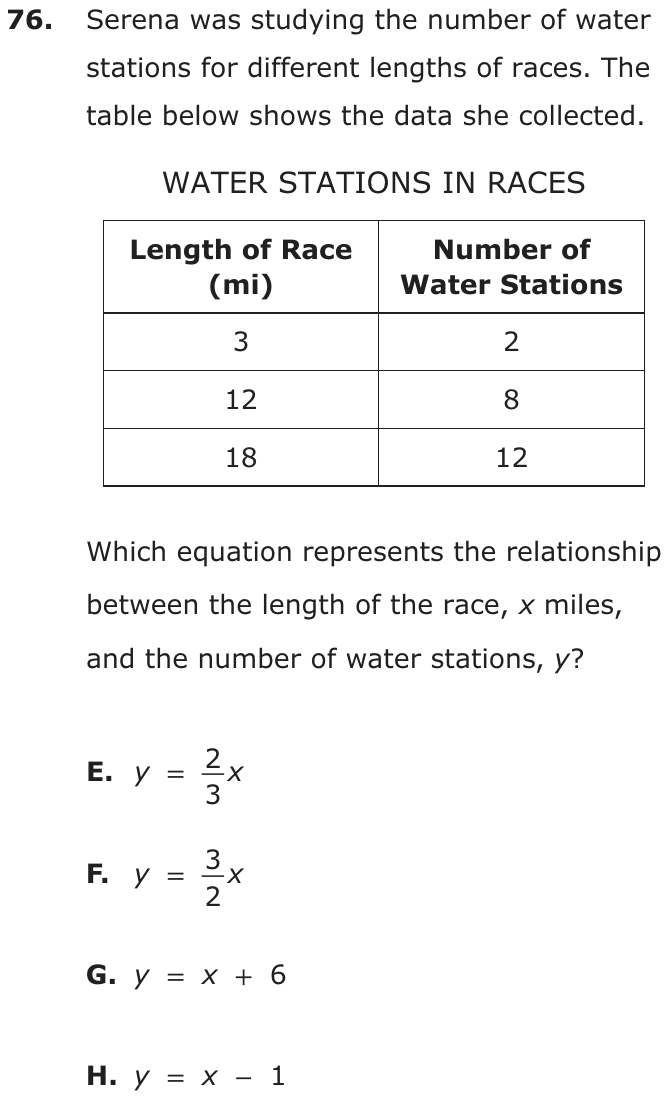
Question 17 of 23
2023 Test B Math, question 2Question
In a scale drawing of a rectangular garden, the length is 15 inches and the width is 9 inches. In the drawing, 2 inches represents 3 yards. What is the width of the actual garden, in yards?
Grid-in question: work out the answer and enter it as a number.
Show the answer
Correct answer: 13.5
Let w represent the width of the actual garden. Set up a proportion based on the information given:
Question analysis
In a scale drawing of a rectangular garden, 2 inches stands for 3 yards, and the drawing measures 15 inches by 9 inches. This grid-in asks for the real width of the garden in yards. Students apply the scale to one side only: the length is given but plays no part, and the scale has to be used the right way round.
- Grade level
- Grade 7 content, by NYS standard
- Compared with grade 7
- At grade 7 Scale drawings are grade 7 content, and this is a typical one: a single length converted with a stated scale. The only extra demand is using the width rather than the length and entering the result with no choices to check.
- Estimated difficulty
- Straightforward: two steps or one careful reading.
- Thinking it demands
- Depth of knowledge 2, skills and concepts · mainly apply
- What makes it hard
- Solution
- 2 steps
- Reading level
- Question and choices: about grade 4, 33 words.
- Students, last 30 days
- Not enough answers yet to show (it takes 10).
Why it is hard, traps and wrong answers (shows the answer)
Why it is hard
The drawing gives two lengths and only the width matters, so the first decision is which number to scale. The second is direction: the real garden must measure more in yards than the drawing’s 9 in inches, which a student can check before entering anything. Errors come from scaling the length, turning the scale over, or treating 2 to 3 as an increase of one.
Turning words into math minor Understanding the question
“2 inches represents 3 yards” must become 1.5 yards for every inch of drawing, so the 9-inch width is multiplied by 3/2, not by 2/3. (Hegarty, Mayer & Monk, 1995; Koedinger & Nathan, 2004)
An answer in an unexpected form minor Choosing the answer
The answer is a decimal entered with no choices to compare, so a result from the 15-inch length or from an upside-down scale looks just as finished. (Enright, Morley & Sheehan, 2002)
Strategy: Find how many yards one inch of the drawing stands for, then multiply the drawing's width, not its length, by that number.
Traps
- Answers a different question: A choice is right for another quantity: the other unknown, the rest instead of the part, the part instead of the whole.
- Wrong operation: Adds instead of multiplying, divides the wrong way round, turns a ratio or rate upside down, or undoes a step in the wrong direction (subtracts what should be added back).
- Information you don't need: The question gives numbers or facts that play no part in the answer.
The wrong answers, classified
22.5 Answers a different question (King et al., 2004; Hegarty, Mayer & Monk, 1995)
Applies the scale to the 15-inch length instead of the 9-inch width: 15 × 3 ÷ 2 = 22.5 yards.
6 Wrong operation (Hegarty, Mayer & Monk, 1995; King et al., 2004)
Turns the scale upside down, multiplying the 9 inches by 2/3 instead of 3/2, so the real garden comes out smaller than the drawing’s number.
10 Misunderstands the concept (Smith, diSessa & Roschelle, 1993; De Bock et al., 1998; Ni & Zhou, 2005)
Reads 2 inches to 3 yards as adding 1, keeping a constant difference instead of a constant ratio, so 9 inches becomes 9 + 1 = 10 yards.
Worked solution, step by step
Formulas used
- Scale proportion
- A scale drawing shrinks everything by the same amount. So real size over drawing size makes the same fraction for every part of the drawing. Keep the real sizes on top on both sides, and the drawing sizes on the bottom.
Sort out the question
The drawing shows a rectangle, a four-sided shape with square corners. On the drawing, the length is 15 inches and the width is 9 inches. The scale says 2 inches on the drawing stand for 3 yards in real life. You need the real width, in yards.
Only the width matters. The 15-inch length is extra.
Find what one inch stands for
If 2 inches stand for 3 yards, then 1 inch stands for half as much.
So each inch on the drawing is 1.5 yards in real life. That means the number of yards will be bigger than the number of inches.
Set up the proportion and solve
Let w be the real width, in yards. Put yards on top and inches on the bottom, on both sides.
To get w alone, multiply both sides by 9.
The real width is 13.5 yards.
Give the answer
Watch out: don’t flip the scale. Using gives 6, which is smaller than the drawing’s number. And don’t use the length: 15 inches would give 22.5 yards. So you would grid 13.5.
Check your answer
Count groups of 2 inches. The 9-inch width holds 4.5 groups of 2 inches. Each group stands for 3 yards, so the real width is yards. That matches.
More questions like this
The original DOE question
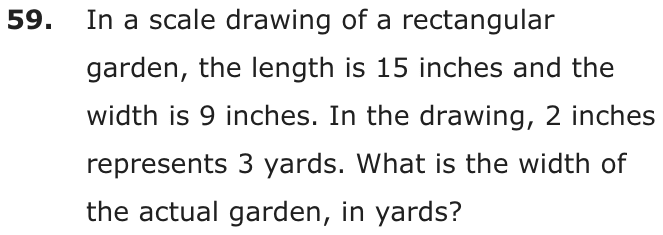
Question 18 of 23
2023 Test B Math, question 7Question
On Fran’s map, 2 centimeters represents 3 kilometers. The points on this map that represent Fran’s home and Bryant State Park are 4.5 centimeters apart. How many kilometers apart are Fran’s home and Bryant State Park, to the nearest kilometer?
- A3
- B5
- C7
- D9
Show the answer
Correct answer: C
Let x represent the distance, in kilometers, between Fran’s house and Bryant State Park. Set up a proportion to solve for x:
| Cross multiply. | |
| Apply the multiplicative inverse property; divide both sides of the equation by 2. | |
Question analysis
On Fran's map, 2 centimeters represent 3 kilometers, and her home and Bryant State Park are 4.5 centimeters apart on the map. Students find the real distance to the nearest kilometer. It is a map-scale proportion problem: the scale must be applied in the right direction, and the result rounded.
- Grade level
- Grade 7 content, by NYS standard
- Compared with grade 7
- At grade 7 Map scales are standard grade 7 proportional reasoning, and this problem is typical: one distance, one scale, then rounding. Nothing beyond a single proportion is needed.
- Estimated difficulty
- Straightforward: two steps or one careful reading.
- Thinking it demands
- Depth of knowledge 2, skills and concepts · mainly apply
- What makes it hard
- Turning words into math minor
- Error-prone arithmetic minor
- Solution
- 3 steps
- Reading level
- Question and choices: about grade 8, 37 words.
- Students, last 30 days
- Not enough answers yet to show (it takes 10).
Why it is hard, traps and wrong answers (shows the answer)
Why it is hard
This is a one-proportion map question, and the only judgments are the direction of the scale and when to round. The phrase to the nearest kilometer tempts some students to round the scale itself before multiplying, which lands on a listed answer two kilometers too far. Rounding only the final 6.75 keeps the result right.
Turning words into math minor Understanding the question
“2 centimeters represents 3 kilometers” gives 1.5 kilometers per centimeter; set up the other way round, the scale shrinks the 4.5 centimeters instead of enlarging them. (Hegarty, Mayer & Monk, 1995; Koedinger & Nathan, 2004)
Error-prone arithmetic minor Working it out
The map distance is a decimal, 4.5 × 3 ÷ 2 = 6.75, and the result must then be rounded to the nearest kilometer, two places where a quick estimate drifts. (Brown & Burton, 1978; Junker & Sijtsma, 2001)
Strategy: Work out how many kilometers 1 centimeter on the map stands for, multiply by 4.5, and round only at the very end.
Traps
- Wrong operation: Adds instead of multiplying, divides the wrong way round, turns a ratio or rate upside down, or undoes a step in the wrong direction (subtracts what should be added back).
- Rounds too early: Rounds a value partway through, or rounds the wrong way, so the final answer drifts from the exact one.
- Units or scale: The answer is wanted in other units, or a rate or scale must be converted first.
The wrong answers, classified
A Wrong operation (Hegarty, Mayer & Monk, 1995; King et al., 2004)
Turns the scale upside down, multiplying 4.5 by 2/3 instead of 3/2, so the real distance comes out smaller than the map distance.
B Units or scale (King et al., 2004)
Takes the 4.5 centimeters on the map as kilometers and rounds to 5, never applying the scale that turns each centimeter into 1.5 kilometers.
D Rounds too early (King et al., 2004)
Rounds the scale of 1.5 kilometers per centimeter up to 2 before multiplying, so 4.5 × 2 = 9 instead of 6.75.
Worked solution, step by step
Formulas used
- Scale proportion
- A map shrinks every distance by the same amount. So real distance over map distance makes the same fraction everywhere on the map. Put kilometers on top on both sides and centimeters on the bottom. Then solve for the missing number.
Sort out the question
On Fran’s map, 2 centimeters stand for 3 kilometers in real life. Her home and the park are 4.5 centimeters apart on the map. You need the real distance in kilometers, rounded to the nearest whole kilometer.
Set up the proportion
Let x be the real distance, in kilometers. Put kilometers on top and centimeters on the bottom, on both sides.
Solve for x
To get x alone, multiply both sides by 4.5.
So the real distance is 6.75 kilometers. Watch out: keep the scale exact until the end. Rounding 1.5 kilometers per centimeter up to 2 gives , choice D.
Round to the nearest kilometer
6.75 is between 6 and 7. Its decimal part, 0.75, is more than 0.5, so round up to 7.
Watch out: don’t flip the scale. Multiplying 4.5 by gives 3, choice A. So the answer is C, 7.
Check your answer
Each centimeter stands for kilometers. So 4 centimeters is 6 kilometers, and half a centimeter is 0.75 kilometer. That adds to 6.75, which rounds to 7. The real number should be bigger than 4.5, and it is.
More questions like this
The original DOE question
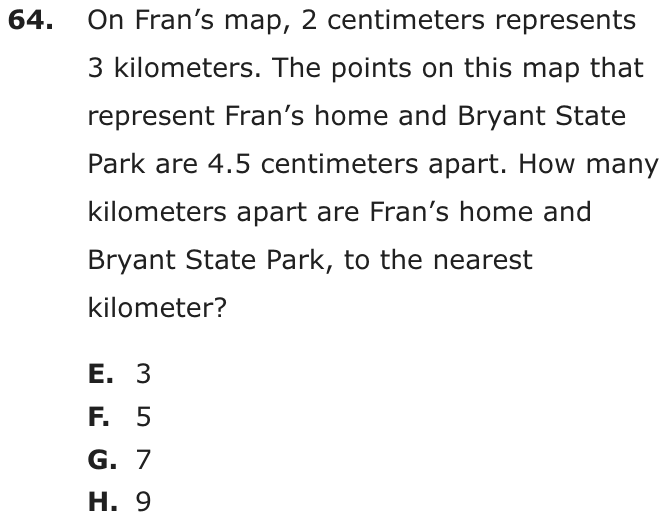
Question 19 of 23
2023 Test B Math, question 15Question
On a map, the distance between Deshawn’s house and Xin’s house is 5.4 inches. If 2 inches on the map represents 3 miles, what is the distance between these two houses, in miles?
- A2.6
- B3.6
- C7.5
- D8.1
Show the answer
Correct answer: D
Let d represent the distance between the two houses, in miles. Write a proportion to solve for d:
Question analysis
A map shows Deshawn's and Xin's houses 5.4 inches apart, with 2 inches on the map standing for 3 miles. Students find the actual distance between the houses in miles. This scale question uses a decimal map length, so the multiplication must be exact and the inches-to-miles ratio kept the right way up.
- Grade level
- Grade 7 content, by NYS standard
- Compared with grade 7
- At grade 7 Converting a map distance with a given scale is routine grade 7 work. This one needs a single proportion and a decimal multiplication, with no rounding or second step, so it matches a typical classroom exercise.
- Estimated difficulty
- Straightforward: two steps or one careful reading.
- Thinking it demands
- Depth of knowledge 2, skills and concepts · mainly apply
- What makes it hard
- Error-prone arithmetic minor
- A very close wrong answer minor
- Solution
- 2 steps
- Reading level
- Question and choices: about grade 6, 30 words.
- Students, last 30 days
- Not enough answers yet to show (it takes 10).
Why it is hard, traps and wrong answers (shows the answer)
Why it is hard
Unlike most map questions, this one asks for an exact distance, so the decimal 5.4 has to be carried all the way through. The two tempting wrong answers come from opposite places: an upside-down scale shrinks the distance, and a rounded map length gives a result close to the true one. Checking that the answer is one and a half times 5.4 catches both.
Error-prone arithmetic minor Working it out
The map distance is the decimal 5.4, and 5.4 × 3 = 16.2 then halved is a decimal multiplication where rounding 5.4 to make it easier changes the answer. (Brown & Burton, 1978; Junker & Sijtsma, 2001)
A very close wrong answer minor Choosing the answer
7.5 and 8.1 miles are close enough that a rough estimate, 5 × 1.5, lands on the wrong one; only the exact product separates them. (Embretson & Wetzel, 1987; Gorin & Embretson, 2006; Ascalon et al., 2007)
Strategy: Set up miles over inches equal to 3 over 2, then multiply 5.4 by 3 and divide by 2, keeping the decimal exact throughout.
Traps
- Wrong operation: Adds instead of multiplying, divides the wrong way round, turns a ratio or rate upside down, or undoes a step in the wrong direction (subtracts what should be added back).
- Rounds too early: Rounds a value partway through, or rounds the wrong way, so the final answer drifts from the exact one.
The wrong answers, classified
A Little reason to choose it (Haladyna & Downing, 1993; Rodriguez, 2005)
No common working gives 2.6, which sits just below half of 5.4 and matches no step with the scale, so it mostly draws guesses.
B Wrong operation (Hegarty, Mayer & Monk, 1995; King et al., 2004)
Inverts the scale, multiplying 5.4 by 2/3 instead of 3/2, as if each mile took up 1.5 inches on the map.
C Rounds too early (King et al., 2004)
Rounds 5.4 inches down to 5 before scaling, so 5 × 3 ÷ 2 = 7.5 miles instead of the exact distance.
Worked solution, step by step
Formulas used
- Scale proportion
- A map shrinks every distance by the same amount. So real distance over map distance makes the same fraction everywhere on the map. Put miles on top on both sides and inches on the bottom. Then solve for the missing distance.
Sort out the question
On the map, Deshawn’s house and Xin’s house are 5.4 inches apart. The scale says 2 inches on the map stand for 3 miles. You need the real distance between the houses, in miles.
Set up the proportion
Let d be the real distance, in miles. Put miles on top and inches on the bottom, on both sides.
Solve for d
To get d alone, multiply both sides by 5.4.
The houses are 8.1 miles apart. Watch out: keep 5.4 exact. Rounding it to 5 gives 7.5 miles, choice C.
Give the answer
Watch out: don’t flip the scale. Multiplying 5.4 by gives 3.6, choice B. Each inch stands for more than a mile, so the miles must be more than 5.4. So the answer is D, 8.1.
Check your answer
Each inch stands for miles. So 5 inches is 7.5 miles, and 0.4 inch is mile. Together, miles.
More questions like this
The original DOE question
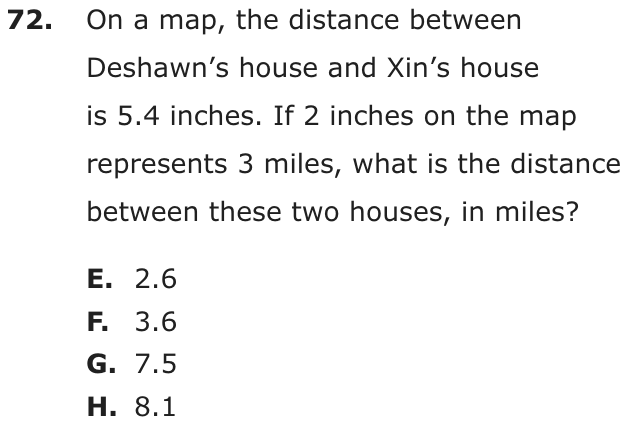
Question 20 of 23
2022 Test A Math, question 35Question
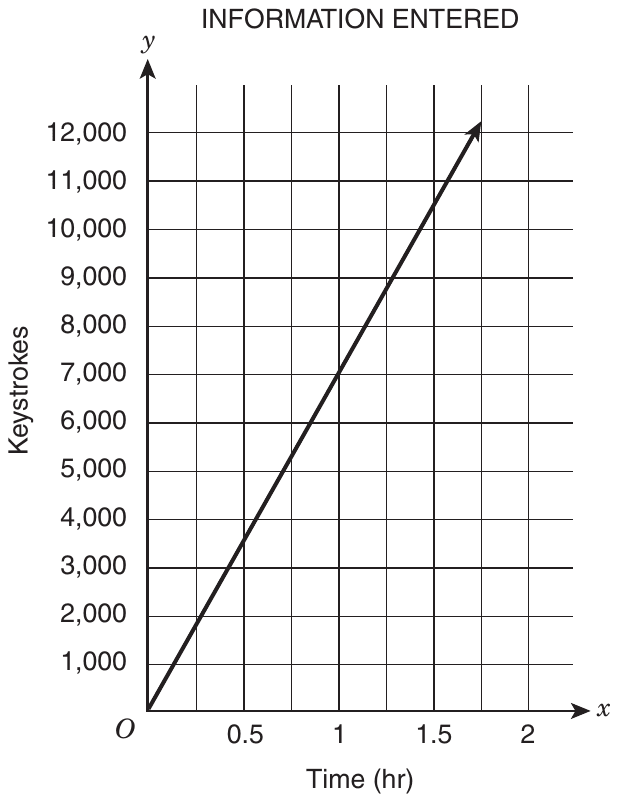
A clerk enters information on a computer. The graph shows the relationship between time, in hours, and the number of keystrokes the clerk makes. What is the meaning of the point (1.5, 10500) on the graph?
- AThe clerk makes 10,500 keystrokes in each 1 hr of entering information.
- BThe clerk makes 10,500 keystrokes in each 1.5 hr of entering information.
- CThe clerk makes 15,750 keystrokes in each 1 hr of entering information.
- DThe clerk makes 15,750 keystrokes in each 1.5 hr of entering information.
Show the answer
Correct answer: B
The x-axis represents the time, in hours, the clerk enters information into the computer, and the y-axis represents the number of keystrokes the clerk makes.
The x-value in (1.5, 10500) gives 1.5 hours as the amount of time the clerk enters information.
The y-value gives 10,500 as the number of keystrokes made by the clerk.
Since the graph is a proportional line, the clerk’s rate is 10,500 keystrokes in each 1.5 hours of entering information.
Question analysis
A straight-line graph through the origin shows how many keystrokes a clerk makes over time, in hours. Students choose the statement that explains what the point (1.5, 10500) means in this situation. Each choice pairs a number of keystrokes with a span of time, so reading both coordinates and their units correctly decides it.
- Grade level
- Grade 7 content, by NYS standard
- Compared with grade 7
- At grade 7 Explaining what a point on the graph of a proportional relationship means in its situation is a named grade 7 skill. This is a short, direct example with a clear graph, though the four statements look alike and must be read closely.
- Estimated difficulty
- Straightforward: two steps or one careful reading.
- Thinking it demands
- Depth of knowledge 2, skills and concepts · mainly understand
- What makes it hard
- Reading a figure, table or graph moderate
- A very close wrong answer minor
- Solution
- 1 step
- Reading level
- Question and choices: about grade 6, 74 words.
- Students, last 30 days
- Not enough answers yet to show (it takes 10).
Why it is hard, traps and wrong answers (shows the answer)
Why it is hard
Nothing needs computing; the question checks that a point on a proportional graph is read as a pair, a time and a count together. Students trained to look for a unit rate expect every statement about a graph to be per hour, and the two statements with 15,750 come from forcing that idea with a product. The graph itself shows 7,000 keystrokes at 1 hour, a figure no statement offers, so every per-hour statement fails.
Reading a figure, table or graph moderate Understanding the question
The stem gives the point (1.5, 10500), and the axis labels must say what each number is: 1.5 hours of time along x and 10,500 keystrokes up y. (Lesh, Post & Behr, 1987; Kirsch & Mosenthal, 1990)
A very close wrong answer minor Choosing the answer
The two statements with 10,500 keystrokes differ only in the time, each 1 hr or each 1.5 hr, so the x-coordinate alone separates them. (Embretson & Wetzel, 1987; Gorin & Embretson, 2006; Ascalon et al., 2007)
Strategy: Use the axis labels to say in words what each coordinate of the point stands for, the x-value in hours and the y-value in keystrokes, then find the statement that says the same.
Traps
- Misunderstands the concept: A wrong belief about a concept: that percents can be added, that area grows like length, that averages can be averaged, that a bigger denominator means a bigger fraction.
- Wrong operation: Adds instead of multiplying, divides the wrong way round, turns a ratio or rate upside down, or undoes a step in the wrong direction (subtracts what should be added back).
The wrong answers, classified
A Misunderstands the concept (Smith, diSessa & Roschelle, 1993; De Bock et al., 1998; Ni & Zhou, 2005)
Reads 10,500 from the point but assumes any point on a rate graph gives the amount for 1 hour, ignoring the x-coordinate, 1.5.
C Wrong operation (Hegarty, Mayer & Monk, 1995; King et al., 2004)
Multiplies 10,500 by 1.5 to get 15,750 and calls it an hourly rate, though the hourly rate is 10,500 ÷ 1.5 = 7,000.
D Numbers taken from the question (Hegarty, Mayer & Monk, 1995)
Multiplies the two coordinates, 10,500 × 1.5 = 15,750, and pairs that product with the 1.5 hours from the point, combining numbers without a model.
Worked solution, step by step
Formulas used
- A point on a graph
- A point is written as a pair in parentheses. x, the first number, tells how far across, along the bottom axis. y, the second number, tells how far up, along the side axis. The axis labels tell what each number measures.
- Unit rate from a point
- Here y is the number of keystrokes and x is the time in hours. Dividing gives the keystrokes for 1 hour. On a straight line that starts at (0, 0), every point gives the same unit rate.
Sort out the question
The graph shows how many keystrokes a clerk makes over time. A keystroke is one press of a key. You need to say what the point (1.5, 10500) means in words. Each choice pairs a number of keystrokes with an amount of time. The axis labels tell you what each number in the point stands for.
Read the x-value
The first number in a point is the x-value. The bottom axis is labeled Time (hr). So x = 1.5 means 1.5 hours of work. On the graph, 1.5 is halfway between 1 and 2.
Read the y-value
The second number is the y-value. The side axis is labeled Keystrokes. So y = 10,500 means 10,500 keystrokes. Put the two together. In 1.5 hours, the clerk makes 10,500 keystrokes.
Use the straight line
The line is straight and starts at O, the point (0, 0). That means the clerk types at a steady speed. So every 1.5 hours of work brings 10,500 keystrokes. Watch out: the point does not give a count for 1 hour. Its x-value is 1.5, not 1. Choice A treats 10,500 as the count for 1 hour.
Rule out the 15,750 choices
15,750 is . Multiplying the two numbers in a point means nothing here. The count for 1 hour comes from dividing:
That is not 15,750, so C is wrong. D is wrong too, since the graph shows 10,500 at 1.5 hours. So the answer is B: 10,500 keystrokes in each 1.5 hr.
Check your answer
Look at the graph at 1 hour. The line crosses 7,000 keystrokes there. At 1.5 hours it is at 10,500. Since , the line fits choice B. No choice gives 7,000 for 1 hour, so every per-hour choice is wrong.
More questions like this
The original DOE question
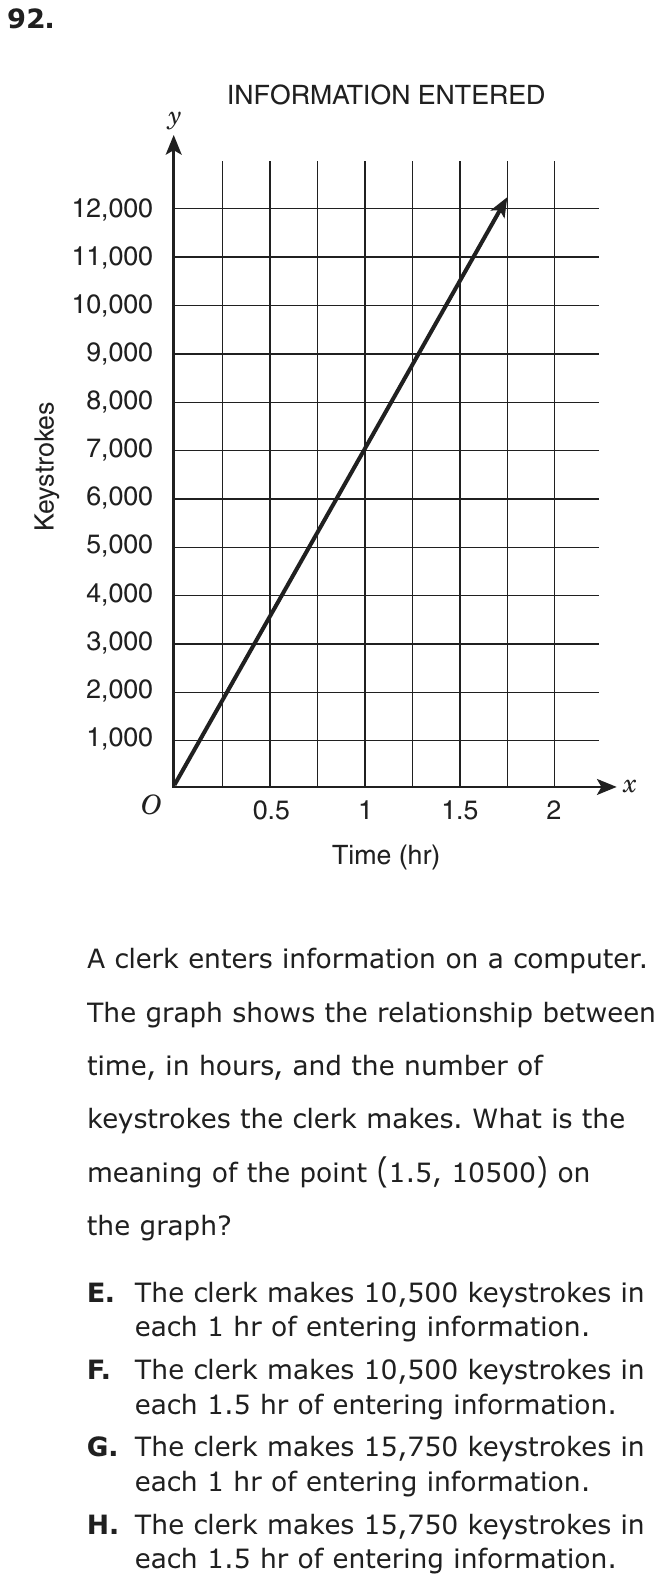
Question 21 of 23
2022 Test A Math, question 51Question
COST OF ORANGES
| Number of Oranges | Cost |
|---|---|
| 4 | $1.80 |
| 6 | $2.70 |
| 9 | $4.05 |
The table shows the cost of oranges. What is the unit rate for the cost per orange?
- A$0.45
- B$0.90
- C$1.35
- D$1.80
Show the answer
Correct answer: A
The unit rate (cost per orange) can be determined by dividing the cost of x oranges by x.
The unit rate is $0.45.
Question analysis
A table shows what 4, 6 and 9 oranges cost, in dollars and cents. Students find the unit rate, the cost of a single orange. It tests identifying a unit rate in a proportional table, and the tricky part is keeping straight which column holds the cost and which holds the number of oranges.
- Grade level
- Grade 7 content, by NYS standard
- Compared with grade 7
- Below grade 7 Finding a unit rate in a table belongs to grade 7 proportional relationships, but here it takes one division with money in a clearly proportional table, so the task is easier than typical grade 7 work.
- Estimated difficulty
- Routine: one familiar step, little to misread.
- Thinking it demands
- Depth of knowledge 1, recall and reproduction · mainly apply
- What makes it hard
- Solution
- 1 step
- Reading level
- Question and choices: about grade 3, 23 words.
- Students, last 30 days
- Not enough answers yet to show (it takes 10).
Why it is hard, traps and wrong answers (shows the answer)
Why it is hard
Any row gives the rate in one division, and the three rows agree, so the question is easy once unit rate is read as the cost of one orange. The traps are differences between rows, which look like a change per orange but cover two or three oranges, and the first cost in the table, which is for four. Dividing a second row confirms the result.
Reading a figure, table or graph minor Understanding the question
The table lists 4, 6 and 9 oranges but never a single orange, so the cost of one has to be computed from a row, such as $1.80 ÷ 4. (Lesh, Post & Behr, 1987; Kirsch & Mosenthal, 1990)
Something you must already know minor Working it out
The term unit rate is not defined; students must know it means the cost of one orange, a row's cost divided by its number of oranges. (Anderson & Krathwohl, 2001)
Strategy: Pick any row and divide its cost by its number of oranges; doing the same with a second row confirms that the rate stays the same.
Traps
- Answers a different question: A choice is right for another quantity: the other unknown, the rest instead of the part, the part instead of the whole.
- Numbers taken from the question: Combines the numbers in the question without a model of the situation, or is simply a number that appears in the question.
The wrong answers, classified
B Answers a different question (King et al., 2004; Hegarty, Mayer & Monk, 1995)
Subtracts the first two costs, $2.70 − $1.80 = $0.90, the price of 2 more oranges, without dividing by the 2 oranges it covers.
C Answers a different question (King et al., 2004; Hegarty, Mayer & Monk, 1995)
Subtracts the last two costs, $4.05 − $2.70 = $1.35, the price of 3 more oranges, rather than the price of one.
D Numbers taken from the question (Hegarty, Mayer & Monk, 1995)
Takes $1.80, the first cost in the table, which is what 4 oranges cost together, not one.
Worked solution, step by step
Formulas used
- Unit rate
- The unit rate is the cost of one item, here one orange. The cost is what a group of oranges costs together. Divide by the number of oranges in that group. Any row of the table gives the same rate, because each orange costs the same.
Sort out the question
The table gives the cost of 4, 6 and 9 oranges. It never shows the cost of one orange. A unit rate is the amount for one unit. Here that means the cost of one orange. You need to find it.
Divide one row
Use the first row: 4 oranges cost $1.80.
One orange costs $0.45. Watch out: $1.80 is the cost of 4 oranges, not one. Don’t pick choice D.
Check with the other rows
Every row gives $0.45, so the rate stays the same. Watch out: is the cost of 2 more oranges, choice B. is the cost of 3 more, choice C. Neither is for one orange. So the answer is A, $0.45.
Check your answer
Multiply back: and . Both match the table. Even a difference works once you divide: .
More questions like this
The original DOE question
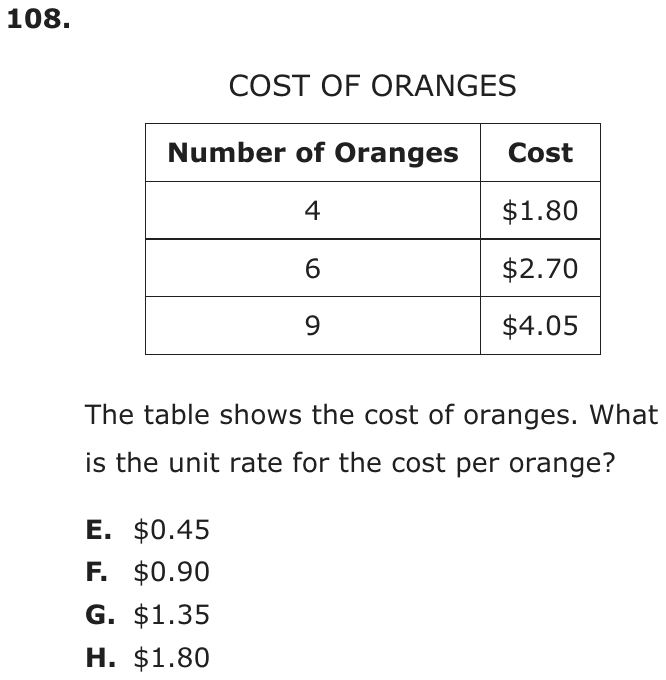
Question 22 of 23
2022 Test B Math, question 47Question
This graph shows points that represent a proportional relationship between x and y.
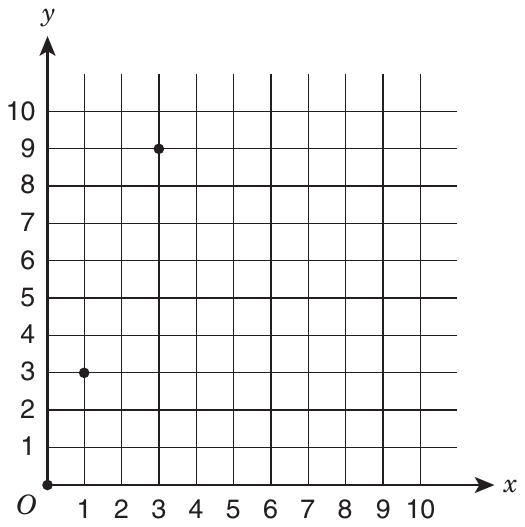
What is the constant of proportionality for this relationship?
- A0
- B1
- C3
- D9
Show the answer
Correct answer: C
A constant of proportionality, k, is the constant value of the ratio between two proportional values. Two varying values are said to be in a relation of proportionality when their ratio yields a constant. In the graph shown, the proportional relationship between x and y is represented by:
Therefore, the constant of proportionality for the relationship on the graph is:
Question analysis
A coordinate graph shows three points that represent a proportional relationship between x and y, one of them at the origin. Students choose the constant of proportionality. It tests finding the unit rate of a proportional relationship from a graph, and the choices include coordinates read straight off the points.
- Grade level
- Grade 7 content, by NYS standard
- Compared with grade 7
- Below grade 7 Identifying the constant of proportionality on a graph is a named grade 7 skill. With whole-number points on a clear grid, one division settles it, which makes this shorter than most grade 7 proportional reasoning.
- Estimated difficulty
- Routine: one familiar step, little to misread.
- Thinking it demands
- Depth of knowledge 1, recall and reproduction · mainly apply
- What makes it hard
- Solution
- 1 step
- Reading level
- Question and choices: about grade 10, 22 words.
- Corrected from the DOE handbook
- A wrong statement of what makes two quantities proportional was corrected in the explanation.
- Students, last 30 days
- Not enough answers yet to show (it takes 10).
Why it is hard, traps and wrong answers (shows the answer)
Why it is hard
A single division settles it once a point other than the origin is chosen. The point at x = 1 shows the constant directly, and the higher point confirms it. Every wrong choice is a number that can be read straight off the graph, the origin’s 0, a coordinate of 1, or the top point’s 9, so the item rewards dividing rather than reading.
Reading a figure, table or graph minor Understanding the question
The plotted points, (0, 0), (1, 3) and (3, 9), carry no labels, so their coordinates are read off the grid before y is divided by x. (Lesh, Post & Behr, 1987; Kirsch & Mosenthal, 1990)
Something you must already know minor Working it out
The question names the constant of proportionality but not how to find it: k is y ÷ x for any point other than the origin, here 3 ÷ 1 or 9 ÷ 3. (Anderson & Krathwohl, 2001)
Strategy: Pick a plotted point other than the origin, divide its y-coordinate by its x-coordinate, and confirm that another point gives the same quotient.
Traps
- Stops one step early: A choice is a number from partway through the solution.
- Misunderstands the concept: A wrong belief about a concept: that percents can be added, that area grows like length, that averages can be averaged, that a bigger denominator means a bigger fraction.
- Misreads the figure: Reads a value, label or tick spacing in a figure, table or graph wrongly.
The wrong answers, classified
A Misunderstands the concept (Smith, diSessa & Roschelle, 1993; De Bock et al., 1998; Ni & Zhou, 2005)
Takes the value at the origin, (0, 0), as the constant, confusing the constant of proportionality with the y-intercept, which is 0 for every proportional graph.
B Misreads the figure (Lesh, Post & Behr, 1987; Kirsch & Mosenthal, 1990)
Reads the x-coordinate of the unit-rate point (1, 3) instead of its y-coordinate, taking the wrong axis’s value as the constant.
D Stops one step early (King et al., 2004; Gierl et al., 2017)
Reads the y-value of the point (3, 9) and stops before dividing it by that point’s x-value, 3, to get the ratio.
What was corrected from the DOE handbook, and why
- Explanation: The handbook says “Two varying values are said to be in a relation of proportionality when either their ratio or their product yields a constant.” Some general definitions use “proportionality” for both kinds, but a constant product (y = k/x) is inverse proportion, a different relationship whose graph never passes through (0, 0). The proportional relationship this question asks about has a constant ratio y/x, which is how the explanation’s own first sentence defines the constant of proportionality. The site reads “…when their ratio yields a constant.” The answer is unchanged: k = 9/3 = 3/1 = 3.
Worked solution, step by step
Formulas used
- Constant of proportionality
- x and y are the two amounts, read from any point (x, y) except (0, 0). k is the constant of proportionality. In a proportional relationship, y divided by x gives the same number at every point. So y = kx, and y is always k times x.
Sort out the question
The graph shows a proportional relationship between x and y. In one, the ratio y ÷ x is the same at every point. A ratio compares two numbers by division. That steady ratio is the constant of proportionality, k. You need k.
Read the points
For each point, read the bottom axis for x and the side axis for y. The points are (0, 0), (1, 3) and (3, 9).
The point (0, 0) is the origin, where the axes meet. You can’t divide by 0, so use the other two points.
Divide y by x
Use the formula with each point.
Both points give 3. So y is always 3 times x.
Give the answer
Watch out: 9 is the y-value of (3, 9) before you divide, choice D. And 1 is the x-value of (1, 3), choice B. And 0, choice A, comes from the origin. Every proportional graph passes through (0, 0), so the origin can’t tell you k. So the answer is C, 3.
Check your answer
Test each point with y = 3x. When x = 1, . When x = 3, . When x = 0, y = 0. All three points fit, so k = 3.
More questions like this
The original DOE question
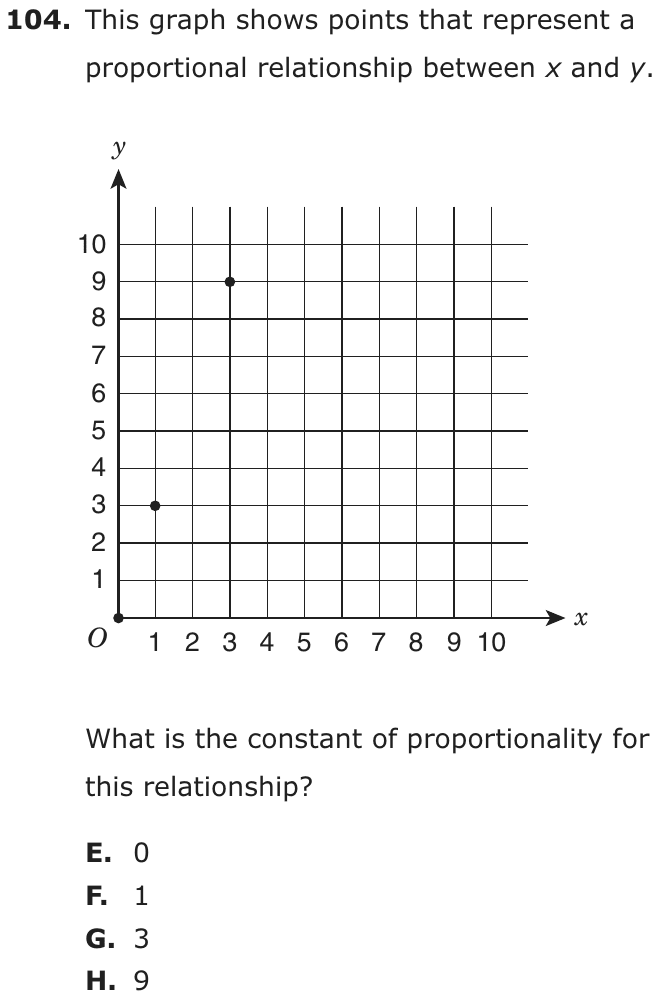
Question 23 of 23
2018 Test A Math, question 26Question
In a scale drawing of a triangular banner, one side measures 16 centimeters and the other two sides each measure 12 centimeters. On the actual banner, these two sides each measure 36 feet. What is the length of the remaining side of the actual banner?
- A16 ft
- B32 ft
- C40 ft
- D48 ft
Show the answer
Correct answer: D
Let be the remaining side of the actual banner.
Set up a proportion:
ft
Question analysis
A scale drawing word problem about a triangular banner: the drawing's sides are 16 cm, 12 cm and 12 cm, and the two equal sides are 36 feet on the real banner. Students find the actual length of the remaining side. The key is using a scale factor, not adding the difference between lengths.
- Grade level
- Grade 7 content, by NYS standard
- Compared with grade 7
- At grade 7 Scale drawings are a named grade 7 topic, and this is a direct one-factor problem. It matches typical grade 7 work; the only pull away is reasoning by differences instead of by multiplication.
- Estimated difficulty
- Straightforward: two steps or one careful reading.
- Thinking it demands
- Depth of knowledge 2, skills and concepts · mainly apply
- What makes it hard
- Turning words into math minor
- Solution
- 2 steps
- Reading level
- Question and choices: about grade 4, 46 words.
- Students, last 30 days
- Not enough answers yet to show (it takes 10).
Why it is hard, traps and wrong answers (shows the answer)
Why it is hard
A scale drawing multiplies every length by the same factor, here 3 feet per centimeter, and the question checks whether students use that factor or a difference. The 16 cm side is 4 cm longer than the others, and adding 4 to 36 feels natural but treats the scale as an addition. Students who find the factor from the matching sides first have one multiplication left.
Turning words into math minor Understanding the question
"These two sides each measure 36 feet" refers back to the 12 cm sides, so the scale pairs 12 cm with 36 ft, centimeters on the drawing against feet on the banner. (Hegarty, Mayer & Monk, 1995; Koedinger & Nathan, 2004)
Strategy: Find the scale from the matching sides, feet per centimeter, then multiply the 16 cm side by that same factor.
Traps
- Misunderstands the concept: A wrong belief about a concept: that percents can be added, that area grows like length, that averages can be averaged, that a bigger denominator means a bigger fraction.
- Units or scale: The answer is wanted in other units, or a rate or scale must be converted first.
The wrong answers, classified
A Units or scale (King et al., 2004)
Copies the 16 cm from the drawing as 16 feet, without applying the scale that turns each centimeter into 3 feet.
B Misunderstands the concept (Smith, diSessa & Roschelle, 1993; De Bock et al., 1998; Ni & Zhou, 2005)
Reasons with differences instead of a scale factor and also subtracts, 36 − 4 = 32, though the 16 cm side is the longest.
C Misunderstands the concept (Smith, diSessa & Roschelle, 1993; De Bock et al., 1998; Ni & Zhou, 2005)
Adds the 4 cm difference between 16 and 12 to the 36 feet, keeping a constant difference instead of a constant ratio.
Worked solution, step by step
Formulas used
- Scale factor
- k is the scale factor: how many real units match 1 unit on the drawing. Divide a real length by its matching length on the drawing to find it. Every length on the drawing gets multiplied by the same k. That keeps the real shape the same as the drawing.
Sort out the question
A scale drawing is a smaller copy with the same shape. The drawing is a triangle with sides of 16 cm, 12 cm and 12 cm. On the real banner, the two 12 cm sides are 36 feet each. You need the real length of the 16 cm side.
Find the scale factor
Use the matching sides: 12 cm on the drawing is 36 feet on the banner.
So every 1 cm on the drawing stands for 3 feet on the banner.
Scale up the third side
Multiply the 16 cm side by the same scale factor.
The third side is 48 feet. Watch out: a scale multiplies lengths. It does not add to them. 16 is 4 more than 12, but adding 4 to 36 gives 40, choice C. So the answer is D, 48 ft.
Check your answer
The 16 cm side is the longest side on the drawing. So it must be the longest on the banner too, longer than 36 feet. 48 fits. Also, , the same scale as .
More questions like this
The original DOE question