Question
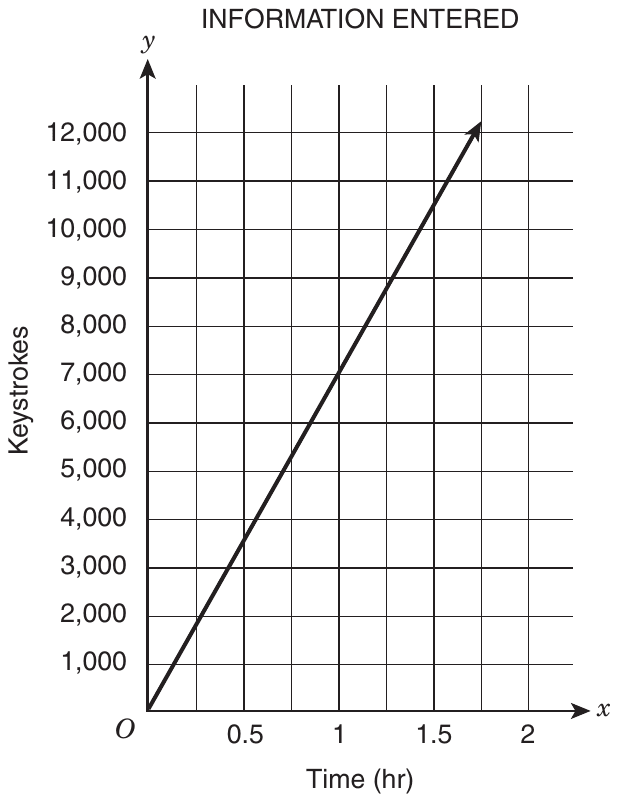
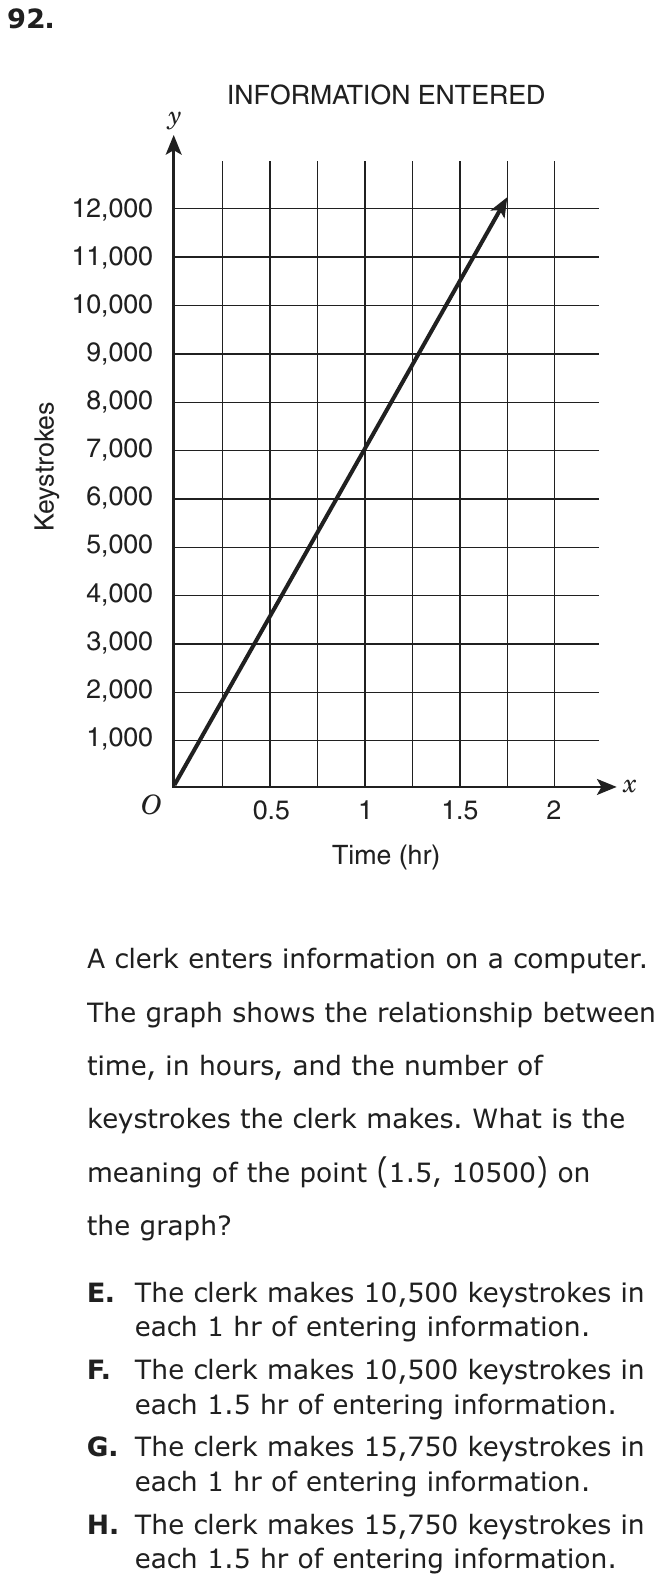
A clerk enters information on a computer. The graph shows the relationship between time, in hours, and the number of keystrokes the clerk makes. What is the meaning of the point (1.5, 10500) on the graph?
- AThe clerk makes 10,500 keystrokes in each 1 hr of entering information.
- BThe clerk makes 10,500 keystrokes in each 1.5 hr of entering information.
- CThe clerk makes 15,750 keystrokes in each 1 hr of entering information.
- DThe clerk makes 15,750 keystrokes in each 1.5 hr of entering information.
Show the answer
Correct answer: B
The x-axis represents the time, in hours, the clerk enters information into the computer, and the y-axis represents the number of keystrokes the clerk makes.
The x-value in (1.5, 10500) gives 1.5 hours as the amount of time the clerk enters information.
The y-value gives 10,500 as the number of keystrokes made by the clerk.
Since the graph is a proportional line, the clerk’s rate is 10,500 keystrokes in each 1.5 hours of entering information.
Question analysis
A straight-line graph through the origin shows how many keystrokes a clerk makes over time, in hours. Students choose the statement that explains what the point (1.5, 10500) means in this situation. Each choice pairs a number of keystrokes with a span of time, so reading both coordinates and their units correctly decides it.
- Grade level
- Grade 7 content, by NYS standard
- Compared with grade 7
- At grade 7 Explaining what a point on the graph of a proportional relationship means in its situation is a named grade 7 skill. This is a short, direct example with a clear graph, though the four statements look alike and must be read closely.
- Estimated difficulty
- Straightforward: two steps or one careful reading.
- Thinking it demands
- Depth of knowledge 2, skills and concepts · mainly understand
- What makes it hard
- Reading a figure, table or graph moderate
- A very close wrong answer minor
- Solution
- 1 step
- Reading level
- Question and choices: about grade 6, 74 words.
- Students, last 30 days
- Not enough answers yet to show (it takes 10).
Why it is hard, traps and wrong answers (shows the answer)
Why it is hard
Nothing needs computing; the question checks that a point on a proportional graph is read as a pair, a time and a count together. Students trained to look for a unit rate expect every statement about a graph to be per hour, and the two statements with 15,750 come from forcing that idea with a product. The graph itself shows 7,000 keystrokes at 1 hour, a figure no statement offers, so every per-hour statement fails.
Reading a figure, table or graph moderate Understanding the question
The stem gives the point (1.5, 10500), and the axis labels must say what each number is: 1.5 hours of time along x and 10,500 keystrokes up y. (Lesh, Post & Behr, 1987; Kirsch & Mosenthal, 1990)
A very close wrong answer minor Choosing the answer
The two statements with 10,500 keystrokes differ only in the time, each 1 hr or each 1.5 hr, so the x-coordinate alone separates them. (Embretson & Wetzel, 1987; Gorin & Embretson, 2006; Ascalon et al., 2007)
Strategy: Use the axis labels to say in words what each coordinate of the point stands for, the x-value in hours and the y-value in keystrokes, then find the statement that says the same.
Traps
- Misunderstands the concept: A wrong belief about a concept: that percents can be added, that area grows like length, that averages can be averaged, that a bigger denominator means a bigger fraction.
- Wrong operation: Adds instead of multiplying, divides the wrong way round, turns a ratio or rate upside down, or undoes a step in the wrong direction (subtracts what should be added back).
The wrong answers, classified
A Misunderstands the concept (Smith, diSessa & Roschelle, 1993; De Bock et al., 1998; Ni & Zhou, 2005)
Reads 10,500 from the point but assumes any point on a rate graph gives the amount for 1 hour, ignoring the x-coordinate, 1.5.
C Wrong operation (Hegarty, Mayer & Monk, 1995; King et al., 2004)
Multiplies 10,500 by 1.5 to get 15,750 and calls it an hourly rate, though the hourly rate is 10,500 ÷ 1.5 = 7,000.
D Numbers taken from the question (Hegarty, Mayer & Monk, 1995)
Multiplies the two coordinates, 10,500 × 1.5 = 15,750, and pairs that product with the 1.5 hours from the point, combining numbers without a model.
Worked solution, step by step
Formulas used
- A point on a graph
- A point is written as a pair in parentheses. x, the first number, tells how far across, along the bottom axis. y, the second number, tells how far up, along the side axis. The axis labels tell what each number measures.
- Unit rate from a point
- Here y is the number of keystrokes and x is the time in hours. Dividing gives the keystrokes for 1 hour. On a straight line that starts at (0, 0), every point gives the same unit rate.
Sort out the question
The graph shows how many keystrokes a clerk makes over time. A keystroke is one press of a key. You need to say what the point (1.5, 10500) means in words. Each choice pairs a number of keystrokes with an amount of time. The axis labels tell you what each number in the point stands for.
Read the x-value
The first number in a point is the x-value. The bottom axis is labeled Time (hr). So x = 1.5 means 1.5 hours of work. On the graph, 1.5 is halfway between 1 and 2.
Read the y-value
The second number is the y-value. The side axis is labeled Keystrokes. So y = 10,500 means 10,500 keystrokes. Put the two together. In 1.5 hours, the clerk makes 10,500 keystrokes.
Use the straight line
The line is straight and starts at O, the point (0, 0). That means the clerk types at a steady speed. So every 1.5 hours of work brings 10,500 keystrokes. Watch out: the point does not give a count for 1 hour. Its x-value is 1.5, not 1. Choice A treats 10,500 as the count for 1 hour.
Rule out the 15,750 choices
15,750 is . Multiplying the two numbers in a point means nothing here. The count for 1 hour comes from dividing:
That is not 15,750, so C is wrong. D is wrong too, since the graph shows 10,500 at 1.5 hours. So the answer is B: 10,500 keystrokes in each 1.5 hr.
Check your answer
Look at the graph at 1 hour. The line crosses 7,000 keystrokes there. At 1.5 hours it is at 10,500. Since , the line fits choice B. No choice gives 7,000 for 1 hour, so every per-hour choice is wrong.
More questions like this
The original DOE question