7.SP.1 box plots and interquartile range
Question 1 of 10
2026 Practice Test C Math, question 32Question
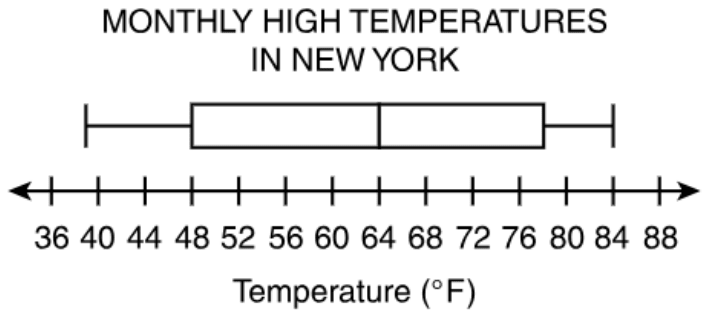
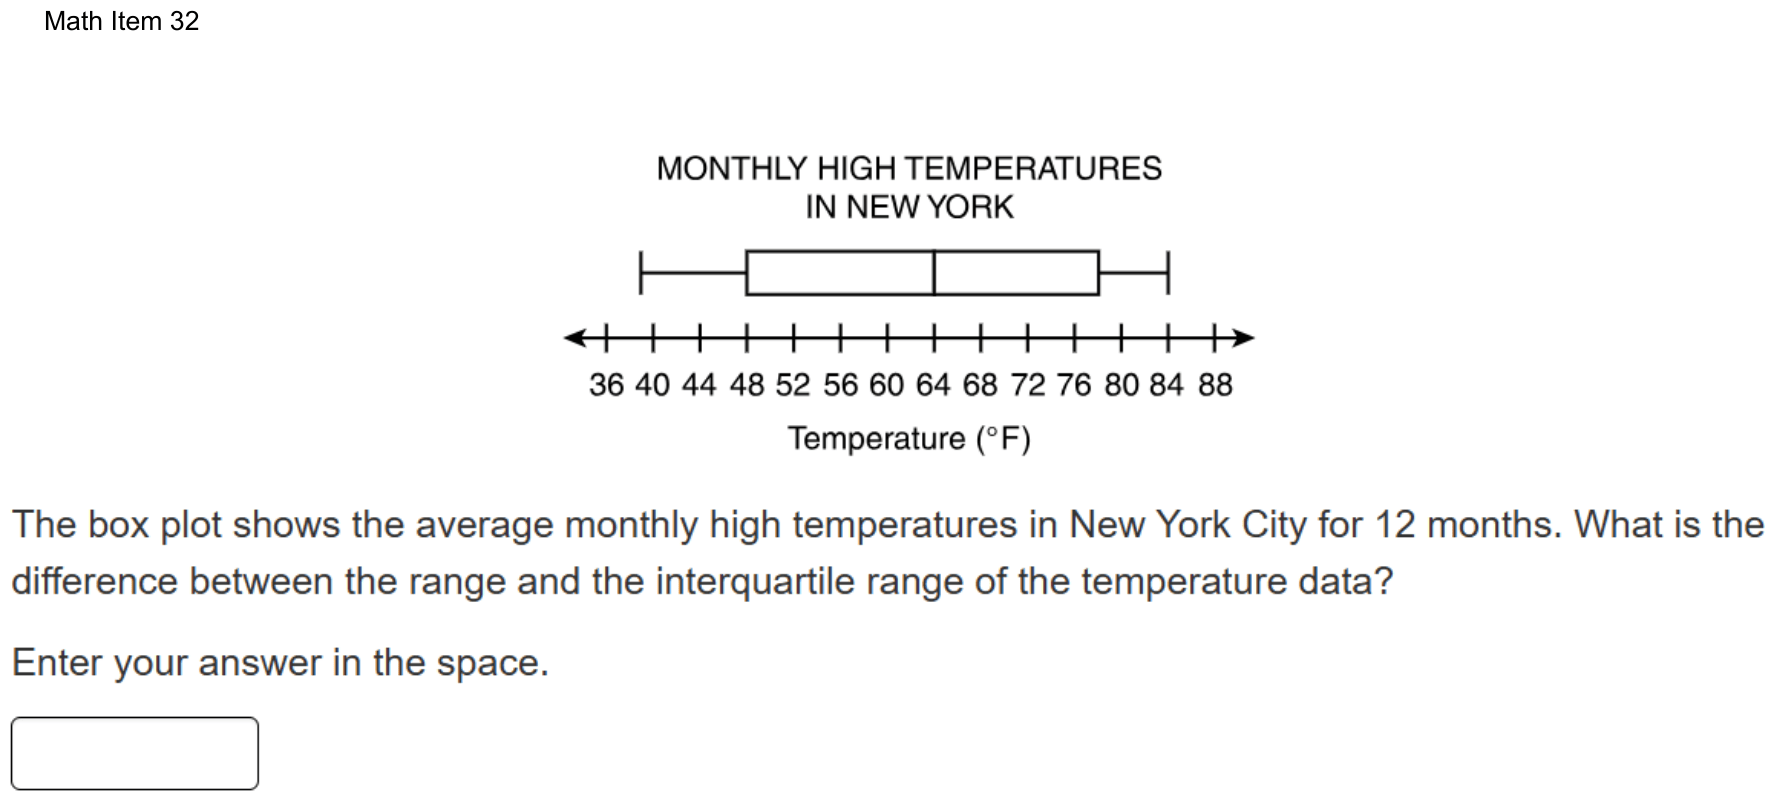
The box plot shows the average monthly high temperatures in New York City for 12 months. What is the difference between the range and the interquartile range of the temperature data?
Enter your answer in the space.
Fill-in question: work out the answer and type it as a number.
Show the answer
Correct answer: 15
Determine the range by subtracting the minimum value on the box plot from the maximum value on the box plot:
Maximum value , Minimum value
Determine the interquartile range by subtracting the lower quartile value on the box plot from the upper quartile value on the box plot:
Upper Quartile Value , Lower Quartile Value
Determine the difference between the range (45° F) and the interquartile range (30° F):
Question analysis
A box plot of New York City's average monthly high temperatures for 12 months sits above a number line labeled every 4 degrees. Students type the difference between the range and the interquartile range of the data. Two of the plot's values fall between labeled ticks, so careful reading of the scale decides the answer.
- Grade level
- Grade 7 content, by NYS standard
- Compared with grade 7
- Above grade 7 Reading a box plot and finding its interquartile range are grade 7 skills. Here two of the five values fall between ticks spaced 4 apart, and the range, the IQR and their difference must all be found and typed with no choices.
- Estimated difficulty
- Hard: combines ideas, needs a plan, and has more than one tempting wrong answer.
- Thinking it demands
- Depth of knowledge 2, skills and concepts · mainly apply
- What makes it hard
- Solution
- 3 steps
- Reading level
- Question and choices: about grade 7, 36 words.
- Students, last 30 days
- Not enough answers yet to show (it takes 10).
Why it is hard, traps and wrong answers (shows the answer)
Why it is hard
The method is standard, but the key rests on reading the scale between its labels. The axis is ticked only every 4 degrees, and the minimum and the upper quartile land off the ticks, so rounding either one to the nearest label moves the result by a degree or two with nothing to flag it. Students who find the range correctly can also stop there, entering 45, the larger of the two spreads, instead of the difference the question asks for.
Reading a figure, table or graph major Understanding the question
Two of the five values fall between ticks spaced 4 degrees apart: the left whisker ends just short of the 40 tick, at 39, and the box’s right edge sits midway between 76 and 80, at 78. (Lesh, Post & Behr, 1987; Kirsch & Mosenthal, 1990)
Many steps minor Working it out
Four values are read and combined in three subtractions, the range, the interquartile range and then their difference, so one misread value changes the final entry. (Daniel & Embretson, 2010; Enright, Morley & Sheehan, 2002)
Something you must already know minor Working it out
Neither measure is defined on the page: the range spans the whiskers, and the interquartile range is the width of the box, the upper quartile minus the lower. (Anderson & Krathwohl, 2001)
An answer in an unexpected form minor Choosing the answer
The result is typed with no choices to compare, so an entry one or two degrees off, from rounding a value to the nearest tick, looks just as finished as the right one. (Enright, Morley & Sheehan, 2002)
Strategy: Read the minimum, both quartiles and the maximum, judging where each mark falls between the ticks, then subtract for the range and for the IQR, and subtract those two results.
Traps
- Misreads the figure: Reads a value, label or tick spacing in a figure, table or graph wrongly.
- Stops one step early: A choice is a number from partway through the solution.
The wrong answers, classified
14 Misreads the figure (Lesh, Post & Behr, 1987; Kirsch & Mosenthal, 1990)
Reads the left whisker’s end as 40, the nearest labeled tick, instead of 39, so the range becomes 84 − 40 = 44 and 44 − 30 = 14.
45 Stops one step early (King et al., 2004; Gierl et al., 2017)
Finds the range, 84 − 39 = 45 degrees, and enters it, stopping before the interquartile range of 30 is subtracted from it.
17 Misreads the figure (Lesh, Post & Behr, 1987; Kirsch & Mosenthal, 1990)
Reads the box’s right edge as 76, the tick just left of it, instead of 78, so the IQR becomes 76 − 48 = 28 and 45 − 28 = 17.
Worked solution, step by step
Formulas used
- Range
- The maximum is the greatest value, at the right end of the right whisker. The minimum is the least value, at the left end of the left whisker. The range tells how far the whole set of data spreads.
- Interquartile range (IQR)
- Q3 is the upper quartile, the right edge of the box. Q1 is the lower quartile, the left edge of the box. The IQR is the width of the box. It tells how far the middle half of the data spreads.
Sort out the question
A box plot shows data with five numbers. The two whiskers are the lines on each side of the box. Their ends are the minimum, the least value, and the maximum, the greatest. The box runs from the lower quartile to the upper quartile. These are the middles of the lower half and the upper half of the data. The line inside the box is the median, the middle value.
You need the range minus the interquartile range (IQR), in degrees.
Read the values between the ticks
The ticks on the number line are 4 degrees apart. So each degree is one quarter of the space between two ticks. Three values sit right on ticks: the box’s left edge at 48, the median at 64, and the right whisker’s end at 84.
- The left whisker starts just left of the 40 tick. It sits about one quarter of the way back toward 36. So the minimum is degrees.
- The box’s right edge is halfway between 76 and 80. Halfway is 78 degrees.
Find the range
Use the range formula:
The data spread over 45 degrees.
Watch out: rounding the minimum to the 40 tick gives a range of 44. Then the final answer comes out 14, which is wrong.
Find the IQR
Use the IQR formula with the two edges of the box:
The middle half of the data spreads over 30 degrees.
Watch out: reading the box’s right edge as 76 gives an IQR of 28. Then the final answer comes out 17.
Subtract the IQR from the range
The question asks for the difference between the two:
Watch out: 45 is only the range. Do not stop there. Type only the number, with no degree sign.
So you would enter 15.
Check your answer
The range covers the whole plot, and the IQR covers only the box. So their difference is the two whiskers added together. The left whisker is degrees long. The right whisker is degrees long. , which matches.
More questions like this
The original DOE question
Question 2 of 10
2026 Practice Test C Math, question 49Question
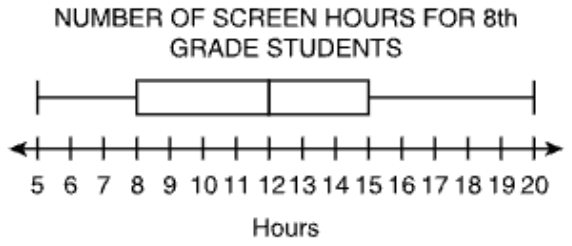
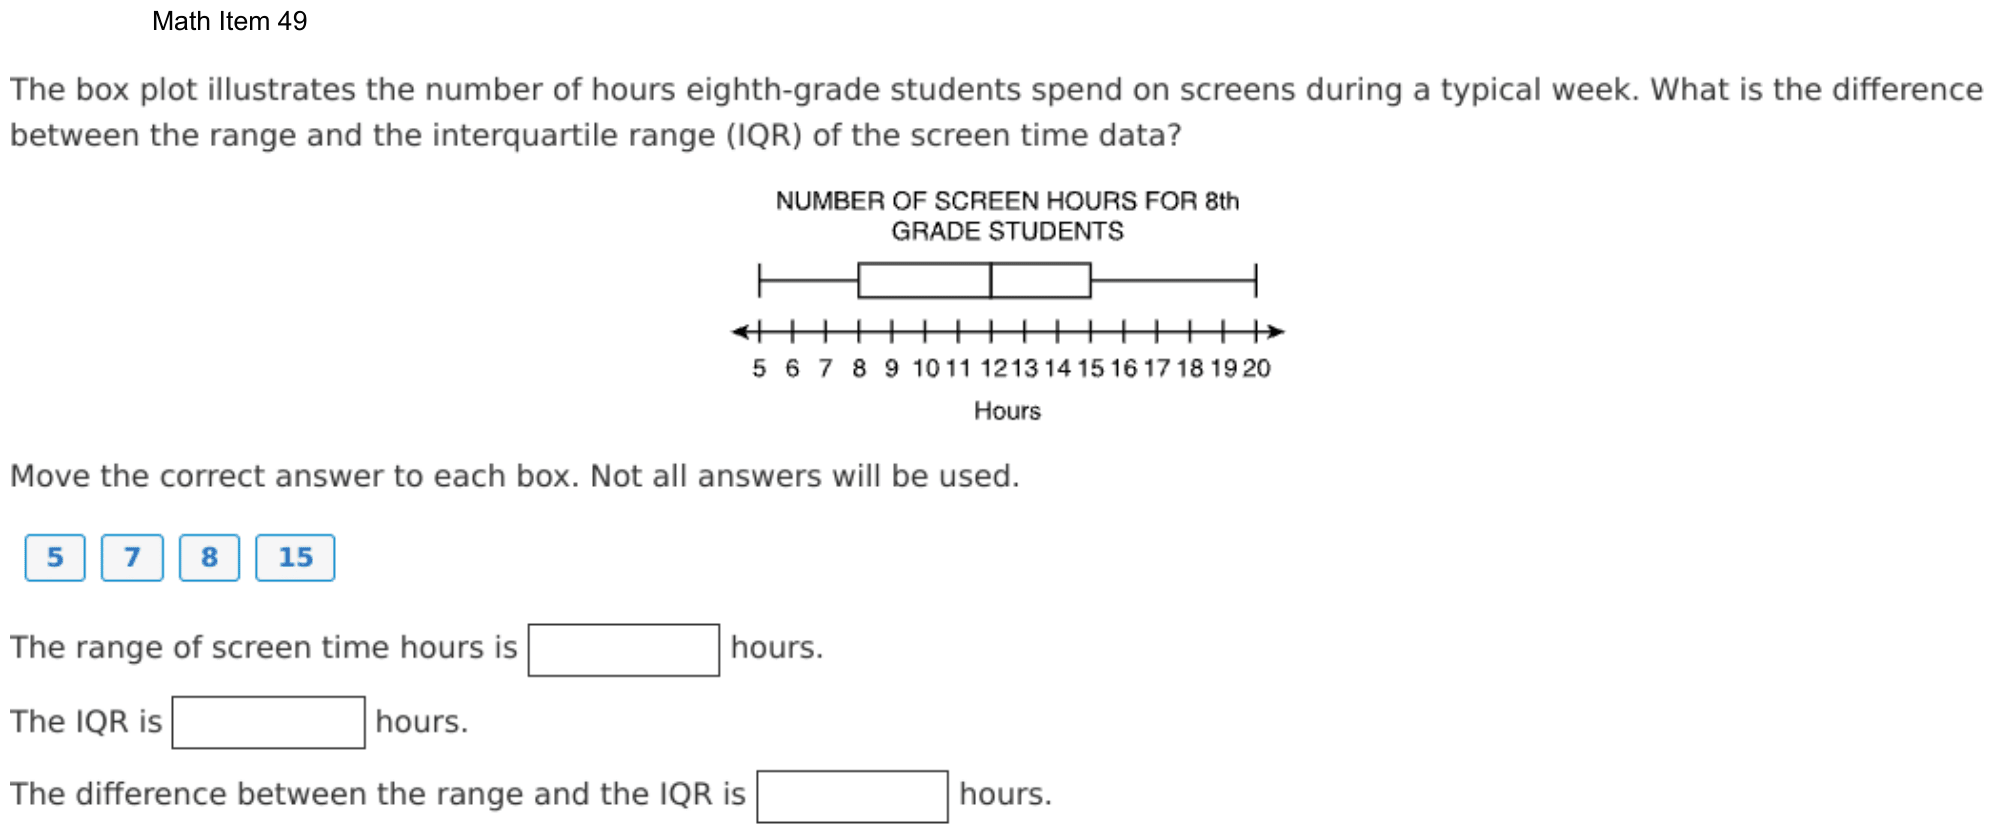
The box plot illustrates the number of hours eighth-grade students spend on screens during a typical week. What is the difference between the range and the interquartile range (IQR) of the screen time data?
Move the correct answer to each box. Not all answers will be used.
The range of screen time hours is hours.
The IQR is hours.
The difference between the range and the IQR is hours.
On the test you drag tiles into the boxes; here, choose each box’s tile from its menu. Each tile can be used once. The DOE has not published how answers with several parts are scored; this site counts one right only when every part is right.
Show the answer
Correct answer: blank 1: 15; blank 2: 7; blank 3: 8
Determine the range by subtracting the minimum value on the box plot from the maximum value on the box plot:
Maximum value , Minimum value
Determine the interquartile range by subtracting the lower quartile value on the box plot from the upper quartile value on the box plot:
Upper Quartile Value , Lower Quartile Value
Determine the difference between the range (15 hr) and the interquartile range (7 hr):
Question analysis
A box plot shows how many hours a week eighth-grade students spend on screens, on a number line marked every hour. Students move number tiles to complete three sentences: the range, the interquartile range, and the difference between them. Each tile can be used only once, and keeping the range and the interquartile range apart is the tricky part.
- Grade level
- Grade 7 content, by NYS standard
- Compared with grade 7
- At grade 7 Reading a box plot and finding its range and interquartile range are grade 7 statistics skills. The values sit on labeled whole-number ticks and the three sentences lead through the steps, a typical grade 7 task.
- Estimated difficulty
- Straightforward: two steps or one careful reading.
- Thinking it demands
- Depth of knowledge 2, skills and concepts · mainly apply
- What makes it hard
- Something you must already know minor
- Many steps minor
- Solution
- 3 steps
- Reading level
- Question and choices: about grade 4, 69 words.
- Corrected from the DOE handbook
- A missing comma in the explanation was restored.
- Students, last 30 days
- Not enough answers yet to show (it takes 10).
Why it is hard, traps and wrong answers (shows the answer)
Why it is hard
The plot is drawn on whole-hour ticks, and the three sentences lay out the steps, so this is a direct check of two definitions. The main risk is taking a value off the plot, such as the lower quartile of 8, for a spread between two values. Because the four tiles allow only one use each, a student who confuses the measures can still fill every box, which hides the error.
Something you must already know minor Working it out
The sentences name the range and the IQR but never define them; students must know the range spans the whiskers and the IQR spans only the box. (Anderson & Krathwohl, 2001)
Many steps minor Working it out
Three boxes must all be right, the third depends on the first two, and each tile can be used once, so one mix-up spreads to a second box. (Daniel & Embretson, 2010; Enright, Morley & Sheehan, 2002)
Strategy: Read the five key values off the plot, subtract the least from the greatest for the range, subtract the lower quartile from the upper for the IQR, then subtract those results.
Traps
- Misunderstands the concept: A wrong belief about a concept: that percents can be added, that area grows like length, that averages can be averaged, that a bigger denominator means a bigger fraction.
- Wrong formula: Uses a related but wrong formula: perimeter for area, diameter for radius, area for volume, or a misremembered one.
The wrong answers, classified
DCB Misunderstands the concept (Smith, diSessa & Roschelle, 1993; De Bock et al., 1998; Ni & Zhou, 2005)
Takes the lower quartile, 8, as the interquartile range, reading a value off the box instead of its width, so the difference becomes 15 − 8 = 7.
BDC Wrong formula (King et al., 2004)
Swaps the two measures, giving the box’s width, 7, as the range and the whiskers’ spread, 15, as the IQR, while the difference stays 8.
What was corrected from the DOE handbook, and why
- Explanation: The DOE’s explanation runs two values together: “Maximum value = 20 hr Minimum value = 5 hr”. Its next line is “Upper Quartile Value = 15 hr, Lower Quartile Value = 8 hr”, and Question 32’s explanation has “Maximum value = 84° F, Minimum value = 39° F”. The site adds the comma.
Worked solution, step by step
Formulas used
- Range
- The maximum is the greatest value, at the right end of the right whisker. The minimum is the least value, at the left end of the left whisker. The range tells how far the whole set of data spreads.
- Interquartile range (IQR)
- Q3 is the upper quartile, the right edge of the box. Q1 is the lower quartile, the left edge of the box. The IQR is the width of the box. It tells how far the middle half of the data spreads.
Sort out the question
The box plot shows the hours of screen time for eighth graders in a week. You need three numbers: the range, the IQR, and the difference between them.
There are four tiles: 5, 7, 8 and 15. Each tile is used at most once, and one tile is left over.
Read the five values
The number line has a tick at every hour, and every value sits on a tick:
- The left whisker starts at 5. This is the minimum.
- The box starts at 8. This is the lower quartile, the middle of the lower half of the data.
- The line inside the box is at 12. This is the median, the middle value.
- The box ends at 15. This is the upper quartile, the middle of the upper half.
- The right whisker ends at 20. This is the maximum.
Find the range
Use the range formula with the two ends of the whiskers:
The screen times spread over 15 hours, from the least to the most.
Find the IQR
Use the IQR formula with the two edges of the box:
The middle half of the students spend between 8 and 15 hours, a spread of 7 hours.
Watch out: the IQR is a width, not a point on the plot. The tile 8 is the lower quartile. Putting it in the IQR box also makes the last box 7, which is wrong.
Find the difference
Subtract the IQR from the range:
Watch out: do not swap the two measures. The range uses the whiskers’ ends, and the IQR uses only the box.
Fill in the three boxes
On the test, you drag a tile into each box. On this site, you choose each tile from its box’s menu. The range box gets 15, the IQR box gets 7, and the difference box gets 8. The tile 5 is not used.
So the boxes get 15, 7 and 8.
Check your answer
The difference is just the two whiskers added together. The left whisker is hours long. The right whisker is hours long. , which matches the third box.
More questions like this
The original DOE question
Question 3 of 10
2024 Test B Math, question 18Question
A taxi driver recorded the number of fares each day for one month. The box plot displays the data.
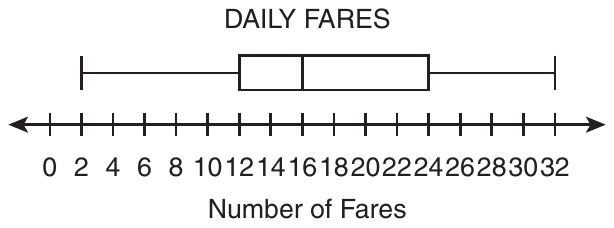
Based on the box plot, which statement is a correct interpretation of the data?
- AThe data point 2 is an outlier.
- BThe mean of the data is 16.
- CThe interquartile range (IQR) of the data is 30.
- DOn about 25% of the days, there were between 12 and 16 fares.
Show the answer
Correct answer: D
The amount of data in a box plot is broken into 4 parts, or quartiles, which each represent 25% of the data. So the amount of data represented between Quartile 1 (12) and the median (16) is about 25% of the data.
Question analysis
A statistics question on a box plot of the number of fares a taxi driver recorded each day for one month. Students decide which of four statements is a correct interpretation of the data, using what a box plot does and does not show. The statements draw on several different box plot ideas, so each one must be checked.
- NYS standards
- 7.SP.1 box plots and interquartile range
- Grade level
- Grade 7 content, by NYS standard
- Compared with grade 7
- At grade 7 Reading box plots, finding the interquartile range and testing for outliers are all grade 7 standards in New York. This item gathers several of them in one question, but each check is short, typical of grade 7 work.
- Estimated difficulty
- Moderate: several steps, or a close reading with one strong distractor.
- Thinking it demands
- Depth of knowledge 2, skills and concepts · mainly understand
- What makes it hard
- Something you must already know moderate
- Every choice must be checked moderate
- Reading a figure, table or graph minor
- Solution
- 3 steps
- Reading level
- Question and choices: about grade 4, 63 words.
- Students, last 30 days
- Not enough answers yet to show (it takes 10).
Why it is hard, traps and wrong answers (shows the answer)
Why it is hard
No calculation here is long; the challenge is knowing what a box plot does and does not show. Two of the wrong statements sound reasonable because they borrow real features of the plot, its long left whisker and its middle line, and give them the wrong meaning. Remembering that the plot splits the days into four groups of about equal size makes the true statement easy to confirm.
Something you must already know moderate Working it out
Each statement draws on a box plot fact the test does not supply: what the middle line marks, how the IQR is found, and when a value counts as an outlier. (Anderson & Krathwohl, 2001)
Every choice must be checked moderate Choosing the answer
The four statements test four separate ideas, an outlier, the mean, the IQR and a quartile's share, so ruling out one says nothing about the next. (Embretson & Wetzel, 1987)
Reading a figure, table or graph minor Understanding the question
The scale is labeled every 2 fares with the numbers crowded together, so the five values 2, 12, 16, 24 and 32 must be read off with care. (Lesh, Post & Behr, 1987; Kirsch & Mosenthal, 1990)
Strategy: Read the minimum, quartiles, median and maximum off the plot, then test each statement in turn, computing the IQR and the outlier cutoffs rather than judging by eye.
Traps
- Misunderstands the concept: A wrong belief about a concept: that percents can be added, that area grows like length, that averages can be averaged, that a bigger denominator means a bigger fraction.
- Wrong formula: Uses a related but wrong formula: perimeter for area, diameter for radius, area for volume, or a misremembered one.
The wrong answers, classified
A Misunderstands the concept (Smith, diSessa & Roschelle, 1993; De Bock et al., 1998; Ni & Zhou, 2005)
Takes the long left whisker as a sign that 2 is an outlier, but that whisker holds a quarter of the days, and 2 is above the cutoff 12 − 1.5 × 12 = −6.
B Misunderstands the concept (Smith, diSessa & Roschelle, 1993; De Bock et al., 1998; Ni & Zhou, 2005)
Takes the median line at 16 for the mean, though a box plot shows the median and quartiles and cannot show the mean.
C Wrong formula (King et al., 2004)
Subtracts the minimum from the maximum, 32 − 2 = 30, which is the range, not the interquartile range of 24 − 12 = 12.
Worked solution, step by step
Formulas used
- Interquartile range (IQR)
- Q1 is the first quartile, the left edge of the box. Q3 is the third quartile, the right edge. The IQR is the length of the box. It tells how spread out the middle half of the data is.
- Low cutoff for an outlier
- Q1 and the IQR are found from the box. An outlier is a value far away from the rest. A value below this cutoff counts as an outlier on the low side. A value at or above it does not.
Read the five numbers
A box plot sums up a set of data with five numbers. Here each piece of data is the number of fares on one day.
- Minimum, the smallest value: 2
- First quartile, Q1, the left edge of the box: 12
- Median, the middle value, the line inside the box: 16
- Third quartile, Q3, the right edge of the box: 24
- Maximum, the largest value: 32
Learn what each part holds
These five numbers split the days into four parts. Each part holds about one fourth of the days, or about 25%. For example, about 25% of the days fall between the minimum and Q1. Another 25% fall between Q1 and the median.
Check choice D
Choice D talks about days with between 12 and 16 fares. 12 is Q1, and 16 is the median. That stretch is one of the four parts. So on about 25% of the days, there were between 12 and 16 fares. Choice D is correct.
Rule out choices B and C
Choice B: a box plot shows the median, 16, not the mean (the average). You cannot find the mean from it. Watch out: do not mix up the median and the mean.
Choice C says the IQR is 30. But 30 is the range, . Watch out: the IQR uses the edges of the box, not the ends of the whiskers.
Rule out choice A and answer
A long whisker does not make 2 an outlier. Use the cutoff rule.
2 is above −6, so 2 is not an outlier. The long whisker just shows that the lowest fourth of the days is spread out.
So the answer is D.
Check your answer
Go back over the four choices. Only D uses what a box plot really shows: four parts of about 25% each. Choice B needs the mean, which the plot does not show. Choice C gives the range, not the IQR. And 2 is not far enough out to be an outlier, so A is wrong.
More questions like this
The original DOE question
Question 4 of 10
2024 Test B Math, question 28Question
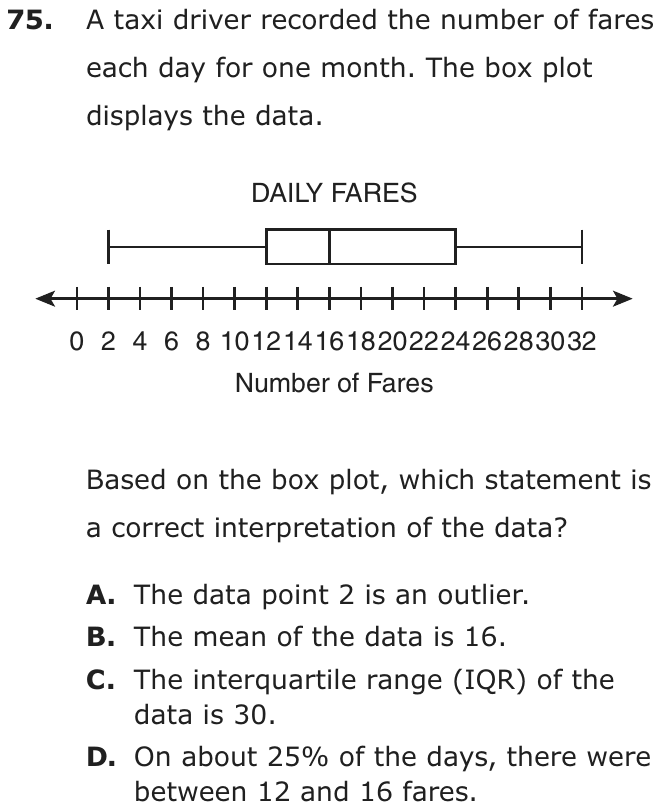
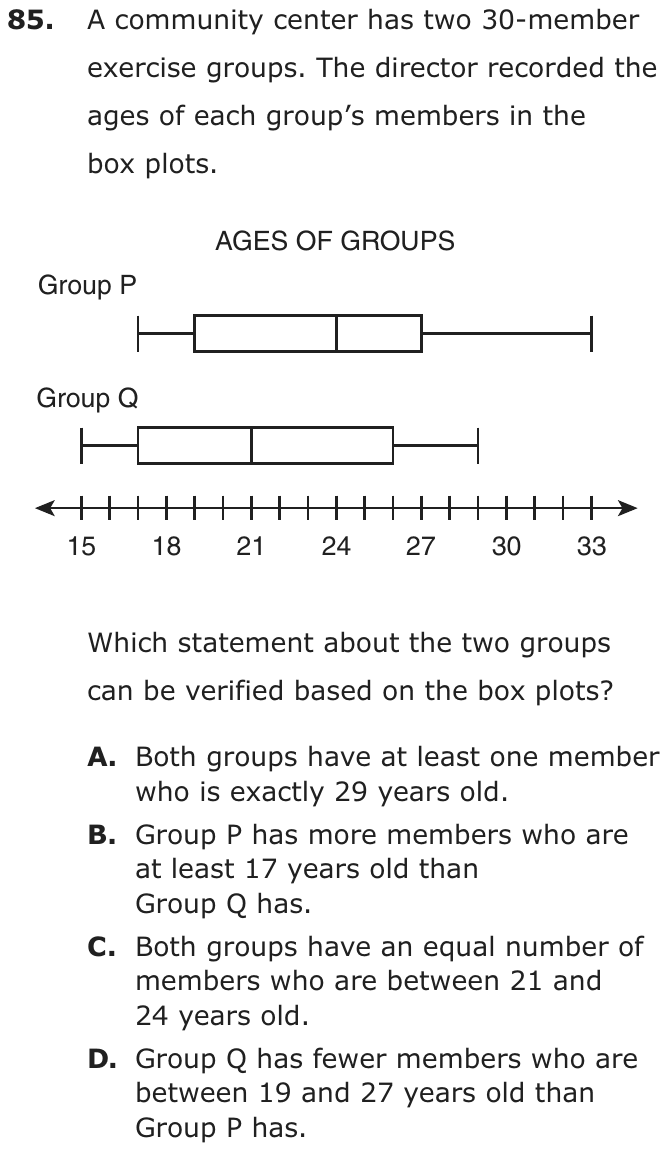
A community center has two 30-member exercise groups. The director recorded the ages of each group’s members in the box plots.
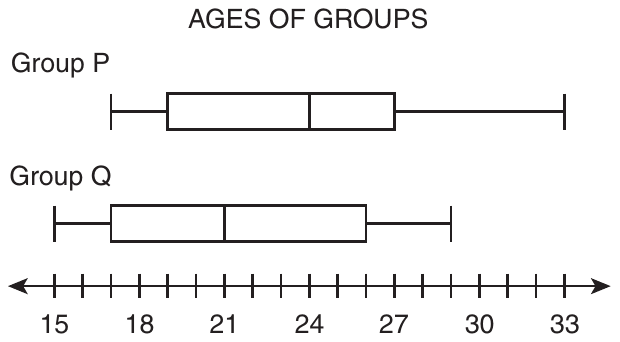
Which statement about the two groups can be verified based on the box plots?
- ABoth groups have at least one member who is exactly 29 years old.
- BGroup P has more members who are at least 17 years old than Group Q has.
- CBoth groups have an equal number of members who are between 21 and 24 years old.
- DGroup Q has fewer members who are between 19 and 27 years old than Group P has.
Show the answer
Correct answer: B
Groups P and Q have an equal number of members. All the members of Group P are 17 or older, but only about of the members of Group Q are 17 or older.
Question analysis
Box plots show the ages of the members of two 30-member exercise groups at a community center, Group P and Group Q. Students decide which statement comparing the groups can be verified from the plots alone. The challenge is knowing what a box plot guarantees about individual ages and counts, and what it leaves unknown.
- NYS standards
- Grade level
- Grade 7 content, by NYS standard
- Compared with grade 7
- Above grade 7 Grade 7 students read box plots and compare medians and spreads. Deciding which claims two box plots can prove, from what the five key values guarantee about counts, is a harder reasoning task than typical grade 7 work.
- Estimated difficulty
- Hard: combines ideas, needs a plan, and has more than one tempting wrong answer.
- Thinking it demands
- Depth of knowledge 3, strategic thinking · mainly evaluate
- What makes it hard
- Every choice must be checked major
- Something you must already know moderate
- Reading a figure, table or graph moderate
- Solution
- 3 steps
- Reading level
- Question and choices: about grade 5, 91 words.
- Students, last 30 days
- Not enough answers yet to show (it takes 10).
Why it is hard, traps and wrong answers (shows the answer)
Why it is hard
This is a question about evidence: the right statement is the only one the box plots guarantee, while the others may or may not be true. Students who treat the plots as pictures of every member, assuming ages fill each whisker or spread evenly through each box, find support for claims that cannot be checked. Asking what must hold for any 30 ages with these summaries separates the verifiable claim from the merely plausible ones.
Every choice must be checked major Choosing the answer
Three of the statements are not false but unverifiable, so each must be tested against what the five-number summaries guarantee, and none can be dismissed at a glance. (Embretson & Wetzel, 1987)
Something you must already know moderate Working it out
Students must know that the minimum and maximum are actual ages, that each quarter of a plot holds about a quarter of the 30 members, and that a whisker shows nothing in between. (Anderson & Krathwohl, 2001)
Reading a figure, table or graph moderate Understanding the question
The scale is labeled only every 3 years, so values such as 17, 19, 26 and 29 have to be read from unlabeled ticks on two separate plots. (Lesh, Post & Behr, 1987; Kirsch & Mosenthal, 1990)
Strategy: List each group's minimum, first quartile, median, third quartile and maximum, then test every statement against only what those five values guarantee about the 30 ages.
Traps
- Misunderstands the concept: A wrong belief about a concept: that percents can be added, that area grows like length, that averages can be averaged, that a bigger denominator means a bigger fraction.
- Numbers taken from the question: Combines the numbers in the question without a model of the situation, or is simply a number that appears in the question.
The wrong answers, classified
A Misunderstands the concept (Smith, diSessa & Roschelle, 1993; De Bock et al., 1998; Ni & Zhou, 2005)
Sees that Group Q's maximum is exactly 29 and that 29 also lies in Group P's upper whisker, assuming someone in Group P is that age.
C Numbers taken from the question (Hegarty, Mayer & Monk, 1995)
Matches the two medians, 21 and 24, and assumes the stretch between them holds the same number of members in both groups.
D Misunderstands the concept (Smith, diSessa & Roschelle, 1993; De Bock et al., 1998; Ni & Zhou, 2005)
Knows Group P's box from 19 to 27 holds half its members, then assumes ages spread evenly so Group Q has fewer there, which its plot cannot show.
Worked solution, step by step
Formulas used
- Members in each part of a box plot
- n is the number of members in a group, here 30. A box plot splits the data into four parts at the minimum, Q1, the median, Q3 and the maximum. Each part holds about one fourth of the data. It does not show how the ages spread out inside a part.
Read the two box plots
A box plot shows five numbers. The minimum is the youngest age, and the maximum is the oldest. Q1 is the left edge of the box, and Q3 is the right edge. The median is the line inside the box.
Group Min Q1 Median Q3 Max P 17 19 24 27 33 Q 15 17 21 26 29 Each group has 30 members.
Know what can be verified
To verify a statement means to know for sure that it is true. A box plot shows only five numbers, not every age. The minimum and maximum are real ages of real members. The other ages are hidden inside the box and whiskers.
Check choice B
In Group P, the youngest member is 17. So all 30 members are at least 17. In Group Q, the youngest member is 15, and 15 is under 17. So at most 29 members of Group Q are at least 17.
Group P has 30 such members, and Group Q has 29 or fewer. So choice B is true for sure.
Rule out choices A and C
A: Group Q’s oldest member is 29, so Group Q has a 29-year-old. But in Group P, 29 is inside the right whisker. A whisker does not show single ages. Watch out: 29 is in Group P’s range, but maybe no one in Group P is exactly 29.
C: The plots do not show how many members are between 21 and 24 in either group.
Rule out choice D and answer
Group P’s box, from 19 to 27, is two of its four parts.
So about 15 members of Group P are between 19 and 27. But 19 and 27 fall in the middle of Group Q’s parts, and ages inside a part can bunch up in any way. Group Q could have more or fewer. Watch out: D assumes the ages are spread out evenly, and a box plot never tells you that.
So the answer is B.
Check your answer
Choice B uses only the two minimums, which are real ages. Group P’s youngest member is 17, and Group Q’s is 15. That alone proves it. Each other choice needs ages inside a box or whisker, which a box plot does not show.
More questions like this
The original DOE question
Question 5 of 10
2023 Test A Math, question 15Question
A swim instructor used the box plot below to display the distribution of the ages of students who signed up for swim lessons.
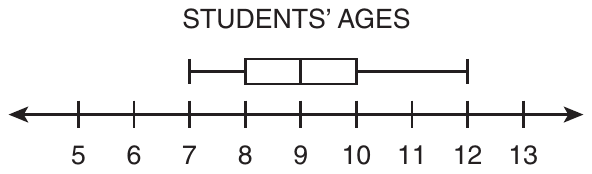
Which statement about the distribution of ages is true?
- AThe data contain an outlier.
- BApproximately half the students are exactly 9 years old.
- CApproximately one-fourth of the students are at least 10 years old.
- DThe interquartile range is 3 greater than the range of the data.
Show the answer
Correct answer: C
The data points in the box plot are as follows:
- minimum: 7
- first quartile: 8
- median: 9
- third quartile: 10
- maximum: 12
Since the value of the third quartile is 10, approximately one-fourth of the students are 10–12 years old.
Question analysis
A swim instructor's box plot shows the ages of students who signed up for lessons. Students decide which of four statements about the distribution is true, using the minimum, quartiles, median and maximum. The statements test different box plot ideas, including outliers, the median, the quartiles and the range, so each needs its own check.
- Grade level
- Grade 7 content, by NYS standard
- Compared with grade 7
- At grade 7 New York places box plots, the interquartile range and outliers in grade 7. Here four statements test those ideas one at a time; each check is short, so the item matches typical grade 7 work.
- Estimated difficulty
- Moderate: several steps, or a close reading with one strong distractor.
- Thinking it demands
- Depth of knowledge 2, skills and concepts · mainly understand
- What makes it hard
- Something you must already know moderate
- Every choice must be checked moderate
- Reading a figure, table or graph minor
- Solution
- 3 steps
- Reading level
- Question and choices: about grade 8, 66 words.
- Students, last 30 days
- Not enough answers yet to show (it takes 10).
Why it is hard, traps and wrong answers (shows the answer)
Why it is hard
Reading the five values off the plot is quick; the work is knowing what a box plot can and cannot say. It shows where quarters of the data begin and end, not how many students share any one age, and a long whisker is not an outlier unless it passes the 1.5 × IQR cutoff, here 13. The true statement uses the third quartile: about a quarter of the students are 10 or older.
Something you must already know moderate Working it out
The statements rely on box plot facts the question does not give: each section holds about a quarter of the data, the middle line is the median, and outliers lie beyond 1.5 IQRs. (Anderson & Krathwohl, 2001)
Every choice must be checked moderate Choosing the answer
Four statements test four separate ideas, an outlier, the share at one age, a quarter of the data and two spreads, so ruling one out says nothing about the rest. (Embretson & Wetzel, 1987)
Reading a figure, table or graph minor Understanding the question
The five values, 7, 8, 9, 10 and 12, are read off a 5-to-13 scale, where the longer right whisker draws the eye more than the box does. (Lesh, Post & Behr, 1987; Kirsch & Mosenthal, 1990)
Strategy: Read the five key values off the plot, then test each statement: compute the range, the interquartile range and the outlier cutoffs, and recall what share of the data each part holds.
Traps
- Misunderstands the concept: A wrong belief about a concept: that percents can be added, that area grows like length, that averages can be averaged, that a bigger denominator means a bigger fraction.
- Wrong formula: Uses a related but wrong formula: perimeter for area, diameter for radius, area for volume, or a misremembered one.
The wrong answers, classified
A Misunderstands the concept (Smith, diSessa & Roschelle, 1993; De Bock et al., 1998; Ni & Zhou, 2005)
Takes the long right whisker, reaching 12, as a sign of an outlier, but 12 is below the cutoff 10 + 1.5 × 2 = 13.
B Misunderstands the concept (Smith, diSessa & Roschelle, 1993; De Bock et al., 1998; Ni & Zhou, 2005)
Reads the median line at 9 as the age of half the students, though a median only splits the ages into a lower and an upper half.
D Wrong formula (King et al., 2004)
Swaps the two measures, taking the box's 2 years as the range and the whiskers' 5 years as the interquartile range, so the IQR seems 3 greater.
Worked solution, step by step
Formulas used
- Range
- The maximum is the largest value, the right end of a box plot. The minimum is the smallest, the left end. The range is how far apart they are. It shows how spread out all the data are.
- Interquartile range
- IQR is short for interquartile range. Q1, the first quartile, is the left edge of the box. Q3, the third quartile, is the right edge. The IQR is the width of the box. It is the spread of the middle half of the data. The four parts of a box plot each hold about one-fourth of the data.
- Outlier test
- An outlier is a value far from the rest of the data. A common rule says a value is an outlier if it lies more than 1.5 IQRs below Q1 or above Q3.
Read the five values off the plot
A box plot shows five numbers. The median is the middle value when the ages are in order.
Part Age Minimum, the left whisker’s end 7 First quartile, Q1, the box’s left edge 8 Median, the line in the box 9 Third quartile, Q3, the box’s right edge 10 Maximum, the right whisker’s end 12 Check choice A, an outlier
An outlier would be above 13 or below 5. The ages only run from 7 to 12. So there is no outlier. Watch out: a long whisker is not an outlier. It just means the top ages are spread out. Choice A is false.
Check choice B, the median
The median, 9, is the middle age. About half the students are 9 or younger. About half are 9 or older. It does not tell how many are exactly 9. Watch out: the median line does not mean half the students are 9. Choice B is false.
Check choice C, the top fourth
The box plot splits the students into four groups of about the same size. Each group holds about one-fourth of them. The last group runs from Q3, 10, to the maximum, 12. At least 10 means 10 or more. So about one-fourth of the students are at least 10 years old. Choice C is true.
Check choice D, the two spreads
The IQR is 3 less than the range, not 3 greater. The box always fits inside the whiskers, so the IQR can never be bigger. Watch out: swapping the two measures gives choice D. So the answer is C: about one-fourth of the students are at least 10 years old.
Check your answer
Picture 20 students. About 5 would be in each fourth of the plot. The top 5 would be ages 10 to 12. That is about one-fourth, just as choice C says. Each other choice fails a fact you can read straight off the plot.
More questions like this
The original DOE question
Question 6 of 10
2023 Test A Math, question 48Question
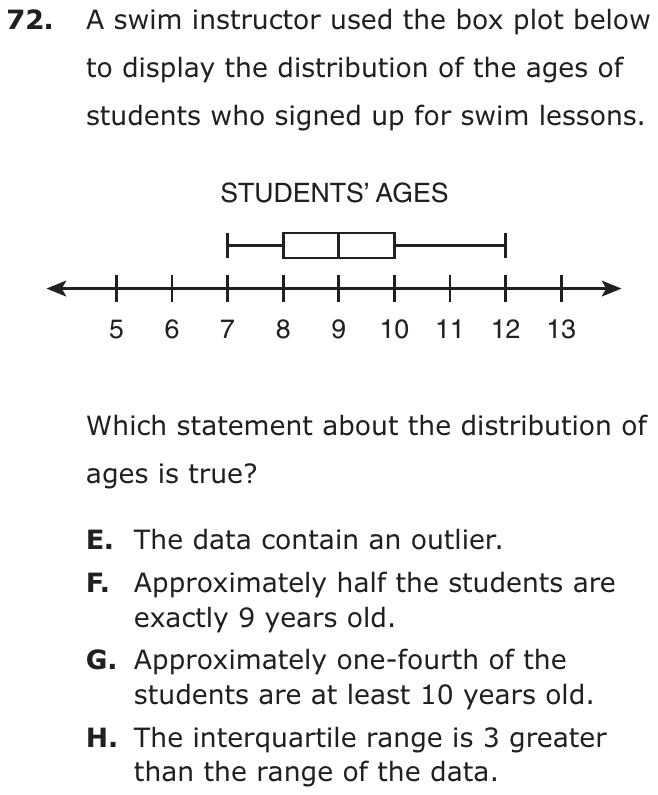
The manager of a shipping company recorded the weights, in pounds, of the last 9 packages the company shipped. The manager displayed the distribution of the weights in a box plot with the five-number summary shown below:
- minimum: 29
- first quartile: 31
- median: 42
- third quartile: 73
- maximum: 98
Which statement about the distribution of weights is supported by the box plot the manager created?
- AThe minimum, 29, is an outlier.
- BThe maximum, 98, is an outlier.
- CThe interquartile range of the data is 11.
- DThe interquartile range and the median are equal.
Show the answer
Correct answer: D
First, identify the first quartile and the third quartile:
- first quartile: 31
- third quartile: 73
Then, find the difference between the first quartile and the third quartile:
The median is given: 42.
So, the interquartile range and the median are equal.
Question analysis
This statistics question gives the five-number summary of nine package weights shown in a box plot and asks which statement about the distribution is supported. Students compute the interquartile range and decide whether the minimum or the maximum is an outlier. Judging outliers by eye, or subtracting the wrong pair of values for the IQR, makes wrong statements look true.
- NYS standards
- 7.SP.1 box plots and interquartile range
- Grade level
- Grade 7 content, by NYS standard
- Compared with grade 7
- At grade 7 Finding the interquartile range and testing for outliers are grade 7 standards in New York. There is no plot to read here, only five numbers, but every statement has to be checked by calculation, which makes it a careful grade 7 task.
- Estimated difficulty
- Moderate: several steps, or a close reading with one strong distractor.
- Thinking it demands
- Depth of knowledge 2, skills and concepts · mainly apply
- What makes it hard
- Something you must already know moderate
- Every choice must be checked moderate
- Solution
- 3 steps
- Reading level
- Question and choices: about grade 7, 84 words.
- Students, last 30 days
- Not enough answers yet to show (it takes 10).
Why it is hard, traps and wrong answers (shows the answer)
Why it is hard
The numbers are given outright, so the work is knowing what each statement claims and testing it. The outlier statements sound right because 98 looks far from 73 and 29 is the smallest value, but the 1.5 × IQR rule clears both. The true statement needs only one subtraction, 73 − 31, and a look at the median, which happens to have the same value.
Something you must already know moderate Working it out
Neither the interquartile range, the third quartile minus the first, nor the outlier rule, more than 1.5 × IQR beyond a quartile, is defined on the page. (Anderson & Krathwohl, 2001)
Every choice must be checked moderate Choosing the answer
The four statements test different ideas, two possible outliers, a value for the IQR and a comparison of the IQR with the median, so ruling out one says nothing about the next. (Embretson & Wetzel, 1987)
Strategy: Compute the interquartile range from the two quartiles, use it to set the outlier cutoffs 1.5 IQR beyond each quartile, and test every statement against those numbers.
Traps
- Misunderstands the concept: A wrong belief about a concept: that percents can be added, that area grows like length, that averages can be averaged, that a bigger denominator means a bigger fraction.
- Wrong formula: Uses a related but wrong formula: perimeter for area, diameter for radius, area for volume, or a misremembered one.
The wrong answers, classified
A Misunderstands the concept (Smith, diSessa & Roschelle, 1993; De Bock et al., 1998; Ni & Zhou, 2005)
Calls 29 an outlier just because it is the minimum, though it sits only 2 below the first quartile and far inside the cutoff 31 − 63 = −32.
B Misunderstands the concept (Smith, diSessa & Roschelle, 1993; De Bock et al., 1998; Ni & Zhou, 2005)
Judges 98 an outlier because it lies 25 above the third quartile, without testing it against the cutoff 73 + 1.5 × 42 = 136.
C Wrong formula (King et al., 2004)
Subtracts the first quartile from the median, 42 − 31 = 11, instead of from the third quartile, measuring only the lower half of the box.
Worked solution, step by step
Formulas used
- Interquartile range
- Q1, the first quartile, is the middle of the lower half of the data. Q3, the third quartile, is the middle of the upper half. The interquartile range, or IQR, is the distance between them. It is the width of the box in a box plot. It shows how spread out the middle half of the data is.
- Outlier rule
- An outlier is a value far away from the rest of the data. Q1 and Q3 are the quartiles, and IQR is the interquartile range. A value is an outlier if it lies more than 1.5 times the IQR below Q1 or above Q3.
Sort out the question
The manager’s box plot is drawn from the five numbers in the list, so you can work from the list. The weights, in pounds, are: minimum 29, first quartile 31, median 42, third quartile 73, maximum 98. You need the one statement that is true. So check each choice.
Find the interquartile range
The interquartile range is 42 pounds. That makes choice C, which says 11, false.
Compare the IQR with the median
The median is 42 pounds. The interquartile range is also 42 pounds. They are equal, so statement D is true.
Watch out: 42 − 31 = 11 subtracts Q1 from the median, not from Q3. That mistake makes choice C look right.
Test the ends for outliers
An outlier would be below −32 or above 136. The minimum, 29, is not below −32. The maximum, 98, is not above 136. So A and B are false. Watch out: 98 looks far away, but not far enough to be an outlier.
Choose the answer
Only statement D is supported by the five numbers. So the answer is D, the interquartile range and the median are equal.
Check your answer
Check the subtraction by adding back: , which is Q3. The median, 42, sits inside the box, between 31 and 73, as it must. The two measures mean different things, but here they happen to be the same number.
More questions like this
The original DOE question
Question 7 of 10
2023 Test A Math, question 51Question
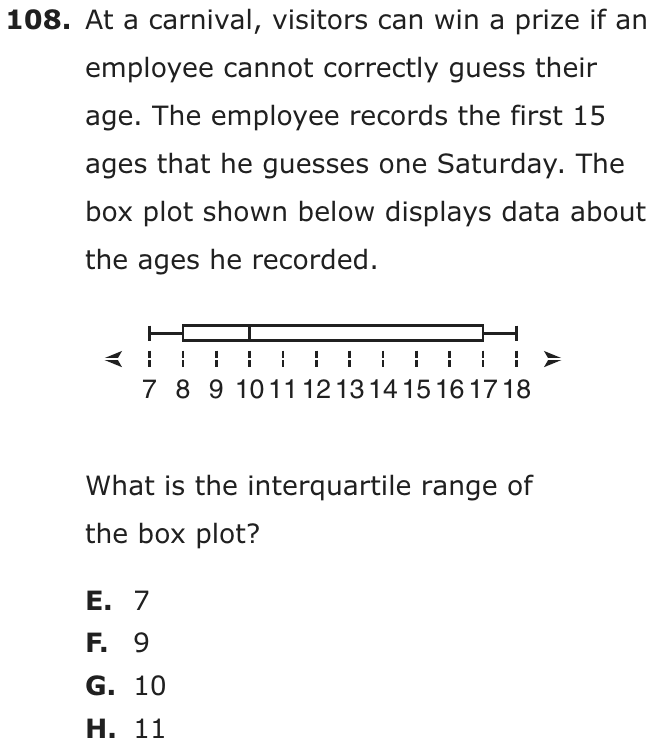
At a carnival, visitors can win a prize if an employee cannot correctly guess their age. The employee records the first 15 ages that he guesses one Saturday. The box plot shown below displays data about the ages he recorded.

What is the interquartile range of the box plot?
- A7
- B9
- C10
- D11
Show the answer
Correct answer: B
Quartile 1 is the median of the lower half of the data, 8.
Quartile 3 is the median of the upper half of the data, 17.
The interquartile range is 9.
Question analysis
This statistics question shows a box plot of 15 ages that a carnival employee guessed and asks for its interquartile range. Students read the quartiles from the edges of the box and subtract. Confusing the interquartile range with the full range, or using the median line in place of a quartile, gives the wrong choices.
- NYS standards
- 7.SP.1 box plots and interquartile range
- Grade level
- Grade 7 content, by NYS standard
- Compared with grade 7
- At grade 7 Reading a box plot and finding its interquartile range is a grade 7 standard in New York. The values sit on labeled whole-number ticks and one subtraction is needed, a routine grade 7 task once the box's edges are known as the quartiles.
- Estimated difficulty
- Straightforward: two steps or one careful reading.
- Thinking it demands
- Depth of knowledge 2, skills and concepts · mainly apply
- What makes it hard
- Solution
- 2 steps
- Reading level
- Question and choices: about grade 6, 48 words.
- Students, last 30 days
- Not enough answers yet to show (it takes 10).
Why it is hard, traps and wrong answers (shows the answer)
Why it is hard
The arithmetic is one subtraction, so the question tests whether students know which parts of a box plot to use. The whiskers' ends give the range, the line inside the box gives the median, and both are easy to grab in place of the quartiles. The story about the carnival and the 15 ages plays no part in the answer.
Something you must already know minor Working it out
The plot shows five values with no labels, so students must know that the box's ends mark the quartiles and that the interquartile range is the box's width, not the whiskers'. (Anderson & Krathwohl, 2001)
Reading a figure, table or graph minor Understanding the question
The values 7, 8, 10, 17 and 18 are read off a scale ticked at every whole number, with the box's ends at 8 and 17 and the median line at 10. (Lesh, Post & Behr, 1987; Kirsch & Mosenthal, 1990)
Strategy: Find the first and third quartiles on the plot by recalling which parts of a box plot mark them, then subtract the smaller quartile from the larger.
Traps
- Wrong formula: Uses a related but wrong formula: perimeter for area, diameter for radius, area for volume, or a misremembered one.
- Misunderstands the concept: A wrong belief about a concept: that percents can be added, that area grows like length, that averages can be averaged, that a bigger denominator means a bigger fraction.
- Information you don't need: The question gives numbers or facts that play no part in the answer.
The wrong answers, classified
A Wrong formula (King et al., 2004)
Subtracts the median from the third quartile, 17 − 10 = 7, measuring only the part of the box right of the middle line.
C Misunderstands the concept (Smith, diSessa & Roschelle, 1993; De Bock et al., 1998; Ni & Zhou, 2005)
Gives the median, 10, read off the line inside the box, taking a single value on the plot for the spread between the quartiles.
D Wrong formula (King et al., 2004)
Subtracts the minimum from the maximum, 18 − 7 = 11, which is the range shown by the whiskers, not the width of the box.
Worked solution, step by step
Formulas used
- Interquartile range
- Q1, the first quartile, is the middle of the lower half of the data. Q3, the third quartile, is the middle of the upper half. In a box plot, Q1 is the left end of the box and Q3 is the right end. So the IQR is the width of the box.
Sort out the question
A box plot shows five numbers. The whiskers, the lines sticking out, end at the smallest and largest values. The box covers the middle half of the data. The line inside the box is the median, the middle value. You need the interquartile range of the ages.
Read the five numbers
Read each one off the number line below the plot.
- Smallest age, the left whisker: 7
- Q1, the left end of the box: 8
- Median, the line inside the box: 10
- Q3, the right end of the box: 17
- Largest age, the right whisker: 18
Find the interquartile range
The interquartile range is 9 years. Watch out: 18 − 7 = 11 is the range, the whole spread from whisker to whisker. That is choice D. The median, 10, is choice C.
So the answer is B, 9.
Check your answer
Count the spaces across the box. From 8 to 17 there are 9 spaces of 1 year each, so the box is 9 years wide. The answer is also less than the whole range, 11, as it must be.
More questions like this
The original DOE question
Question 8 of 10
2023 Test B Math, question 10Question
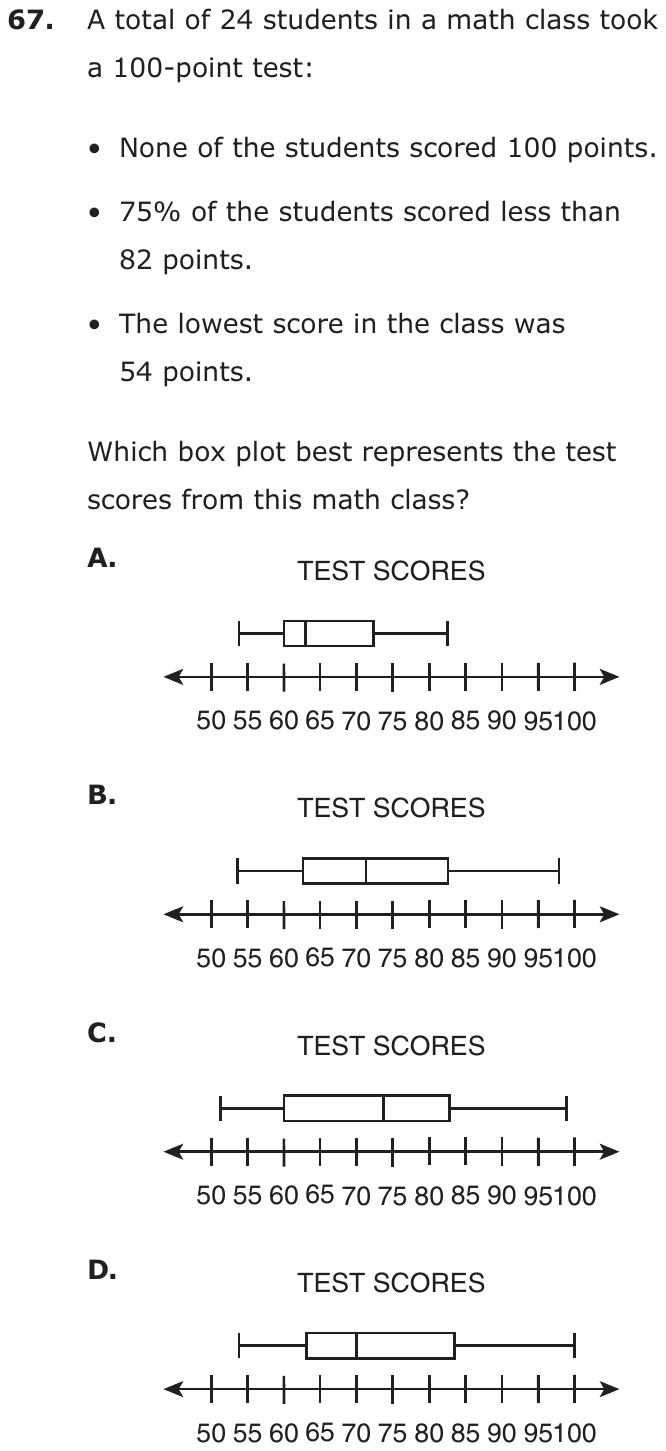
A total of 24 students in a math class took a 100-point test:
- None of the students scored 100 points.
- 75% of the students scored less than 82 points.
- The lowest score in the class was 54 points.
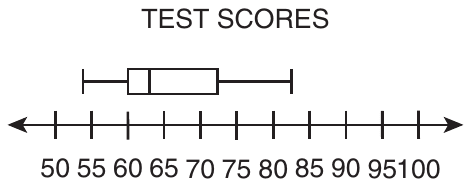
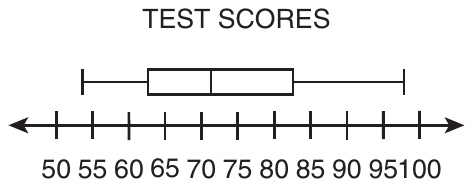
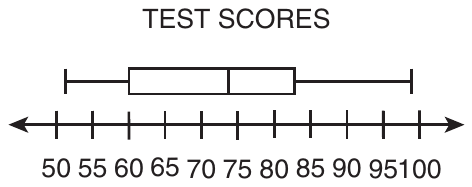
Which box plot best represents the test scores from this math class?
- A
- B
- C
- D
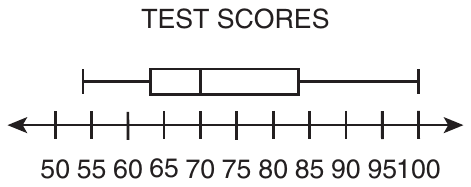
Show the answer
Correct answer: B
Use the information in the bullet points to reason which box plot could represent the data set of test scores.
Since none of the students scored 100, the maximum value on the box plot must be less than 100.
If 75% of the students scored less than 82, then 25% scored 82 points or more. Since the third quartile (Q3) indicates (75%) of the data is to the left and (25%) of the data is to the right, it is reasonable that Q3 would be at or about 82.
Given that the lowest score in the class was 54, the minimum point on the box plot must be 54.
The box plot graph in option B is the only one that meets all three criteria.
Question analysis
Twenty-four students took a 100-point test: nobody scored 100, 75% scored below 82, and the lowest score was 54. Students choose the box plot that fits all three facts. The skill is linking each statement to a part of the plot, the whiskers, the box and the quartiles, and checking every plot closely.
- NYS standards
- 7.SP.1 box plots and interquartile range
- Grade level
- Grade 7 content, by NYS standard
- Compared with grade 7
- At grade 7 Grade 7 students usually read values off a box plot. This item runs the other way, turning a percent statement into a quartile and checking the whiskers against two more facts, but the content stays at grade 7.
- Estimated difficulty
- Moderate: several steps, or a close reading with one strong distractor.
- Thinking it demands
- Depth of knowledge 2, skills and concepts · mainly analyze
- What makes it hard
- Every choice must be checked moderate
- Reading a figure, table or graph moderate
- Something you must already know minor
- Solution
- 3 steps
- Reading level
- Question and choices: about grade 2, 45 words.
- Students, last 30 days
- Not enough answers yet to show (it takes 10).
Why it is hard, traps and wrong answers (shows the answer)
Why it is hard
The question turns three sentences into three features of a box plot, and a plot that matches two of them is easy to accept. The upper-quartile fact is the conceptual one: students who do not know that the box’s right edge marks 75 percent put 82 at the end of the whisker. The other two facts are quick visual checks, but only if every plot is actually checked.
Every choice must be checked moderate Choosing the answer
Each wrong plot fails a different fact, so all four must be tested against all three bullets: the left whisker against 54, the right whisker against 100, and the box’s right edge against 82. (Embretson & Wetzel, 1987)
Reading a figure, table or graph moderate Understanding the question
The axis is labeled every 5 points, and the deciding features fall between labels: one left whisker starts near 51 instead of 54, and box edges sit near 82.5. (Lesh, Post & Behr, 1987; Kirsch & Mosenthal, 1990)
Something you must already know minor Working it out
Nothing explains that “75% of the students scored less than 82” locates the upper quartile, the right edge of the box, rather than the highest score. (Anderson & Krathwohl, 2001)
Strategy: Turn each fact into a feature to check: where the left whisker starts, where the right whisker ends, and where the box ends. Rule out any plot that breaks one.
Traps
- Misreads the question: Misses or misreads a condition or a word in the question: "at least", "each", "remaining", "not".
- Misunderstands the concept: A wrong belief about a concept: that percents can be added, that area grows like length, that averages can be averaged, that a bigger denominator means a bigger fraction.
- Misreads the figure: Reads a value, label or tick spacing in a figure, table or graph wrongly.
The wrong answers, classified
A Misunderstands the concept (Smith, diSessa & Roschelle, 1993; De Bock et al., 1998; Ni & Zhou, 2005)
Puts 82 at the end of the right whisker, as if it were the highest score, when 75 percent below 82 marks the box’s right edge.
C Misreads the figure (Lesh, Post & Behr, 1987; Kirsch & Mosenthal, 1990)
Accepts the left whisker as starting at the lowest score, 54, when it begins near 51, just past the 50 tick.
D Misreads the question (Hegarty, Mayer & Monk, 1995)
Matches the lowest score and the box’s right edge near 82 but overlooks that a whisker reaching 100 means someone scored 100.
Worked solution, step by step
Formulas used
- Parts of a box plot
- A box plot shows five numbers. The left whisker starts at the minimum, the lowest value. The box starts at Q1, the first quartile, and ends at Q3, the third quartile. The line inside is the median, the middle value. The right whisker ends at the maximum. About a quarter of the data falls in each of the four sections.
Sort out the question
24 students took a test. You know three facts. Nobody scored 100. 75% scored less than 82. The lowest score was 54. You need the box plot that fits all three facts.
Turn each fact into a feature
Match each fact to a part of the box plot.
- The lowest score is 54, so the left whisker starts at 54.
- Nobody scored 100, so the right whisker ends before 100.
- 75% is three quarters. Three quarters of the scores are below Q3. So the box should end at about 82.
Read the number line
The ticks are 5 points apart: 50, 55, 60 and so on. A score of 54 sits just left of the 55 tick. A score of 82 sits a little less than halfway from 80 to 85. Look closely, because these points fall between labels.
Check plot A
In plot A, the right whisker ends near 82, and the box ends near 72. That would make 82 the highest score. Watch out: 75% below 82 does not make 82 the top score. It tells you where the box ends. So A is out.
Check plot C
In plot C, the left whisker starts near 51, just right of the 50 tick. But the lowest score was 54. So C is out.
Check plot D
Plot D starts at 54, and its box ends near 82. But its right whisker reaches 100. That means someone scored 100, and nobody did. Watch out: D fits two facts, so it is easy to stop early. Check all three. So D is out.
Check plot B and answer
Plot B starts at 54. Its box ends near 82. Its right whisker stops near 98, below 100. It fits all three facts. So the answer is B.
Check your answer
Go over B once more with all three facts. Its lowest point is 54. Its box ends near 82. Its highest point is under 100. Each other plot breaks one fact: A’s box, C’s left whisker and D’s right whisker.
More questions like this
The original DOE question
Question 9 of 10
2023 Test B Math, question 22Question
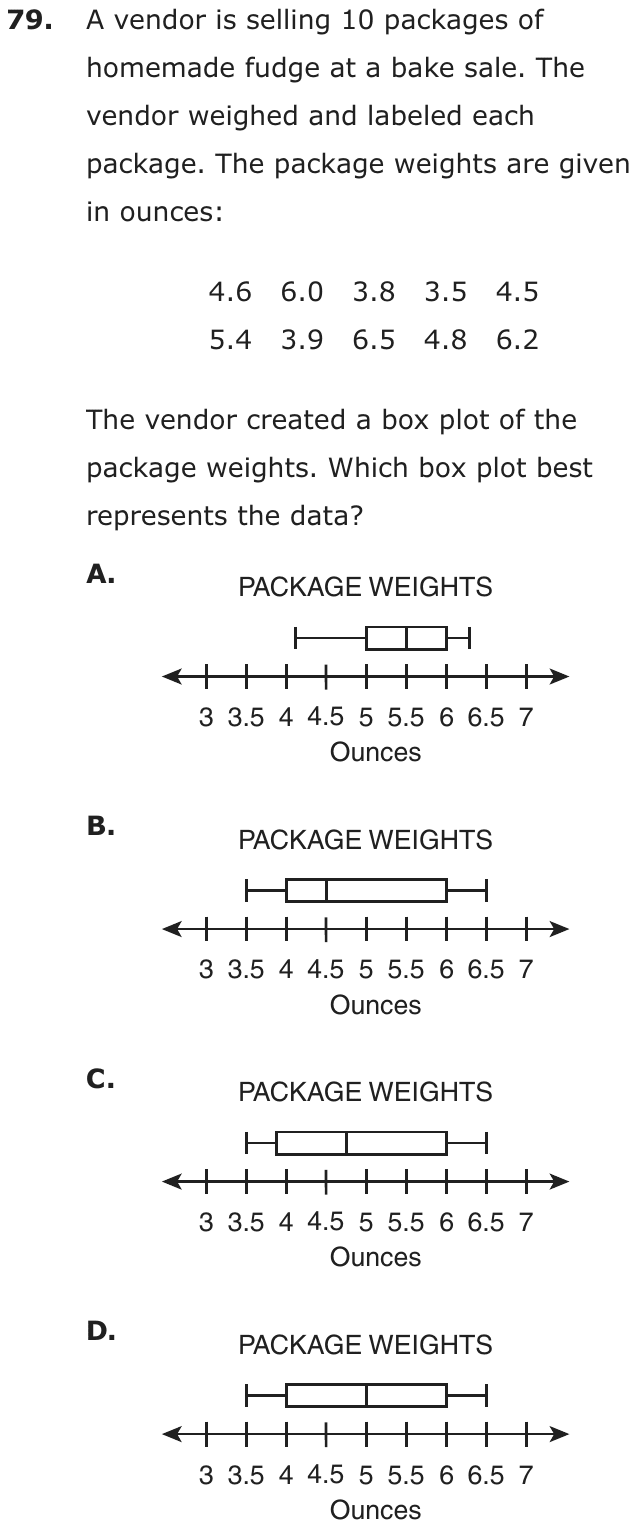
A vendor is selling 10 packages of homemade fudge at a bake sale. The vendor weighed and labeled each package. The package weights are given in ounces:
| 4.6 | 6.0 | 3.8 | 3.5 | 4.5 |
| 5.4 | 3.9 | 6.5 | 4.8 | 6.2 |
The vendor created a box plot of the package weights. Which box plot best represents the data?
- A
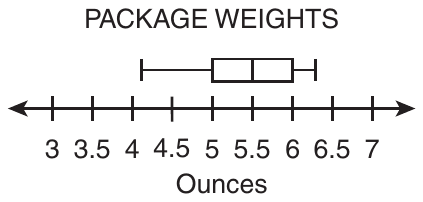
- B
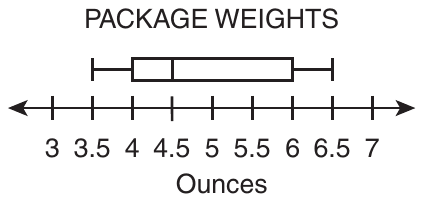
- C
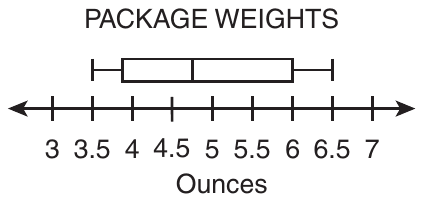
- D
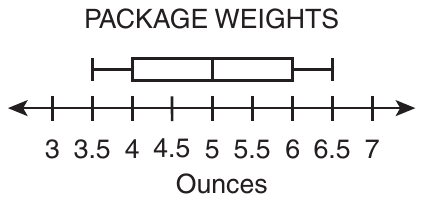
Show the answer
Correct answer: C
A set of 10 data points is given. The first step for determining the quartiles and minimum and maximum values of the box plot is to order the data from smallest to greatest value. For this data set the order is:
| 3.5 | 3.8 | 3.9 | 4.5 | 4.6 |
| 4.8 | 5.4 | 6.0 | 6.2 | 6.5 |
The minimum value is the smallest decimal, 3.5, and the maximum value is the greatest decimal, 6.5.
To determine the median in a set with an even number of values, locate the two middle values (5th and 6th in this case): 4.6 and 4.8. Determine the mean, or average, of the two middle numbers by adding them together and dividing the sum by 2:
To determine the value of the first quartile (Q1), locate the middle value of the 5 terms to the left of the median:
| 3.5 | 3.8 | 3.9 | 4.5 | 4.6 |
To determine the value of the third quartile (Q3), locate the middle value of the 5 terms to the right of the median:
| 4.8 | 5.4 | 6.0 | 6.2 | 6.5 |
Box plot C identifies the correct minimum, maximum, median, and quartiles of the data set.
Question analysis
A vendor weighs 10 packages of homemade fudge, from 3.5 to 6.5 ounces, and makes a box plot of the weights. Students choose the box plot that matches the data. They must sort the decimals, find the median of an even number of values and both quartiles, then compare plots that differ only slightly.
- Grade level
- Grade 7 content, by NYS standard
- Compared with grade 7
- Above grade 7 Building a box plot from data is grade 7 content. This version needs all five summary values from ten unsorted decimals, including a median between two values, then a close comparison of plots, longer and finer than typical.
- Estimated difficulty
- Hard: combines ideas, needs a plan, and has more than one tempting wrong answer.
- Thinking it demands
- Depth of knowledge 2, skills and concepts · mainly apply
- What makes it hard
- Many steps moderate
- A very close wrong answer moderate
- Reading a figure, table or graph moderate
- Slow to do carefully minor
- Solution
- 4 steps
- Reading level
- Question and choices: about grade 4, 43 words.
- Students, last 30 days
- Not enough answers yet to show (it takes 10).
Why it is hard, traps and wrong answers (shows the answer)
Why it is hard
Most of the work happens before the plots are even read: the weights must be sorted, and the median of ten values is the average of two of them. After that, three plots look almost identical, so a careless median, taken from the unsorted list or placed halfway between the extremes, settles on a wrong one. The careful student checks the median line and the box’s left edge against values that fall between the tick marks.
Many steps moderate Working it out
Ten unsorted decimals must be ordered, then five values found: the median as the mean of the fifth and sixth, 4.6 and 4.8, and each quartile as the middle of its half. (Daniel & Embretson, 2010; Enright, Morley & Sheehan, 2002)
A very close wrong answer moderate Choosing the answer
Three plots share whiskers at 3.5 and 6.5 and a box ending at 6; they differ only in the median line, at 4.5, near 4.75 or at 5, and in where the box starts. (Embretson & Wetzel, 1987; Gorin & Embretson, 2006; Ascalon et al., 2007)
Reading a figure, table or graph moderate Understanding the question
The axis is ticked every half ounce, and the correct plot’s median, 4.7, and lower quartile, 3.9, both fall between ticks, so each line’s position must be judged by eye. (Lesh, Post & Behr, 1987; Kirsch & Mosenthal, 1990)
Slow to do carefully minor Choosing the answer
Sorting ten decimals, computing a five-number summary and comparing four plots takes well over a minute and a half when done carefully. (Lu & Sireci, 2007)
Strategy: Sort the ten weights, then find the least and greatest, the median as the mean of the fifth and sixth values, and each quartile as the middle of its half.
Traps
- Wrong formula: Uses a related but wrong formula: perimeter for area, diameter for radius, area for volume, or a misremembered one.
- A faulty procedure: A systematic but wrong procedure: adding fractions straight across, applying an exponent to each term of a sum, dropping a sign when moving a term.
The wrong answers, classified
A Little reason to choose it (Haladyna & Downing, 1993; Rodriguez, 2005)
No working from these weights gives whiskers near 4.1 and 6.3 or a median of 5.5, since the data run from 3.5 to 6.5, so it mostly draws guesses.
B A faulty procedure (Brown & Burton, 1978; Tatsuoka, 1983)
Skips sorting and takes 4.5, the fifth weight as printed, for the median, so the plot with its median line on 4.5 seems to fit.
D Wrong formula (King et al., 2004)
Finds the median with the midrange formula, (3.5 + 6.5) ÷ 2 = 5, halfway between the lightest and heaviest packages instead of the middle of the sorted weights.
Worked solution, step by step
Formulas used
- Median of an even number of values
- First put the values in order. With an even number of values, two sit in the middle. The median is their mean, or average: add them and divide by 2. The median splits the data in half.
- Quartiles
- Q1 is the first quartile and Q3 is the third quartile. Split the ordered data in half at the median. Q1 is the middle of the lower half, and Q3 is the middle of the upper half. A box plot’s box runs from Q1 to Q3.
Sort out the question
The vendor weighed 10 packages of fudge, in ounces. You need the box plot that matches the weights. A box plot is built from five numbers. They are the minimum (least), the first quartile Q1, the median, the third quartile Q3 and the maximum (greatest). So find those five numbers first.
Put the weights in order
List the 10 weights from least to greatest.
3.5 3.8 3.9 4.5 4.6 4.8 5.4 6.0 6.2 6.5 Watch out: you must sort first. The fifth weight as printed is 4.5. Using it as the median points to choice B.
Find the least and greatest
The minimum is 3.5 ounces and the maximum is 6.5 ounces. So the whiskers must run from 3.5 to 6.5. Plot A’s whiskers run from about 4.1 to about 6.3, so A is out.
Find the median
With 10 weights, the two middle ones are the 5th and 6th: 4.6 and 4.8.
The median is 4.7 ounces. Watch out: the median is not halfway between the least and greatest. That gives and points to choice D.
Find the two quartiles
The lower half is the 5 weights below the median: 3.5, 3.8, 3.9, 4.5 and 4.6. Its middle value is .
The upper half is the 5 weights above the median: 4.8, 5.4, 6.0, 6.2 and 6.5. Its middle value is .
Match the summary to a plot
The five numbers are 3.5, 3.9, 4.7, 6.0 and 6.5. Plots B, C and D all run from 3.5 to 6.5, and their boxes end at 6. They differ in the median line and where the box starts.
- B: the box starts at 4, and the median line is at 4.5.
- D: the box starts at 4, and the median line is at 5.
- C: the box starts just left of 4, and the median line is between 4.5 and 5.
C is the closest match to a Q1 of 3.9 and a median of 4.7. So the answer is C.
Check your answer
A median splits the data in half. Five weights, 3.5 to 4.6, are below 4.7. Five, 4.8 to 6.5, are above it. A median line at 5, as in D, would have six weights below it. A line at 4.5, as in B, would have only three below it.
More questions like this
The original DOE question
Question 10 of 10
2023 Test B Math, question 26Question
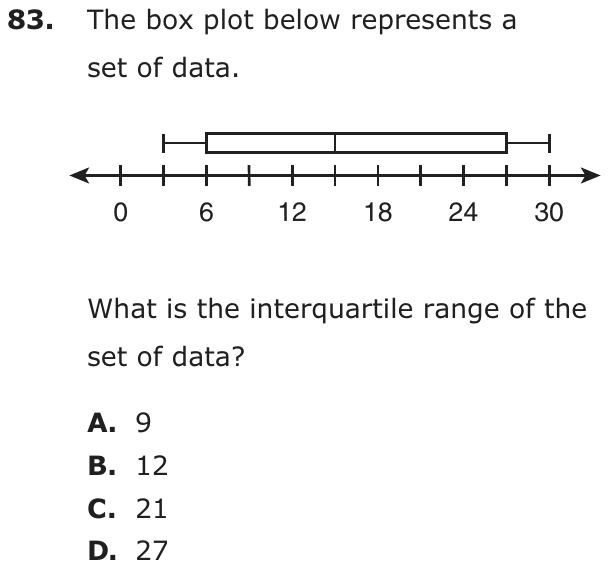
The box plot below represents a set of data.

What is the interquartile range of the set of data?
- A9
- B12
- C21
- D27
Show the answer
Correct answer: C
First, determine the values of the upper and lower quartiles of the set of data:
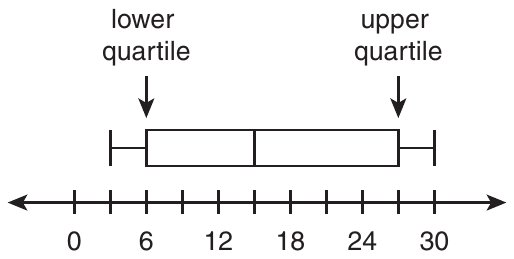
- The upper quartile value is indicated by the vertical line segment at the far right edge of the box plot above the hash mark representing 27.
- The lower quartile value is indicated by the vertical line segment at the far left edge of the box plot above the hash mark representing 6.
To determine the interquartile range, subtract the lower quartile value (6) from the upper quartile value (27):
Question analysis
A box plot on a number line marked every 3 units, with labels every 6, represents a set of data. Students find the interquartile range. They have to read the two ends of the box, one of which falls on an unlabeled tick, and remember exactly which part of the plot the interquartile range measures.
- NYS standards
- 7.SP.1 box plots and interquartile range
- Grade level
- Grade 7 content, by NYS standard
- Compared with grade 7
- At grade 7 Finding the interquartile range from a box plot is a grade 7 skill, and this is a typical example. Read two values and subtract; the only extra care is a box edge that falls on a tick with no label.
- Estimated difficulty
- Straightforward: two steps or one careful reading.
- Thinking it demands
- Depth of knowledge 1, recall and reproduction · mainly apply
- What makes it hard
- Solution
- 2 steps
- Reading level
- Question and choices: about grade 6, 19 words.
- Students, last 30 days
- Not enough answers yet to show (it takes 10).
Why it is hard, traps and wrong answers (shows the answer)
Why it is hard
Once the two edges of the box are read, one subtraction finishes the question, so the work is reading the scale and knowing which part of the plot is meant. The upper quartile falls on an unlabeled tick, which costs care. The wrong answers measure the whole spread or only half of the box, all common mix-ups of what the interquartile range covers.
Reading a figure, table or graph moderate Understanding the question
The axis is labeled only every 6 units but ticked every 3, and the box’s right edge sits on the unlabeled tick for 27, so it has to be counted from 24. (Lesh, Post & Behr, 1987; Kirsch & Mosenthal, 1990)
Something you must already know minor Working it out
Nothing defines the interquartile range; it is the width of the box, the upper quartile minus the lower, not the span of the whiskers. (Anderson & Krathwohl, 2001)
Strategy: Find the values at the left and right edges of the box, counting tick marks in steps of 3 where there is no label, and subtract the smaller from the larger.
Traps
- Wrong formula: Uses a related but wrong formula: perimeter for area, diameter for radius, area for volume, or a misremembered one.
The wrong answers, classified
A Wrong formula (King et al., 2004)
Gives the median minus the lower quartile, 15 − 6 = 9, as the interquartile range, measuring only the left part of the box.
B Wrong formula (King et al., 2004)
Gives the upper quartile minus the median, 27 − 15 = 12, as the interquartile range, measuring only the right part of the box.
D Wrong formula (King et al., 2004)
Subtracts the ends of the whiskers, 30 − 3 = 27, giving the range of the data instead of the interquartile range.
Worked solution, step by step
Formulas used
- Interquartile range
- IQR stands for interquartile range. Q3, the third quartile, is the right edge of a box plot’s box. Q1, the first quartile, is the left edge. Subtracting gives the width of the box, where the middle half of the data lies.
Sort out the question
You see a box plot and need the interquartile range, or IQR. That is the width of the box: the upper quartile minus the lower quartile. The whiskers don’t matter here.
Read the number line
The labels are 0, 6, 12, 18, 24 and 30. But there is a tick mark halfway between each pair of labels. So the ticks go up by 3: 0, 3, 6, 9 and so on. The tick between 24 and 30 stands for 27.
Find the edges of the box
The left edge of the box is at 6. That is the lower quartile, Q1. The right edge is at the unlabeled tick after 24, which is 27. That is the upper quartile, Q3.
Subtract to find the IQR
Watch out: uses the ends of the whiskers. That is the range, choice D. Also, the median line at 15 splits the box. and are each only part of the box. So the answer is C, 21.
Check your answer
Count the tick spaces across the box, from 6 to 27. There are 7 spaces, and each is worth 3. So the box is units wide. That matches.
More questions like this
The original DOE question