6.SP.5a number of observations
Question 1 of 7
2024 Test A Math, question 5Question
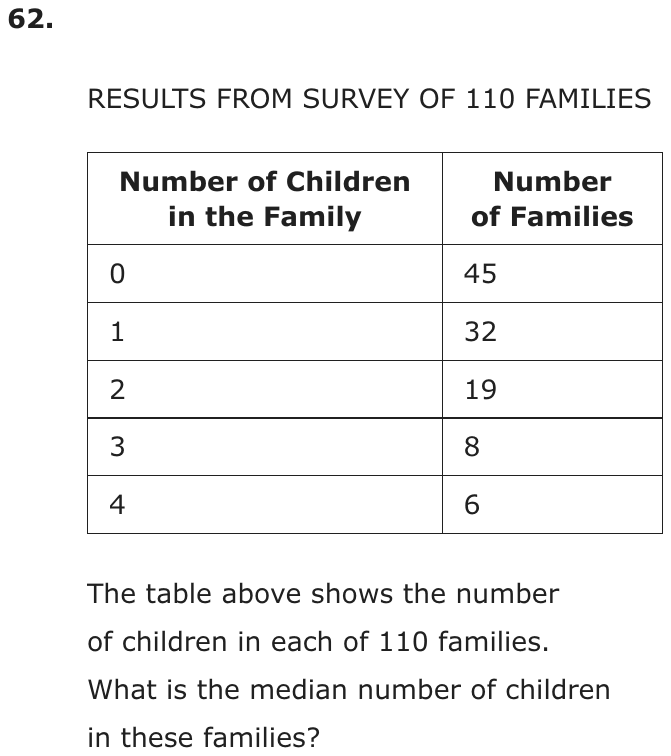
RESULTS FROM SURVEY OF 110 FAMILIES
| Number of Children in the Family | Number of Families |
|---|---|
| 0 | 45 |
| 1 | 32 |
| 2 | 19 |
| 3 | 8 |
| 4 | 6 |
The table above shows the number of children in each of 110 families. What is the median number of children in these families?
Grid-in question: work out the answer and enter it as a number.
Show the answer
Correct answer: 1
Since 110 families were surveyed, the median will have 55 values less than or equal to it, and 55 values greater than or equal to it.
If the values in the table were listed in order, they would look like this:
The first row of the table indicates that 45 families had 0 children.
The second row of the table indicates that 32 families had 1 child.
So 77 families had either 0 children or 1 child, and 45 families had 0 children.
Since 55 is between 45 and 77, the median must be a value in the second row of the table.
So the median is 1.
Question analysis
This statistics grid-in gives a frequency table from a survey of 110 families, showing how many families have each number of children from none to four. Students find the median number of children per family. The table lists counts rather than the 110 data values themselves, so locating the middle value takes a running total of the families.
- Grade level
- Grade 6 content, by NYS standard
- Compared with grade 7
- Above grade 7 Grade 7 median problems usually list a dozen or so values. Here 110 values are hidden in a frequency table, so students must reason about positions with a running count, a less familiar and more error-prone task.
- Estimated difficulty
- Hard: combines ideas, needs a plan, and has more than one tempting wrong answer.
- Thinking it demands
- Depth of knowledge 2, skills and concepts · mainly apply
- What makes it hard
- Reading a figure, table or graph major
- No obvious method moderate
- An answer in an unexpected form minor
- Solution
- 3 steps
- Reading level
- Question and choices: about grade 7, 35 words.
- Students, last 30 days
- Not enough answers yet to show (it takes 10).
Why it is hard, traps and wrong answers (shows the answer)
Why it is hard
Students know a median as the middle of a list, but here the list is never written out. Treating the table's columns as the data gives quick, confident answers, 2 from the middle of the children column or 19 from the middle of the family counts, and neither can be checked against choices. The question rewards counting positions: 45 families have no children, so the 55th and 56th families both fall among the 32 with one child.
Reading a figure, table or graph major Understanding the question
The table hides 110 data values in five rows: the 0 to 4 column lists the possible values, and 45, 32, 19, 8 and 6 say how many families have each. (Lesh, Post & Behr, 1987; Kirsch & Mosenthal, 1990)
No obvious method moderate Working it out
The median of 110 values lies between the 55th and 56th; finding them takes a running count of families, 45 and then 77, a method seldom practiced with tables. (Schoenfeld, 1985)
An answer in an unexpected form minor Choosing the answer
As a grid-in there are no choices to compare, so a student who takes the middle row's 2 has nothing on the page to suggest it is wrong. (Enright, Morley & Sheehan, 2002)
Strategy: With 110 values the median sits between the 55th and 56th; add the family counts row by row until the running total passes 55, and read that row's number of children.
Traps
- Misunderstands the concept: A wrong belief about a concept: that percents can be added, that area grows like length, that averages can be averaged, that a bigger denominator means a bigger fraction.
- Answers a different question: A choice is right for another quantity: the other unknown, the rest instead of the part, the part instead of the whole.
The wrong answers, classified
2 Misunderstands the concept (Smith, diSessa & Roschelle, 1993; De Bock et al., 1998; Ni & Zhou, 2005)
Takes the middle entry of the children column, 0 to 4, ignoring that each number of children belongs to a different number of families.
19 Answers a different question (King et al., 2004; Hegarty, Mayer & Monk, 1995)
Finds the median of the Number of Families column, 6, 8, 19, 32 and 45, a middle family count rather than a number of children.
1.07 Answers a different question (King et al., 2004; Hegarty, Mayer & Monk, 1995)
Computes the mean instead, 118 children among 110 families, about 1.07, a different measure of center from the median asked for.
Worked solution, step by step
Formulas used
- Spot of the median
- The median is the middle value when all the values are put in order. n is how many values there are. This gives the spot of the middle value, with the same number of values before and after it. If it ends in a half, the median is halfway between the two values on either side.
Sort out the table
The table covers 110 families. The left column is a number of children. The right column says how many families have that many children. For example, 45 families have 0 children. You need the median number of children. The median is the middle value when all the values are in order.
Picture the values in order
Think of a list with one number for each family: how many children it has. The list has 45 zeros, then 32 ones, then 19 twos, then 8 threes, then 6 fours. It is already in order, from least to most.
There are 110 values. Watch out: the median is not the middle row, 2. Each row stands for a different number of families.
Find the middle spot
Use the median rule with n = 110.
The middle is halfway between the 55th and 56th values. So you need those two values in the list.
Count down the list
Keep a running total of families, row by row. The zeros fill spots 1 to 45. Now add the 32 families with 1 child.
So the ones fill spots 46 to 77. Spot 55 and spot 56 are both in that range. So both values are 1.
Give the median
The 55th and 56th values are both 1. Halfway between 1 and 1 is 1. So the median is 1 child. Watch out: the median is a number of children, not of families. Gridding 19, from the families column, is wrong. So is the mean, or average, which is about 1.07. So you would grid 1.
Check your answer
Half of 110 is 55. Families with 0 children: 45, which is less than half. So the median is not 0. Families with 0 or 1 child: 77, which is more than half. So the median is not more than 1. It must be 1.
More questions like this
The original DOE question
Question 2 of 7
2024 Test A Math, question 28Question
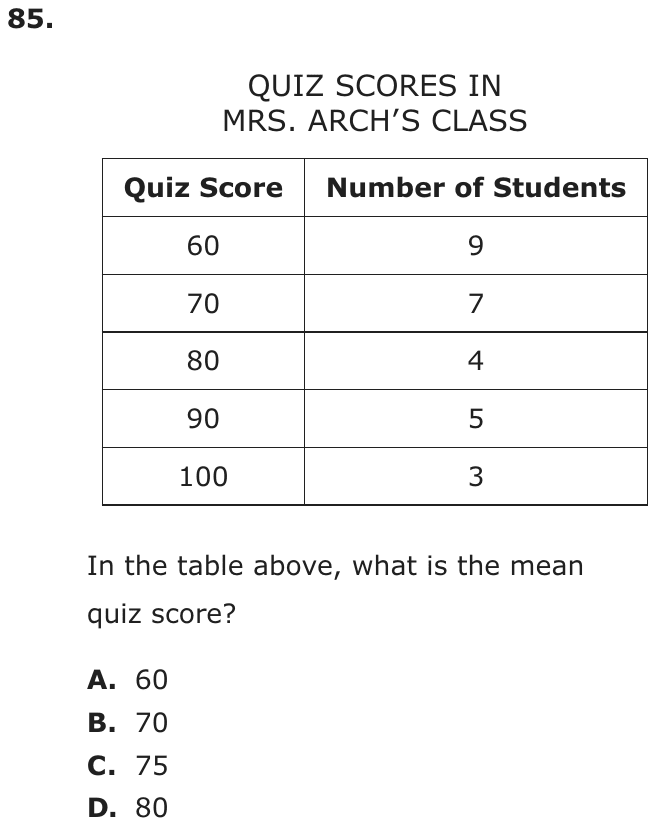
QUIZ SCORES IN
MRS. ARCH’S CLASS
| Quiz Score | Number of Students |
|---|---|
| 60 | 9 |
| 70 | 7 |
| 80 | 4 |
| 90 | 5 |
| 100 | 3 |
In the table above, what is the mean quiz score?
- A60
- B70
- C75
- D80
Show the answer
Correct answer: C
First, find the total number of students who took the quiz.
Multiply each quiz score by the number of students who received that score. Add those products together to find the total number of points scored.
To find the mean quiz score, divide the total number of points by the number of students who took the quiz.
Question analysis
A frequency table question: the table lists five quiz scores from 60 to 100 and how many students in Mrs. Arch's class earned each. Students find the mean quiz score for the whole class. Each score has to count once for every student who earned it, and the class size has to be added up from the table.
- Grade level
- Grade 6 content, by NYS standard
- Compared with grade 7
- At grade 7 A mean from a frequency table is grade 6 content in a three-step form that grade 7 students meet regularly. Five rows of products make it slightly longer than a typical exercise, but the arithmetic is friendly.
- Estimated difficulty
- Moderate: several steps, or a close reading with one strong distractor.
- Thinking it demands
- Depth of knowledge 2, skills and concepts · mainly apply
- What makes it hard
- Reading a figure, table or graph moderate
- Many steps minor
- Error-prone arithmetic minor
- Solution
- 3 steps
- Reading level
- Question and choices: about grade 2, 19 words.
- Students, last 30 days
- Not enough answers yet to show (it takes 10).
Why it is hard, traps and wrong answers (shows the answer)
Why it is hard
The table invites a shortcut: average the five scores in the first column and get a round number that is a choice. That ignores the fact that more students earned the low scores than the high ones, which pulls the true mean down. Weighting each score by its count is a five-row calculation with friendly numbers, and the other choices catch students who confuse the mean with the most common or the middle score.
Reading a figure, table or graph moderate Understanding the question
Each row of the table stands for several students, 9 with 60, 7 with 70 and so on, so a score counts once per student and the class size, 28, must be added up. (Lesh, Post & Behr, 1987; Kirsch & Mosenthal, 1990)
Many steps minor Working it out
Five products, 540, 490, 320, 450 and 300, must be found and added to 2,100 before dividing by the 28 students. (Daniel & Embretson, 2010; Enright, Morley & Sheehan, 2002)
Error-prone arithmetic minor Working it out
The last step, 2,100 ÷ 28, is not a familiar fact; noticing that 28 × 75 = 2,100, or testing the choices, keeps it quick. (Brown & Burton, 1978; Junker & Sijtsma, 2001)
Strategy: Multiply each score by its number of students, add the products for the total points, add the student counts, and divide the points by the students.
Traps
- Misunderstands the concept: A wrong belief about a concept: that percents can be added, that area grows like length, that averages can be averaged, that a bigger denominator means a bigger fraction.
- Answers a different question: A choice is right for another quantity: the other unknown, the rest instead of the part, the part instead of the whole.
The wrong answers, classified
A Answers a different question (King et al., 2004; Hegarty, Mayer & Monk, 1995)
Picks the score that the most students earned, 60, the mode of the class, instead of computing the mean.
B Answers a different question (King et al., 2004; Hegarty, Mayer & Monk, 1995)
Finds the median instead: in the ordered list of 28 scores, the 14th and 15th are both 70.
D Misunderstands the concept (Smith, diSessa & Roschelle, 1993; De Bock et al., 1998; Ni & Zhou, 2005)
Averages the five listed scores, (60 + 70 + 80 + 90 + 100) ÷ 5 = 80, without weighting each by its number of students.
Worked solution, step by step
Formulas used
- Mean from a table
- The mean is the average score. Total points is every student’s score added up. Each score in the table counts once for every student who got it. Number of students is how many took the quiz.
Sort out the table
The left column lists quiz scores. The right column says how many students got each score. For example, 9 students scored 60. You need the mean quiz score, which is the average.
Count the students
28 students took the quiz. So there are 28 scores in all, not just 5.
Find the total points
Each score counts once for each student who got it. So multiply each score by its number of students.
Score Students Points 60 9 70 7 80 4 90 5 100 3 The class scored 2,100 points in all.
Divide to find the mean
To divide, try . That leaves , and . So the mean is . Watch out: do not just average the five scores in the table. That gives 80, choice D. Also, 70 is the median and 60 is the most common score, choices B and A. So the answer is C, 75.
Check your answer
More students scored low, 60 or 70, than high. So the mean should be below 80, the middle of the listed scores. 75 is below 80. Also, , the total points.
More questions like this
The original DOE question
Question 3 of 7
2023 Test B Math, question 30Question
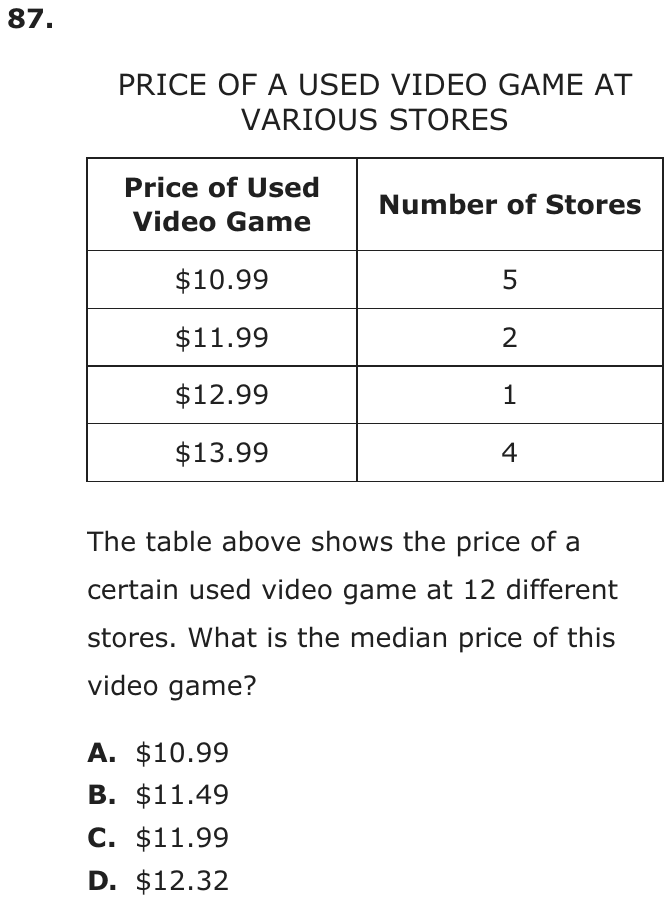
PRICE OF A USED VIDEO GAME AT VARIOUS STORES
| Price of Used Video Game | Number of Stores |
|---|---|
| $10.99 | 5 |
| $11.99 | 2 |
| $12.99 | 1 |
| $13.99 | 4 |
The table above shows the price of a certain used video game at 12 different stores. What is the median price of this video game?
- A$10.99
- B$11.49
- C$11.99
- D$12.32
Show the answer
Correct answer: C
There are 5 stores where the video game is priced at $10.99 and a total of 5 stores where it is priced at either $12.99 or $13.99, so the median price must be $11.99.
Question analysis
A statistics question with a table showing the price of a used video game at 12 stores, grouped by price, and asking for the median price. Students put the prices in order using the number of stores at each price and find the middle. The table gives counts rather than a list, so the position of the middle value has to be worked out from the running totals.
- Grade level
- Grade 6 content, by NYS standard
- Compared with grade 7
- At grade 7 Finding a median is grade 6 work that grade 7 students meet often. The twist is the frequency table: the 12 prices are not listed one by one, so students count positions instead of reading down a list.
- Estimated difficulty
- Straightforward: two steps or one careful reading.
- Thinking it demands
- Depth of knowledge 2, skills and concepts · mainly apply
- What makes it hard
- Solution
- 2 steps
- Reading level
- Question and choices: about grade 4, 40 words.
- Students, last 30 days
- Not enough answers yet to show (it takes 10).
Why it is hard, traps and wrong answers (shows the answer)
Why it is hard
The arithmetic is trivial once the positions are found: counting down 5 stores at $10.99 and then 2 at $11.99 puts both the 6th and 7th prices at $11.99. The wrong choices reward three different misreadings of a frequency table: the most common price, a middle pair one place too early, and the mean, which takes a long computation to reach. A student who writes the running totals 5, 7, 8 and 12 beside the table avoids all three.
Reading a figure, table or graph moderate Understanding the question
The 12 prices are never listed; the table gives four prices with store counts of 5, 2, 1 and 4, so the 6th and 7th prices must be found by a running count. (Lesh, Post & Behr, 1987; Kirsch & Mosenthal, 1990)
Something you must already know minor Working it out
With 12 values the median is the mean of the 6th and 7th in order, a rule the question assumes; here both fall in the $11.99 row, so no averaging is needed. (Anderson & Krathwohl, 2001)
Strategy: Keep a running total of the store counts down the table; with 12 prices in order, the median is the average of the 6th and 7th, so find the rows where they fall.
Traps
- Answers a different question: A choice is right for another quantity: the other unknown, the rest instead of the part, the part instead of the whole.
- Counting the ends: Inclusive or exclusive ends, fence posts, consecutive numbers: an answer that is one too many or too few, or an endpoint drawn open where it belongs closed (or the reverse).
The wrong answers, classified
A Answers a different question (King et al., 2004; Hegarty, Mayer & Monk, 1995)
Gives the mode, $10.99, the price that 5 stores charge, more than any other, instead of the middle price of the 12.
B Counting the ends (Brown & Burton, 1978)
Knows to average two middle prices but takes the 5th and 6th instead of the 6th and 7th, averaging $10.99 and $11.99 to get $11.49.
D Answers a different question (King et al., 2004; Hegarty, Mayer & Monk, 1995)
Computes the mean instead, $147.88 for all 12 prices divided by 12, about $12.32, a different measure of center from the median asked for.
Worked solution, step by step
Formulas used
- Median of an even number of values
- The median is the middle value when all the values are listed from least to greatest. With an even number of values, no single value sits in the middle. So take the two middle values and find their average: add them and divide by 2.
Sort out the table
Each row gives a price and how many stores charge it. For example, 5 stores charge $10.99. So $10.99 shows up 5 times in the list of prices. Add the stores to check the count.
There are 12 prices. You need the median. That is the middle price when the prices are in order from least to greatest.
Find the middle places
12 is an even number, so no single price sits in the middle. The two middle prices are the 6th and the 7th. Five prices come before the 6th one. Five prices come after the 7th one.
Count down the table
The table already lists the prices from least to greatest. Keep a running total of the stores. It shows which places in the list each price fills.
Price Stores Places in the list $10.99 5 1st to 5th $11.99 2 6th and 7th $12.99 1 8th $13.99 4 9th to 12th The 6th and 7th prices are both $11.99.
Find the median
Use the formula with the 6th and 7th prices.
The median price is $11.99.
Watch out: $10.99 is the mode, the price that shows up most often. That is choice A, not the median. Averaging the 5th and 6th prices gives $11.49, choice B. Adding all 12 prices and dividing by 12 gives the mean, about $12.32. That is choice D.
So the answer is C, $11.99.
Check your answer
Count the prices on each side of $11.99. Five stores charge less: the five at $10.99. Five stores charge more: one at $12.99 and four at $13.99. The two sides match, so $11.99 is in the middle.
More questions like this
The original DOE question
Question 4 of 7
2022 Test B Math, question 39Question
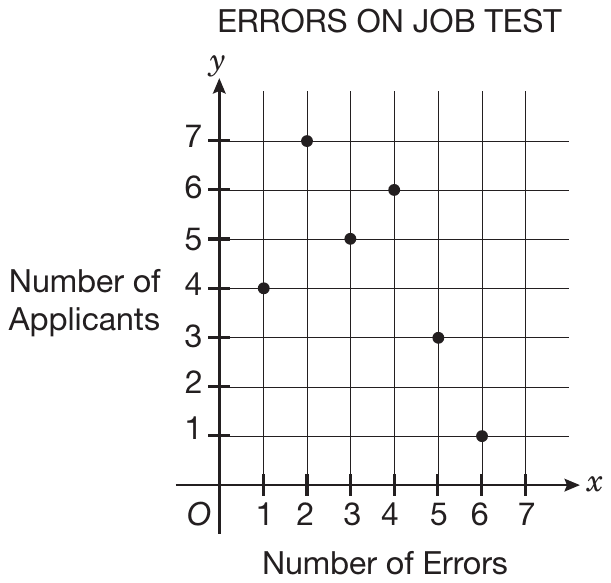
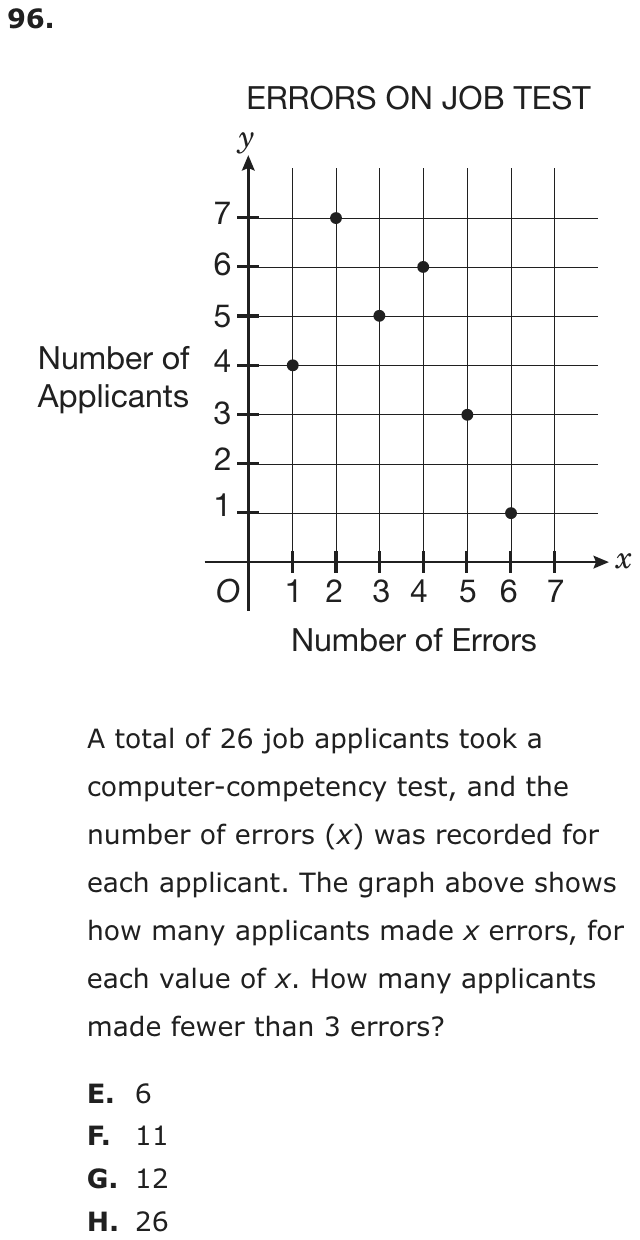
A total of 26 job applicants took a computer-competency test, and the number of errors (x) was recorded for each applicant. The graph above shows how many applicants made x errors, for each value of x. How many applicants made fewer than 3 errors?
- A6
- B11
- C12
- D26
Show the answer
Correct answer: B
Each (x, y) ordered pair represents y, the number of applicants that made x errors.
First, determine the points with x-values less than 3.
The point (1, 4) means that 4 applicants made 1 error.
The point (2, 7) means that 7 applicants made 2 errors.
Then, add the y-values to find the total applicants who made fewer than 3 errors.
Question analysis
A graph titled Errors on Job Test shows, for each number of errors, how many of 26 job applicants made that many. Students find how many applicants made fewer than 3 errors. It tests reading a data display in which each point's height is a count of people, and the words fewer than decide which points to use.
- Grade level
- Grade 6 content, by NYS standard
- Compared with grade 7
- Below grade 7 Reading counts from a data display and adding them is grade 6 statistics. It needs only a few readings from the graph and one addition, less than typical grade 7 data work, which compares distributions or uses box plots.
- Estimated difficulty
- Routine: one familiar step, little to misread.
- Thinking it demands
- Depth of knowledge 2, skills and concepts · mainly apply
- What makes it hard
- Solution
- 2 steps
- Reading level
- Question and choices: about grade 9, 42 words.
- Students, last 30 days
- Not enough answers yet to show (it takes 10).
Why it is hard, traps and wrong answers (shows the answer)
Why it is hard
This is a reading question more than a computing one: two heights from the graph and one addition. The point at 3 errors is the one to leave out, since fewer than 3 stops at 2. Checking that all six heights add up to the 26 applicants named in the stem confirms the readings before they are used.
Reading a figure, table or graph minor Understanding the question
Each point’s height is a number of applicants, so the counts for 1 and 2 errors, 4 and 7, are read on the vertical axis above those error values. (Lesh, Post & Behr, 1987; Kirsch & Mosenthal, 1990)
Turning words into math minor Understanding the question
The words “fewer than 3 errors” mean the points at 1 and 2 errors only, leaving out the 5 applicants who made exactly 3. (Hegarty, Mayer & Monk, 1995; Koedinger & Nathan, 2004)
Strategy: Read the number of applicants at each error count below 3 from the heights of the points, then add those numbers.
Traps
- Misreads the figure: Reads a value, label or tick spacing in a figure, table or graph wrongly.
- Answers a different question: A choice is right for another quantity: the other unknown, the rest instead of the part, the part instead of the whole.
The wrong answers, classified
A Misreads the figure (Lesh, Post & Behr, 1987; Kirsch & Mosenthal, 1990)
Reads the axes the wrong way round, so the one point with a height below 3, (6, 1), seems to show 6 applicants making 1 error.
C Little reason to choose it (Haladyna & Downing, 1993; Rodriguez, 2005)
No single misreading gives 12; working from the total, 26 − 15 = 11, reaches it only if a point is skipped, so it mostly draws guesses.
D Answers a different question (King et al., 2004; Hegarty, Mayer & Monk, 1995)
Gives the 26 applicants stated in the stem, everyone who took the test, instead of only those who made fewer than 3 errors.
Worked solution, step by step
Formulas used
- Reading a point
- Each point on the graph is an ordered pair. The first number, x, is read on the bottom axis: the number of errors. The second number, y, is read on the side axis: how many applicants made that many errors.
Sort out the question
In all, 26 applicants took a test. The graph shows how many made each number of errors. You need how many made “fewer than 3 errors.”
Fewer than 3 means 0, 1 or 2 errors. It does not include 3.
Read the points you need
Find the error count on the bottom axis. Then go up to the point and read across to the side axis.
- At 1 error, the point is at height 4. So 4 applicants made 1 error.
- At 2 errors, the point is at height 7. So 7 applicants made 2 errors.
There is no point at 0 errors.
Add the two counts
So 11 applicants made fewer than 3 errors.
Watch out: leave out the point at 3 errors, (3, 5). Those 5 applicants made exactly 3 errors, not fewer. Reading the axes the wrong way round can give 6, choice A. And 26 is everyone, choice D. So the answer is B, 11.
Check your answer
Add all six heights: . That is the 26 applicants in the question, so the readings are right. It also shows nobody made 0 errors. The other made 3 or more.
More questions like this
The original DOE question
Question 5 of 7
2019 Test B Math, question 30Question
PRICE OF A VIDEO GAME AT VARIOUS STORES
| Price of Video Game | Number of Stores |
|---|---|
| $10.99 | 5 |
| $11.99 | 2 |
| $12.99 | 1 |
| $13.99 | 4 |
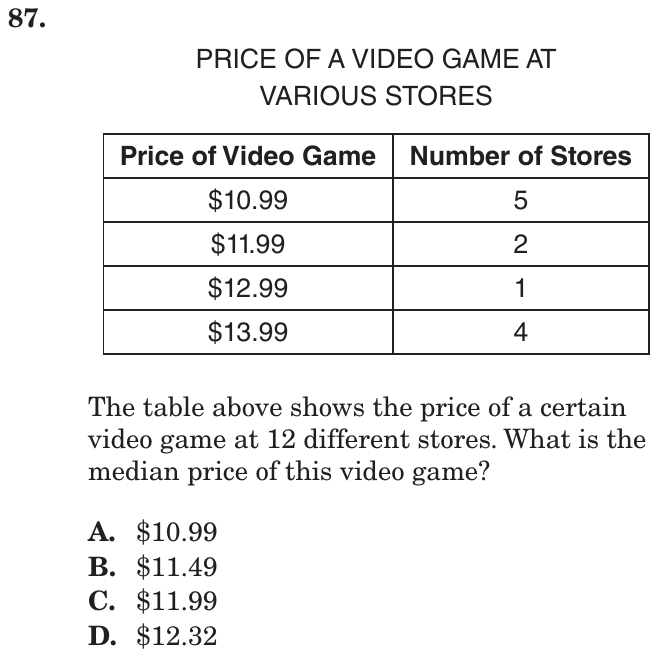
The table above shows the price of a certain video game at 12 different stores. What is the median price of this video game?
- A$10.99
- B$11.49
- C$11.99
- D$12.32
Show the answer
Correct answer: C
There are 5 stores where the video game is priced at $10.99 and a total of 5 stores where it is priced at either $12.99 or $13.99, so the median price must be $11.99.
Question analysis
A frequency table gives the price of one video game at 12 stores, from $10.99 to $13.99, with the number of stores charging each price. Students find the median price. This statistics question tests the median, the middle of an ordered data set, when the data arrive as a table of counts rather than a list.
- Grade level
- Grade 6 content, by NYS standard
- Compared with grade 7
- At grade 7 The median is a grade 6 measure of center that grade 7 students use regularly. What lifts this slightly is the table of counts: students must work out which rows hold the middle prices of the 12.
- Estimated difficulty
- Straightforward: two steps or one careful reading.
- Thinking it demands
- Depth of knowledge 2, skills and concepts · mainly apply
- What makes it hard
- Solution
- 2 steps
- Reading level
- Question and choices: about grade 4, 37 words.
- Students, last 30 days
- Not enough answers yet to show (it takes 10).
Why it is hard, traps and wrong answers (shows the answer)
Why it is hard
Once the middle positions are found there is nothing to compute: the first 5 stores charge $10.99, and the next two, the 6th and 7th, both charge $11.99. The wrong choices each reward a different misuse of a frequency table, taking the most common price, averaging the 5th and 6th values, or working out the mean, which costs time and still misses. Counting stores down the table, 5 and then 7, shows at once that both middle positions fall in the second row.
Reading a figure, table or graph moderate Understanding the question
Each row stands for several stores, 5 at $10.99, 2 at $11.99, 1 at $12.99 and 4 at $13.99, so the ordered list of 12 prices exists only in the student's head. (Lesh, Post & Behr, 1987; Kirsch & Mosenthal, 1990)
Something you must already know minor Working it out
The median of an even number of values is the mean of the two middle ones, here the 6th and 7th; the question assumes this, though both turn out to cost $11.99. (Anderson & Krathwohl, 2001)
Strategy: With 12 prices, the median is the mean of the 6th and 7th once they are in order; add up the store counts from the cheapest price until you reach 7.
Traps
- Answers a different question: A choice is right for another quantity: the other unknown, the rest instead of the part, the part instead of the whole.
- Counting the ends: Inclusive or exclusive ends, fence posts, consecutive numbers: an answer that is one too many or too few, or an endpoint drawn open where it belongs closed (or the reverse).
The wrong answers, classified
A Answers a different question (King et al., 2004; Hegarty, Mayer & Monk, 1995)
Picks $10.99 because more stores charge it than any other price, giving the mode in place of the middle price of the 12.
B Counting the ends (Brown & Burton, 1978)
Averages two middle prices but takes the 5th and 6th, $10.99 and $11.99, when the middle pair of 12 values is the 6th and 7th.
D Answers a different question (King et al., 2004; Hegarty, Mayer & Monk, 1995)
Works out the mean, $147.88 for the 12 stores divided by 12, about $12.32, a measure of center the question does not ask for.
Worked solution, step by step
Formulas used
- Middle places of an even count
- n is how many values there are, when n is an even number. Line the values up in order. The two values in these places have the same number of values before them as after them. For 10 values, they are the 5th and 6th.
- Median of an even number of values
- The median is the middle of a list of values put in order from least to greatest. With an even number of values, two of them share the middle. The median is their mean: add them and divide by 2.
Sort out the question
The table shows one video game’s price at 12 stores. Each row gives a price and how many stores charge it. For example, 4 stores charge $13.99, so $13.99 is in the list 4 times. You need the median price. That is the middle price when all 12 prices are lined up from least to greatest.
Find the two middle places
First check the number of stores: . That is an even number, so no one price sits in the middle. Two prices share it.
The middle prices are the 6th and 7th. Five prices come before the 6th, and five come after the 7th.
Count down the table
The table already lists the prices from least to greatest. Keep a running count of stores as you go down:
- $10.99: 5 stores, places 1 to 5
- $11.99: 2 stores, places 6 and 7
- $12.99: 1 store, place 8
- $13.99: 4 stores, places 9 to 12
Both middle places, the 6th and the 7th, hold $11.99.
Find the median
Use the median formula with the 6th and 7th prices.
The median price is $11.99.
Watch out: $10.99 is the price that shows up most often, called the mode. That is choice A. Averaging the 5th and 6th prices gives $11.49, choice B. Adding all 12 prices and dividing by 12 gives the mean, about $12.32, choice D.
So the answer is C, $11.99.
Check your answer
Look at each side of $11.99. Cheaper: the 5 stores at $10.99. More expensive: 1 store at $12.99 and 4 at $13.99, which is also 5 stores. Five below and five above, with the two $11.99 stores between them. So $11.99 is in the middle.
More questions like this
The original DOE question
Question 6 of 7
2018 Test A Math, question 23Question
SCORES ON MATH QUIZ
| Score | Number of Students |
| 85 | 4 |
| 75 | 4 |
| 65 | 2 |
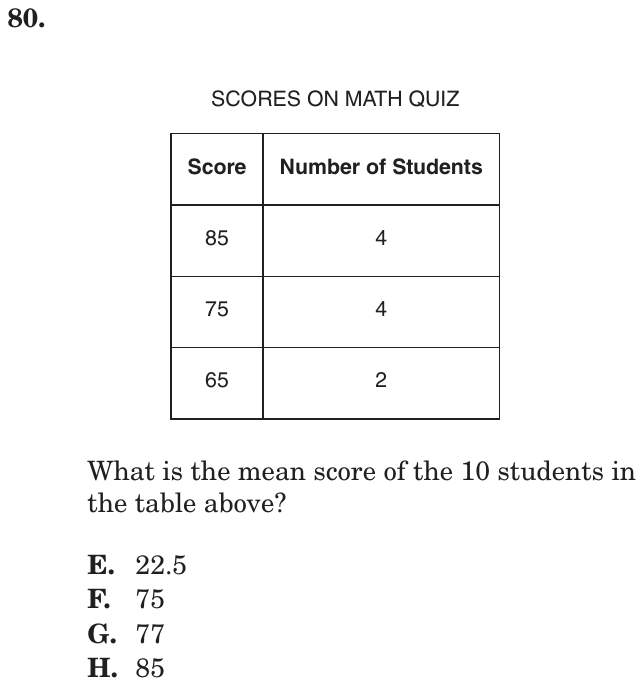
What is the mean score of the 10 students in the table above?
- A22.5
- B75
- C77
- D85
Show the answer
Correct answer: C
For each row, multiply the number of students by the score. Then add those together and divide by the total number of students to find the mean (average) of the 10 students.
Question analysis
This statistics question gives a frequency table of quiz scores: three scores and how many of the 10 students earned each. Students find the mean score of all 10 students. Each score has to count as many times as students earned it, which is easy to overlook when only three scores are listed.
- Grade level
- Grade 6 content, by NYS standard
- Compared with grade 7
- Below grade 7 Computing a mean is grade 6 work, and this weighted version from a table takes two short steps. It is a little easier than typical grade 7 statistics, which compares whole data sets.
- Estimated difficulty
- Straightforward: two steps or one careful reading.
- Thinking it demands
- Depth of knowledge 2, skills and concepts · mainly apply
- What makes it hard
- A very close wrong answer moderate
- Reading a figure, table or graph minor
- Solution
- 2 steps
- Reading level
- Question and choices: about grade 2, 20 words.
- Students, last 30 days
- Not enough answers yet to show (it takes 10).
Why it is hard, traps and wrong answers (shows the answer)
Why it is hard
The procedure is routine once students see that the table lists counts, not separate students. The tempting shortcut is to average the three scores in the first column, which gives a listed choice close to the right one. Multiplying each score by its count, then dividing by 10, takes well under a minute.
A very close wrong answer moderate Choosing the answer
77 and 75 are only 2 points apart, so a rough sense of the middle score cannot choose between them; only weighting each score by its 4, 4 or 2 students does. (Embretson & Wetzel, 1987; Gorin & Embretson, 2006; Ascalon et al., 2007)
Reading a figure, table or graph minor Understanding the question
The table pairs each score with a number of students, so the 10 students are 4, 4 and 2, and each score must be weighted by its count. (Lesh, Post & Behr, 1987; Kirsch & Mosenthal, 1990)
Strategy: Multiply each score by its number of students, add the three products, and divide by the 10 students.
Traps
- Misunderstands the concept: A wrong belief about a concept: that percents can be added, that area grows like length, that averages can be averaged, that a bigger denominator means a bigger fraction.
The wrong answers, classified
A Numbers taken from the question (Hegarty, Mayer & Monk, 1995)
Adds the three scores, 85 + 75 + 65 = 225, and divides by the 10 students, an average lower than every score in the table.
B Misunderstands the concept (Smith, diSessa & Roschelle, 1993; De Bock et al., 1998; Ni & Zhou, 2005)
Averages the three listed scores, (85 + 75 + 65) ÷ 3 = 75, ignoring that 4, 4 and 2 students earned them.
D Numbers taken from the question (Hegarty, Mayer & Monk, 1995)
Picks the top score, which 4 students earned, instead of computing a mean of all 10 scores.
Worked solution, step by step
Formulas used
- Mean (average)
- M is the mean, also called the average. S is the sum, all the values added together. n is how many values there are. Dividing shares the total out equally, so the mean is what each value would be if they were all the same.
Sort out the table
The table lists 3 scores and how many students got each one. 4 students scored 85. 4 students scored 75. 2 students scored 65. That is students. You need the mean, or average, of all 10 scores.
Find the sum of all 10 scores
Each score counts once for every student who got it. So multiply each score by its number of students.
Add the three results.
All 10 scores add up to 770 points.
Divide by the number of students
Watch out: averaging just the three scores gives , choice B. That acts as if only one student got each score. So the answer is C, 77.
Check your answer
More students scored 85 than 65. So the mean should be a little above the middle score, 75. 77 fits. A mean must also be between the lowest and highest scores, 65 and 85. That rules out 22.5.
More questions like this
The original DOE question
Question 7 of 7
2018 Test B Math, question 32Question
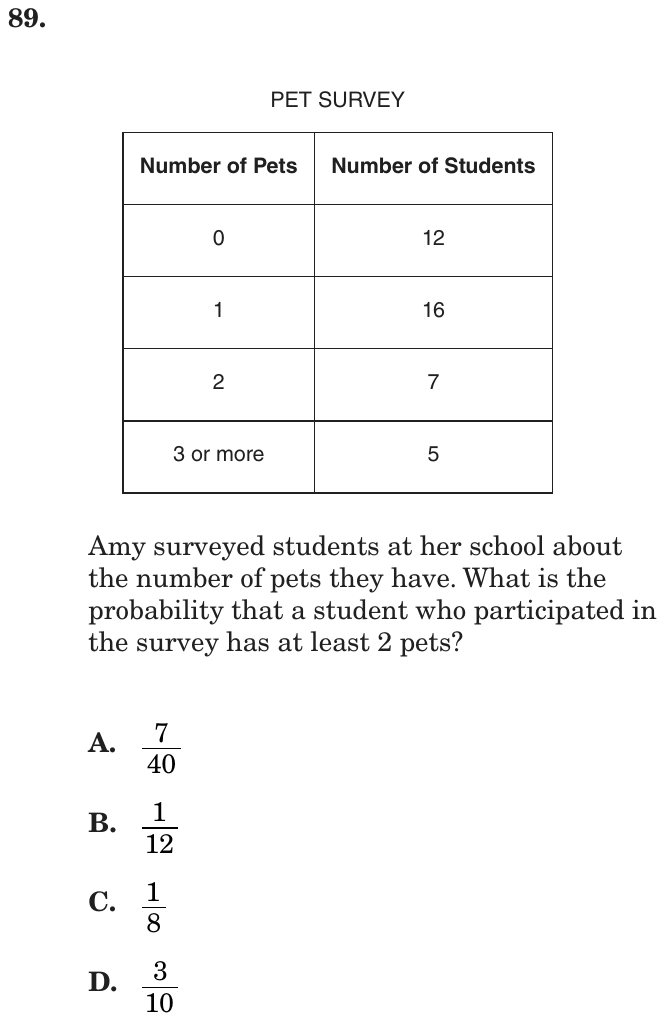
PET SURVEY
| Number of Pets | Number of Students |
| 0 | 12 |
| 1 | 16 |
| 2 | 7 |
| 3 or more | 5 |
Amy surveyed students at her school about the number of pets they have. What is the probability that a student who participated in the survey has at least 2 pets?
- A
- B
- C
- D
Show the answer
Correct answer: D
First, add the number of students for each category to find out how many total students were in the survey:
12 + 16 + 7 + 5 = 40
The number of students who had at least 2 pets are the ones who have 2 pets (7) plus the ones who have 3 or more (5). The total number of students with at least 2 pets is
7 + 5 = 12
The probability of a student in the survey having at least two pets is:
Question analysis
Amy's pet survey table shows how many pets each student has, and the question asks for the probability that a randomly chosen student has at least 2 pets. It tests finding a probability from survey data. The tricky part is reading "at least 2" correctly and using the right total as the denominator.
- Grade level
- Grade 6 content, by NYS standard
- Compared with grade 7
- Below grade 7 Simple probability from a frequency table is grade 6 work in New York. The only extra demand is interpreting "at least" and adding a column, two short steps a grade 7 student should handle easily.
- Estimated difficulty
- Straightforward: two steps or one careful reading.
- Thinking it demands
- Depth of knowledge 2, skills and concepts · mainly apply
- What makes it hard
- Solution
- 3 steps
- Reading level
- Question and choices: about grade 5, 43 words.
- Students, last 30 days
- Not enough answers yet to show (it takes 10).
Why it is hard, traps and wrong answers (shows the answer)
Why it is hard
The arithmetic is light, so the question is decided by the phrase "at least 2" and by remembering that the denominator is everyone surveyed. Students who include only one of the two qualifying rows reach an answer with the right denominator, which makes the mistake hard to notice. Rereading the condition before choosing is the main safeguard.
Turning words into math minor Understanding the question
"At least 2 pets" has to be turned into two rows of the table, the 2-pet row and the 3-or-more row, not one. (Hegarty, Mayer & Monk, 1995; Koedinger & Nathan, 2004)
Reading a figure, table or graph minor Understanding the question
The denominator is not printed anywhere; it has to be built by adding all four rows of the table, 12 + 16 + 7 + 5 = 40. (Lesh, Post & Behr, 1987; Kirsch & Mosenthal, 1990)
Strategy: Total the students in every row to get the denominator, then add the counts for each row that satisfies "at least 2" and simplify the fraction.
Traps
- Misreads the question: Misses or misreads a condition or a word in the question: "at least", "each", "remaining", "not".
The wrong answers, classified
A Misreads the question (Hegarty, Mayer & Monk, 1995)
Reads "at least 2 pets" as exactly 2, counting only the 7 students in that row and leaving out the 5 with 3 or more.
B Numbers taken from the question (Hegarty, Mayer & Monk, 1995)
Writes 1 over 12, apparently from the 12 qualifying students or the 12 in the 0-pet row, with no total in the denominator.
C Misreads the question (Hegarty, Mayer & Monk, 1995)
Reads "at least 2" as more than 2, counting only the 5 students with 3 or more pets: 5/40 = 1/8.
Worked solution, step by step
Formulas used
- Probability
- P is the probability, the chance that something happens. The top counts the results you want. The bottom counts every possible result. Use it when each result is equally likely, like picking one at random.
Sort out the question
The table shows how many students have each number of pets. You pick one student who took the survey. You need the chance that the student has “at least 2 pets”.
At least 2 means 2 or more. So two rows count: the 2 pets row and the 3 or more row.
Find the total number of students
The bottom of the fraction is everyone in the survey. Add all four rows.
There are 40 students in all.
Count the students you want
Add the 2 pets row and the 3 or more row.
So 12 students have at least 2 pets.
Watch out: using only the 7 students with exactly 2 pets gives , choice A. Using only the 5 with 3 or more gives , choice C.
Write and simplify the probability
Use the probability formula.
Divide the top and bottom by 4, since 4 goes into both.
So the answer is D, .
Check your answer
The students with fewer than 2 pets are . Then , so every student is counted once. Also, 12 out of 40 is a bit less than a third. So is .
More questions like this
The original DOE question