Passage Is It Time for Term Limits?
Is It Time for Term Limits?
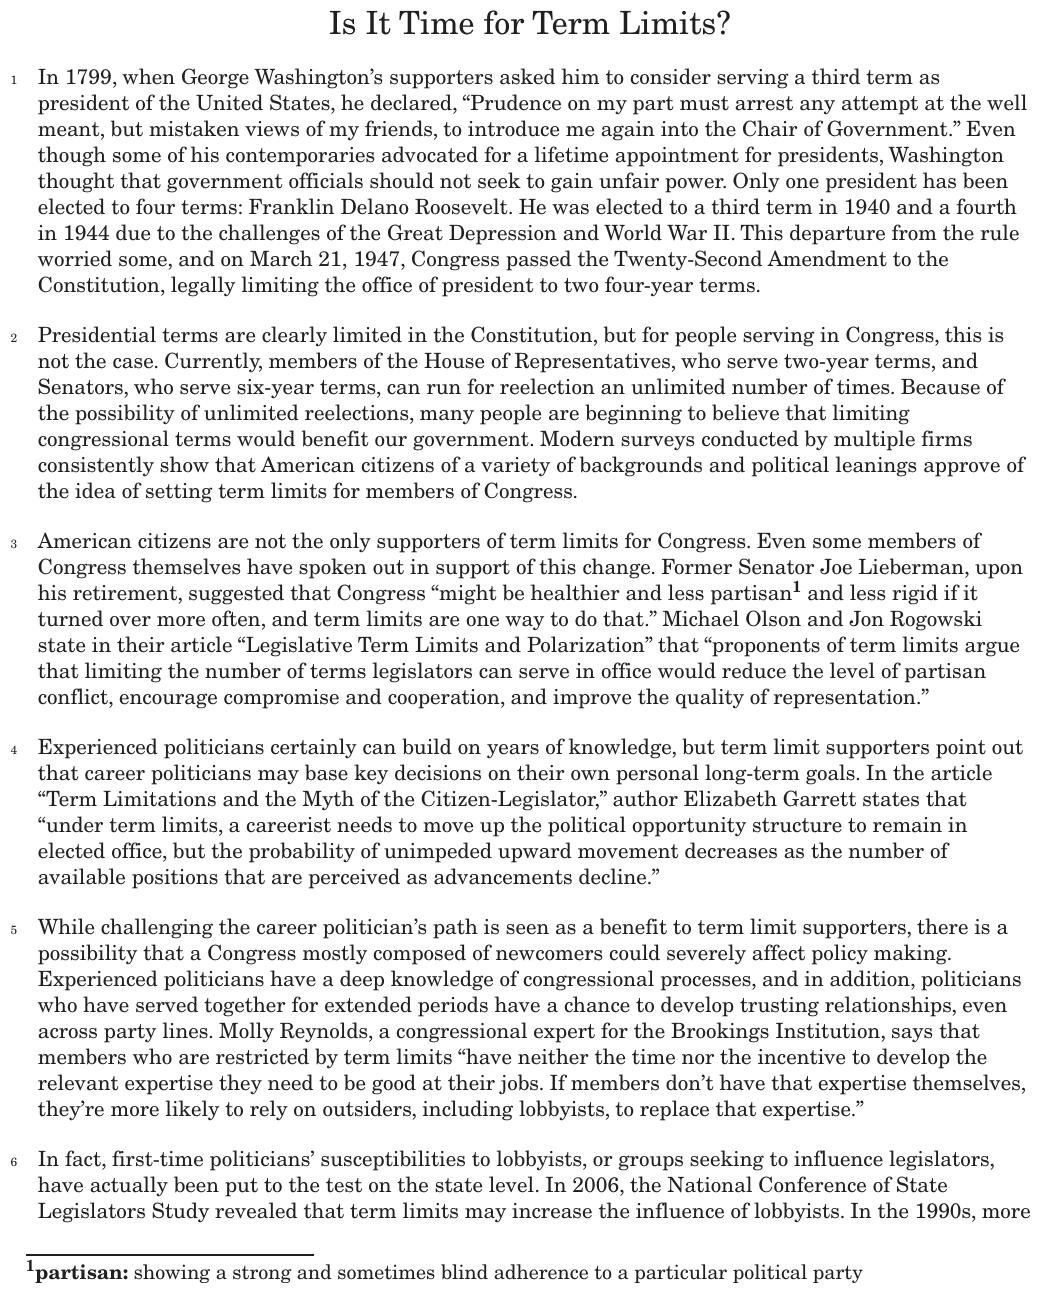
In 1799, when George Washington’s supporters asked him to consider serving a third term as president of the United States, he declared, “Prudence on my part must arrest any attempt at the well meant, but mistaken views of my friends, to introduce me again into the Chair of Government.” Even though some of his contemporaries advocated for a lifetime appointment for presidents, Washington thought that government officials should not seek to gain unfair power. Only one president has been elected to four terms: Franklin Delano Roosevelt. He was elected to a third term in 1940 and a fourth in 1944 due to the challenges of the Great Depression and World War II. This departure from the rule worried some, and on March 21, 1947, Congress passed the Twenty-Second Amendment to the Constitution, legally limiting the office of president to two four-year terms.
Presidential terms are clearly limited in the Constitution, but for people serving in Congress, this is not the case. Currently, members of the House of Representatives, who serve two-year terms, and Senators, who serve six-year terms, can run for reelection an unlimited number of times. Because of the possibility of unlimited reelections, many people are beginning to believe that limiting congressional terms would benefit our government. Modern surveys conducted by multiple firms consistently show that American citizens of a variety of backgrounds and political leanings approve of the idea of setting term limits for members of Congress.
American citizens are not the only supporters of term limits for Congress. Even some members of Congress themselves have spoken out in support of this change. Former Senator Joe Lieberman, upon his retirement, suggested that Congress “might be healthier and less partisan1 and less rigid if it turned over more often, and term limits are one way to do that.” Michael Olson and Jon Rogowski state in their article “Legislative Term Limits and Polarization” that “proponents of term limits argue that limiting the number of terms legislators can serve in office would reduce the level of partisan conflict, encourage compromise and cooperation, and improve the quality of representation.”
Experienced politicians certainly can build on years of knowledge, but term limit supporters point out that career politicians may base key decisions on their own personal long-term goals. In the article “Term Limitations and the Myth of the Citizen-Legislator,” author Elizabeth Garrett states that “under term limits, a careerist needs to move up the political opportunity structure to remain in elected office, but the probability of unimpeded upward movement decreases as the number of available positions that are perceived as advancements decline.”
While challenging the career politician’s path is seen as a benefit to term limit supporters, there is a possibility that a Congress mostly composed of newcomers could severely affect policy making. Experienced politicians have a deep knowledge of congressional processes, and in addition, politicians who have served together for extended periods have a chance to develop trusting relationships, even across party lines. Molly Reynolds, a congressional expert for the Brookings Institution, says that members who are restricted by term limits “have neither the time nor the incentive to develop the relevant expertise they need to be good at their jobs. If members don’t have that expertise themselves, they’re more likely to rely on outsiders, including lobbyists, to replace that expertise.”
In fact, first-time politicians’ susceptibilities to lobbyists, or groups seeking to influence legislators, have actually been put to the test on the state level. In 2006, the National Conference of State Legislatures Study revealed that term limits may increase the influence of lobbyists. In the 1990s, more than twenty states implemented term limits within their state governments. The inexperienced state lawmakers began depending on special-interest groups for their expertise on issues. In the end, many people believed that implementing term limits in the state legislature caused problems, and since then, six states have repealed the limits.
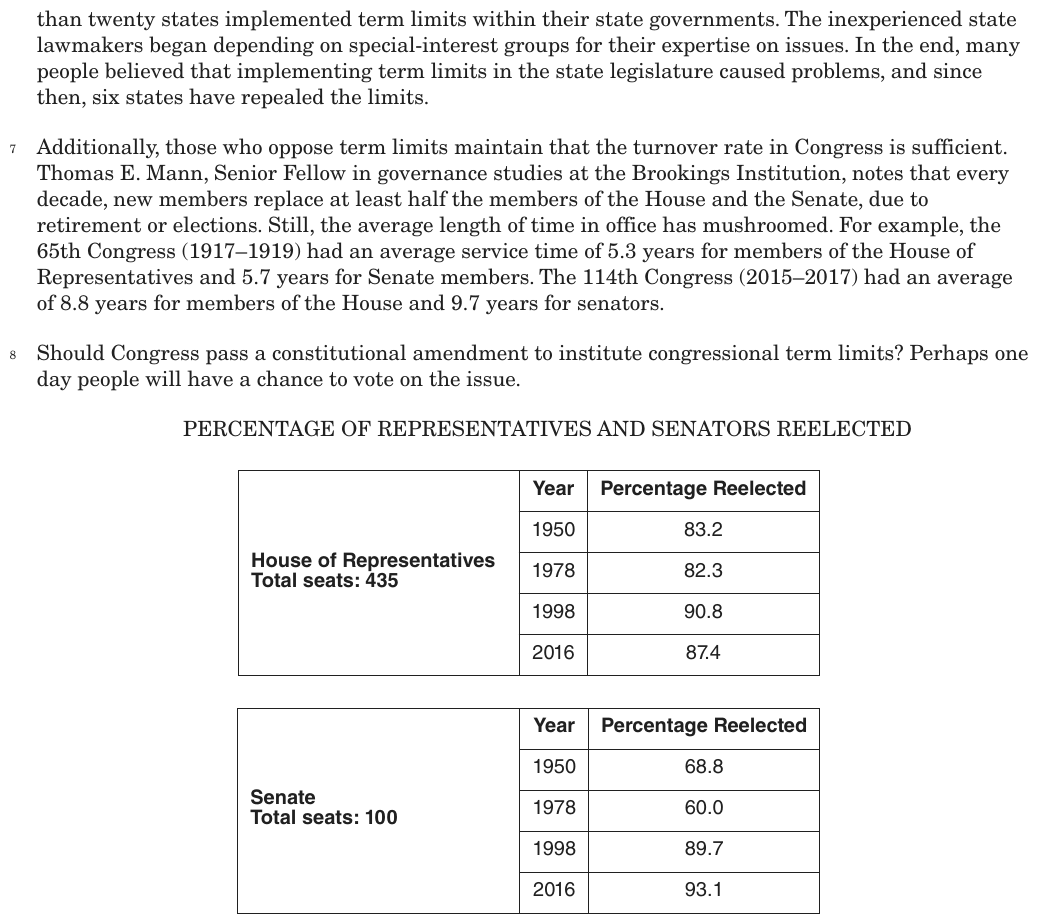
Additionally, those who oppose term limits maintain that the turnover rate in Congress is sufficient. Thomas E. Mann, Senior Fellow in governance studies at the Brookings Institution, notes that every decade, new members replace at least half the members of the House and the Senate, due to retirement or elections. Still, the average length of time in office has mushroomed. For example, the 65th Congress (1917–1919) had an average service time of 5.3 years for members of the House of Representatives and 5.7 years for Senate members. The 114th Congress (2015–2017) had an average of 8.8 years for members of the House and 9.7 years for senators.
Should Congress pass a constitutional amendment to institute congressional term limits? Perhaps one day people will have a chance to vote on the issue.
PERCENTAGE OF REPRESENTATIVES AND SENATORS REELECTED
| House of Representatives Total seats: 435 | Year | Percentage Reelected |
|---|---|---|
| 1950 | 83.2 | |
| 1978 | 82.3 | |
| 1998 | 90.8 | |
| 2016 | 87.4 |
| Senate Total seats: 100 | Year | Percentage Reelected |
|---|---|---|
| 1950 | 68.8 | |
| 1978 | 60.0 | |
| 1998 | 89.7 | |
| 2016 | 93.1 |
1partisan: showing a strong and sometimes blind adherence to a particular political party
Question
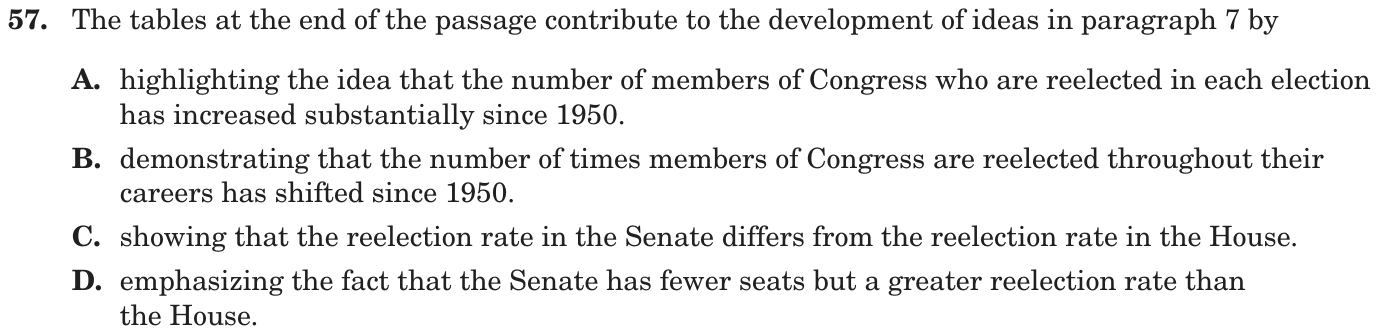
The tables at the end of the passage contribute to the development of ideas in paragraph 7 by
- Ahighlighting the idea that the number of members of Congress who are reelected in each election has increased substantially since 1950.
- Bdemonstrating that the number of times members of Congress are reelected throughout their careers has shifted since 1950.
- Cshowing that the reelection rate in the Senate differs from the reelection rate in the House.
- Demphasizing the fact that the Senate has fewer seats but a greater reelection rate than the House.
Show the answer
Correct answer: A
The question asks how the tables at the end of the passage contribute to the development of ideas in paragraph 7.
A. CORRECT. The tables show that members of Congress have a greater chance of getting reelected today than they did in 1950, supporting the idea from paragraph 7 that the average length of time in office has increased: “Still, the average length of time in office has mushroomed. For example, the 65th Congress (1917–1919) had an average service time of 5.3 years for members of the House of Representatives and 5.7 years for Senate members. The 114th Congress (2015–2017) had an average of 8.8 years for members of the House and 9.7 years for senators.”
B. Incorrect. While the tables suggest that the reelection rate for members of Congress has shifted upward since 1950 as explained in paragraph 7, the tables do not provide details about the number of times congresspeople have been reelected throughout their careers.
C. Incorrect. While the tables indicate that the reelection rates between the House and the Senate differ somewhat, the distinction between reelection rates of the two parts of Congress is unrelated to the main idea of paragraph 7 that “the average length of time in office has mushroomed.”
D. Incorrect. The number of seats in the Senate is a minor detail that does not support an idea from paragraph 7, where the author focuses on current turnover “due to retirement or elections” and the fact that “the average length of time in office has mushroomed.”
Question analysis
Two tables at the end of “Is It Time for Term Limits?” give the percentage of House and Senate members reelected in 1950, 1978, 1998 and 2016, and this question asks how they contribute to the ideas in paragraph 7, which discusses turnover in Congress and time in office. Students must read the tables and weigh options that each describe the numbers in a different way.
- Grade level
- Grade 8 reading and task
- Compared with grade 7
- Above grade 7 Reading values from a table is within grade 7 skills, but here students must link two tables of percentages to one paragraph’s argument and choose among closely worded statements about the numbers, more than typical grade 7 table questions ask.
- Estimated difficulty
- Hard: combines ideas, needs a plan, and has more than one tempting wrong answer.
- Thinking it demands
- Depth of knowledge 3, strategic thinking · mainly analyze
- What makes it hard
- Reading a figure, table or graph moderate
- A very close wrong answer moderate
- Combines ideas minor
- Evidence
- Answered from several paragraphs or stanzas
- Reading level
- Passage: about grade 14, 799 words; question and choices: about grade 9, 87 words.
- Students, last 30 days
- Not enough answers yet to show (it takes 10).
Why it is hard, traps and wrong answers (shows the answer)
Why it is hard
The question joins two tables of percentages to a paragraph about time in office, and the link, that more members winning again means longer careers, is left to the student. The right choice says the share reelected rose substantially, which fits the Senate column, 68.8 in 1950 and 93.1 in 2016, better than the House column, 83.2 and 87.4, so the vaguer claim that reelections “shifted” over careers can look safer. Choices that set the chambers against each other answer a question paragraph 7 never asks.
Reading a figure, table or graph moderate Understanding the question
Each table gives four election years for one chamber, and the point appears only when each column is read down: both dip in 1978, then the House climbs to 90.8 before settling at 87.4 and the Senate climbs from 60.0 to 93.1. (Lesh, Post & Behr, 1987; Kirsch & Mosenthal, 1990)
A very close wrong answer moderate Choosing the answer
The career choice, like the key, says reelection has changed since 1950; it differs in counting reelections over a career, which the tables never show, and in the safer “shifted” for “increased substantially.” (Embretson & Wetzel, 1987; Gorin & Embretson, 2006; Ascalon et al., 2007)
Combines ideas minor Working it out
The tables must be joined to paragraph 7’s claim that time in office “has mushroomed,” from 5.3 and 5.7 years in 1917–1919 to 8.8 and 9.7 in 2015–2017, a link the passage never states. (Embretson, 1998; Daniel & Embretson, 2010)
Strategy: State each point paragraph 7 makes, then read the tables row by row and ask what they show; the right option must be both true of the tables and connected to paragraph 7.
Traps
- Twists what the text says: Uses the text's topic and ideas but changes what it says: who did it, how much, when, or why.
- Wrong purpose or structure: Names a purpose, structure or effect that the part does not serve, or describes what a part says when the question asks what it does.
The wrong answers, classified
B Twists what the text says (King et al., 2004)
Links the tables to paragraph 7’s longer careers and reads them as counting how many times members win, but each row gives the share reelected in a single election year.
C Wrong purpose or structure (Anderson & Krathwohl, 2001)
Reads the two tables against each other as a contrast between chambers, though paragraph 7 treats House and Senate together and each table is laid out to show change across the years.
D Wrong purpose or structure (Anderson & Krathwohl, 2001)
Seizes on the “Total seats” labels and the 2016 row and treats the tables as a contest between chambers, though seat counts and such a contest play no part in paragraph 7.
Working it out, step by step
Figure out what the question asks
This asks how the tables at the end help develop the ideas in paragraph 7. So first find the ideas in paragraph 7. Then read the tables and see which idea they back up.
Find the ideas in paragraph 7
Paragraph 7 gives the view of people who oppose limits: “the turnover rate in Congress is sufficient.” Turnover means old members being replaced by new ones. Sufficient means enough. Then it adds, “Still, the average length of time in office has mushroomed.” Mushroomed means grew fast. Average service went from 5.3 and 5.7 years in 1917–1919 to 8.8 and 9.7 years in 2015–2017.
Read each table on its own
Read each table from top to bottom. The House table goes 83.2, 82.3, 90.8, 87.4. The Senate table goes 68.8, 60.0, 89.7, 93.1. Each one dips in 1978. After that, each table stays above its 1950 number. So in each table, the percentage reelected is higher in 2016 than in 1950. Paragraph 7 never sets the House against the Senate. So read each table for its own change over time.
Connect the tables to paragraph 7
When more members win reelection, more of them stay in office. Members who stay longer push up the average time in office. So the tables back up paragraph 7’s point that time in office “has mushroomed,” even with all the turnover.
Check each choice
- A fits best. The tables give percentages, not counts. Still, A is the only choice about reelection rising since 1950, which both tables show.
- B does not fit. Each row covers one election year. Nothing shows how many times one person won over a career.
- C does not fit. Paragraph 7 gives numbers for both, but it never compares them. So a difference between the two doesn’t develop its ideas.
- D does not fit. The number of seats plays no part in paragraph 7.
Choose the answer
Watch out: B is tempting because paragraph 7 is about long careers. But the tables give one percentage per election year. They never count how many times anyone won. So the answer is A.
Why this answer and not the closest wrong one
B is the closest wrong answer. It links the tables to long careers, as paragraph 7 does. But each row shows the percentage reelected in one election year, not how often a member won over a career. A uses what the tables do show: reelection is higher in 2016 than in 1950. That supports the claim that time in office “has mushroomed.”
More questions like this
The original DOE question
The passage “Is It Time for Term Limits?” as printed (pages 90–91)