Question
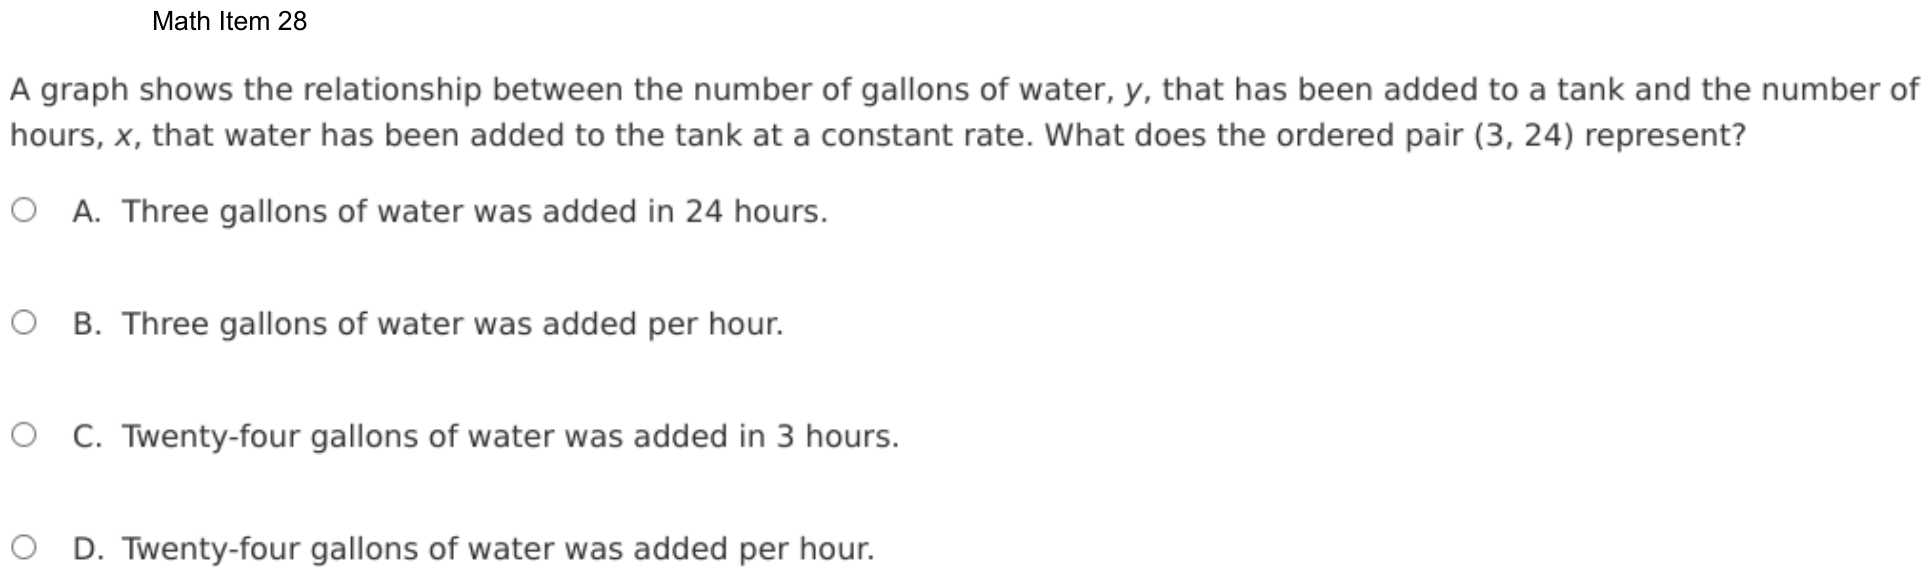
A graph shows the relationship between the number of gallons of water, y, that has been added to a tank and the number of hours, x, that water has been added to the tank at a constant rate. What does the ordered pair (3, 24) represent?
- AThree gallons of water was added in 24 hours.
- BThree gallons of water was added per hour.
- CTwenty-four gallons of water was added in 3 hours.
- DTwenty-four gallons of water was added per hour.
Show the answer
Correct answer: C
It is given that x-values on the graph represent the numbers of hours for which water was added to the tank, and the y-values represent the numbers of gallons of water added in x hours. In the ordered pair (3, 24), 3 represents an x-value and 24 represents a y-value.
Therefore, (3, 24) represents a data point for 24 gallons of water being added to the tank in a 3-hour period.
Question analysis
A graph relates the gallons of water added to a tank, y, to the hours it has been filling at a constant rate, x. Students choose what the ordered pair (3, 24) means in the situation. It tests interpreting coordinates in context, and the four statements mix totals with rates and switch the two numbers around.
- Grade level
- Grade 7 content, by NYS standard
- Compared with grade 7
- At grade 7 Explaining what a point on the graph of a proportional relationship means is named in the grade 7 standards. This is a direct case with no graph to read, though the stem introduces the two quantities in an order that needs care.
- Estimated difficulty
- Straightforward: two steps or one careful reading.
- Thinking it demands
- Depth of knowledge 2, skills and concepts · mainly understand
- What makes it hard
- Solution
- 1 step
- Reading level
- Question and choices: about grade 5, 76 words.
- Students, last 30 days
- Not enough answers yet to show (it takes 10).
Why it is hard, traps and wrong answers (shows the answer)
Why it is hard
One fact decides the question: an ordered pair lists x first. The choices then test two confusions, which number is the gallons and whether a point is a rate. Reading the pair aloud as “after 3 hours, 24 gallons”, and noting that 24 ÷ 3 gives a rate of 8 gallons an hour that no choice states, rules out all three wrong statements.
Reading a figure, table or graph minor Understanding the question
No graph is drawn, and the stem names y, the gallons, before x, the hours, so the pair (3, 24) has to be matched to its letters, not to the order the quantities were mentioned. (Lesh, Post & Behr, 1987; Kirsch & Mosenthal, 1990)
A very close wrong answer minor Choosing the answer
The four statements reuse 3 and 24 in two frames, a total added “in” some hours and an amount “per hour”, so the right statement and its swapped twin differ only in which number counts gallons. (Embretson & Wetzel, 1987; Gorin & Embretson, 2006; Ascalon et al., 2007)
Strategy: Recall that an ordered pair lists x first and y second, write down what x and y measure here, and read the pair as one sentence about hours and gallons.
Traps
- Misreads the question: Misses or misreads a condition or a word in the question: "at least", "each", "remaining", "not".
- Misunderstands the concept: A wrong belief about a concept: that percents can be added, that area grows like length, that averages can be averaged, that a bigger denominator means a bigger fraction.
The wrong answers, classified
A Misreads the question (Hegarty, Mayer & Monk, 1995)
Pairs the numbers with the quantities in the order the stem names them, gallons first, so reads (3, 24) as 3 gallons in 24 hours.
B Misunderstands the concept (Smith, diSessa & Roschelle, 1993; De Bock et al., 1998; Ni & Zhou, 2005)
Takes the first coordinate for a rate and pins it to gallons, mixing up one point on the graph with the constant rate, which is 8 gallons an hour.
D Misunderstands the concept (Smith, diSessa & Roschelle, 1993; De Bock et al., 1998; Ni & Zhou, 2005)
Reads the 24 gallons as the amount added each hour, taking a point’s y-value for the rate, though 24 is the total after 3 hours.
Worked solution, step by step
Formulas used
- An ordered pair
- An ordered pair names one point on a graph. The first number is always the x-value. The second number is always the y-value. Here x counts hours and y counts gallons. So a pair tells how many gallons were added after that many hours.
- Rate from a point
- When water is added at a constant rate, divide the y-value by the x-value. The result is the rate: gallons added in 1 hour. A point itself shows a total, not a rate.
Sort out the question
The graph links two amounts:
- x is the number of hours water has been added.
- y is the number of gallons added.
You need to say what the point (3, 24) means. No graph is drawn, so you work from the words.
Match each number to its letter
In an ordered pair, x always comes first and y second. So in (3, 24):
- x = 3, which means 3 hours.
- y = 24, which means 24 gallons.
Watch out: the question names gallons first and hours second. Do not match the numbers to the words in that order. That mistake reads 3 as gallons and 24 as hours, choice A.
Read the pair as a sentence
Put the two meanings together: after 3 hours, 24 gallons have been added in all. The 24 is a total for the whole 3 hours.
Watch out: 24 is not the amount for each hour. The rate per hour is gallons. So choice D, 24 gallons per hour, is wrong. Choice B, 3 gallons per hour, is also not the rate.
So the answer is C, twenty-four gallons of water was added in 3 hours.
Check your answer
Use the rate of 8 gallons each hour. In 3 hours, gallons go in. That matches choice C. No choice says 8 gallons per hour, so both “per hour” choices must be wrong.
More questions like this
The original DOE question