7.RP.2d points on proportional graphs
Question 1 of 7
2026 Practice Test C Math, question 27Question
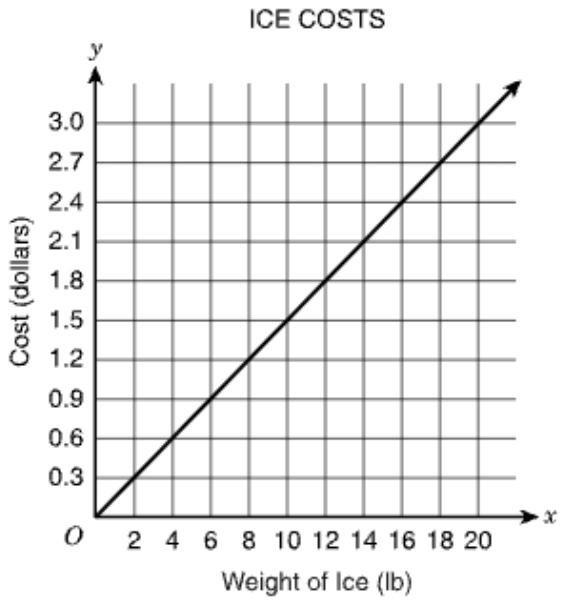
Some friends are buying bags of ice for a picnic. The graph shows the cost of the ice, in dollars, in relation to the weight, in pounds. Which statement about a point on the graph is true?
- AThe point (20, 3) means that 3 lbs of ice costs $20.00.
- BThe point (1, 0.15) means that 1 bag of ice costs $0.15.
- CThe point (10, 1.5) means that 10 lbs of ice costs $1.50.
- DThe point (0, 0) means that 0 lbs of ice will be needed if 0 people go to the picnic.
Show the answer
Correct answer: C
The x-axis represents the weight, in pounds (lbs), of ice purchased, and the y-axis represents the cost of the ice, in dollars.
The x-value in the point (10, 1.5) represents 10 lbs of ice, and the y-value represents 1.5 dollars, or $1.50. Therefore, the cost of 10 lbs of ice is $1.50.
Question analysis
Some friends buying ice for a picnic use a graph of the ice's cost in dollars against its weight in pounds, a straight line from the origin. Students pick the statement that correctly explains what a point on the graph means. Each statement names a point that really is on the line, so the units and the order of the coordinates decide.
- Grade level
- Grade 7 content, by NYS standard
- Compared with grade 7
- At grade 7 Explaining what a point on a proportional graph means in its situation is a named grade 7 skill. The graph is clear and starts at the origin, but each statement has to be read closely against the axis labels.
- Estimated difficulty
- Straightforward: two steps or one careful reading.
- Thinking it demands
- Depth of knowledge 2, skills and concepts · mainly understand
- What makes it hard
- Reading a figure, table or graph moderate
- Every choice must be checked minor
- Solution
- 2 steps
- Reading level
- Question and choices: about grade 2, 77 words.
- Students, last 30 days
- Not enough answers yet to show (it takes 10).
Why it is hard, traps and wrong answers (shows the answer)
Why it is hard
Nothing needs computing, but each statement attaches words to two numbers, and three of them attach the wrong words. The point (1, 0.15) is the unit rate students are trained to look for, and the “bags” in the stem’s story make its statement sound right, though the graph measures pounds. Saying each point aloud as so many pounds for so many dollars exposes the swapped coordinates and the extra people as well.
Reading a figure, table or graph moderate Understanding the question
Each statement must be checked against the axis labels: x is the weight of ice in pounds and y the cost in dollars, on a grid ruled every 2 pounds and every $0.30. (Lesh, Post & Behr, 1987; Kirsch & Mosenthal, 1990)
Every choice must be checked minor Choosing the answer
All four statements name a point that really lies on the line, (1, 0.15) included, so being on the graph rules nothing out; only the meaning given to each coordinate does. (Embretson & Wetzel, 1987)
Strategy: Read both axis labels and their units first, then for each choice say in words what its x-coordinate and its y-coordinate stand for, and compare that with the statement.
Traps
- Misreads the figure: Reads a value, label or tick spacing in a figure, table or graph wrongly.
- Units or scale: The answer is wanted in other units, or a rate or scale must be converted first.
- Misunderstands the concept: A wrong belief about a concept: that percents can be added, that area grows like length, that averages can be averaged, that a bigger denominator means a bigger fraction.
The wrong answers, classified
A Misreads the figure (Lesh, Post & Behr, 1987; Kirsch & Mosenthal, 1990)
Reads the point (20, 3) backward, taking 20 as the price and 3 as the weight, though x counts pounds of ice and y counts dollars.
B Units or scale (King et al., 2004)
Confirms that (1, 0.15) is on the line, the cost of 1 pound, but accepts “1 bag” because the friends buy bags, though the x-axis measures pounds.
D Misunderstands the concept (Smith, diSessa & Roschelle, 1993; De Bock et al., 1998; Ni & Zhou, 2005)
Knows (0, 0) is on every proportional graph and accepts a true-sounding story about people, though the graph never counts people; the point means 0 pounds cost $0.
Worked solution, step by step
Formulas used
- Unit rate
- The cost is in dollars, and the weight is in pounds. The unit rate is the cost of just 1 pound. On a straight line through the origin, it is the same at every point. So you can find it from any point you can read.
Sort out the question
The graph is called ICE COSTS. Read both axes first:
- The x-axis, across the bottom, is the weight of the ice in pounds (lb).
- The y-axis, up the side, is the cost in dollars.
A point is written (x, y), weight first and cost second. So a point means: x pounds of ice cost y dollars. You need the statement that says this correctly.
Find the cost of one pound
The line reaches $3.00 at 20 pounds. Use the unit rate formula:
So 1 pound of ice costs $0.15. This helps you test each point.
Test the point in choice C
Find 10 on the weight axis and go straight up to the line. The line crosses there at 1.5 on the cost axis. The unit rate agrees:
So the point (10, 1.5) means 10 pounds of ice cost $1.50. That is exactly what choice C says.
Check the other statements
Each one names a real point on the line. The problem is the meaning it gives the numbers.
Watch out: choice A reads (20, 3) backward. It means 20 pounds cost $3, not 3 pounds cost $20.
Watch out: choice B is tricky. The point (1, 0.15) is on the line, but the x-axis counts pounds, not bags. So it means 1 pound costs $0.15.
Choice D talks about people, but the graph never counts people. The point (0, 0) means 0 pounds cost $0.
Give the answer
Only choice C gives the right meaning to both numbers.
So the answer is C, 10 lbs of ice costs $1.50.
Check your answer
Use halves. The point (20, 3) says 20 pounds cost $3.00. Half as much ice, 10 pounds, should cost half as much. Half of $3.00 is $1.50. That matches choice C.
More questions like this
The original DOE question
Question 2 of 7
2026 Practice Test D Math, question 28Question
A graph shows the relationship between the number of gallons of water, y, that has been added to a tank and the number of hours, x, that water has been added to the tank at a constant rate. What does the ordered pair (3, 24) represent?
- AThree gallons of water was added in 24 hours.
- BThree gallons of water was added per hour.
- CTwenty-four gallons of water was added in 3 hours.
- DTwenty-four gallons of water was added per hour.
Show the answer
Correct answer: C
It is given that x-values on the graph represent the numbers of hours for which water was added to the tank, and the y-values represent the numbers of gallons of water added in x hours. In the ordered pair (3, 24), 3 represents an x-value and 24 represents a y-value.
Therefore, (3, 24) represents a data point for 24 gallons of water being added to the tank in a 3-hour period.
Question analysis
A graph relates the gallons of water added to a tank, y, to the hours it has been filling at a constant rate, x. Students choose what the ordered pair (3, 24) means in the situation. It tests interpreting coordinates in context, and the four statements mix totals with rates and switch the two numbers around.
- Grade level
- Grade 7 content, by NYS standard
- Compared with grade 7
- At grade 7 Explaining what a point on the graph of a proportional relationship means is named in the grade 7 standards. This is a direct case with no graph to read, though the stem introduces the two quantities in an order that needs care.
- Estimated difficulty
- Straightforward: two steps or one careful reading.
- Thinking it demands
- Depth of knowledge 2, skills and concepts · mainly understand
- What makes it hard
- Solution
- 1 step
- Reading level
- Question and choices: about grade 5, 76 words.
- Students, last 30 days
- Not enough answers yet to show (it takes 10).
Why it is hard, traps and wrong answers (shows the answer)
Why it is hard
One fact decides the question: an ordered pair lists x first. The choices then test two confusions, which number is the gallons and whether a point is a rate. Reading the pair aloud as “after 3 hours, 24 gallons”, and noting that 24 ÷ 3 gives a rate of 8 gallons an hour that no choice states, rules out all three wrong statements.
Reading a figure, table or graph minor Understanding the question
No graph is drawn, and the stem names y, the gallons, before x, the hours, so the pair (3, 24) has to be matched to its letters, not to the order the quantities were mentioned. (Lesh, Post & Behr, 1987; Kirsch & Mosenthal, 1990)
A very close wrong answer minor Choosing the answer
The four statements reuse 3 and 24 in two frames, a total added “in” some hours and an amount “per hour”, so the right statement and its swapped twin differ only in which number counts gallons. (Embretson & Wetzel, 1987; Gorin & Embretson, 2006; Ascalon et al., 2007)
Strategy: Recall that an ordered pair lists x first and y second, write down what x and y measure here, and read the pair as one sentence about hours and gallons.
Traps
- Misreads the question: Misses or misreads a condition or a word in the question: "at least", "each", "remaining", "not".
- Misunderstands the concept: A wrong belief about a concept: that percents can be added, that area grows like length, that averages can be averaged, that a bigger denominator means a bigger fraction.
The wrong answers, classified
A Misreads the question (Hegarty, Mayer & Monk, 1995)
Pairs the numbers with the quantities in the order the stem names them, gallons first, so reads (3, 24) as 3 gallons in 24 hours.
B Misunderstands the concept (Smith, diSessa & Roschelle, 1993; De Bock et al., 1998; Ni & Zhou, 2005)
Takes the first coordinate for a rate and pins it to gallons, mixing up one point on the graph with the constant rate, which is 8 gallons an hour.
D Misunderstands the concept (Smith, diSessa & Roschelle, 1993; De Bock et al., 1998; Ni & Zhou, 2005)
Reads the 24 gallons as the amount added each hour, taking a point’s y-value for the rate, though 24 is the total after 3 hours.
Worked solution, step by step
Formulas used
- An ordered pair
- An ordered pair names one point on a graph. The first number is always the x-value. The second number is always the y-value. Here x counts hours and y counts gallons. So a pair tells how many gallons were added after that many hours.
- Rate from a point
- When water is added at a constant rate, divide the y-value by the x-value. The result is the rate: gallons added in 1 hour. A point itself shows a total, not a rate.
Sort out the question
The graph links two amounts:
- x is the number of hours water has been added.
- y is the number of gallons added.
You need to say what the point (3, 24) means. No graph is drawn, so you work from the words.
Match each number to its letter
In an ordered pair, x always comes first and y second. So in (3, 24):
- x = 3, which means 3 hours.
- y = 24, which means 24 gallons.
Watch out: the question names gallons first and hours second. Do not match the numbers to the words in that order. That mistake reads 3 as gallons and 24 as hours, choice A.
Read the pair as a sentence
Put the two meanings together: after 3 hours, 24 gallons have been added in all. The 24 is a total for the whole 3 hours.
Watch out: 24 is not the amount for each hour. The rate per hour is gallons. So choice D, 24 gallons per hour, is wrong. Choice B, 3 gallons per hour, is also not the rate.
So the answer is C, twenty-four gallons of water was added in 3 hours.
Check your answer
Use the rate of 8 gallons each hour. In 3 hours, gallons go in. That matches choice C. No choice says 8 gallons per hour, so both “per hour” choices must be wrong.
More questions like this
The original DOE question
Question 3 of 7
2024 Test A Math, question 46Question
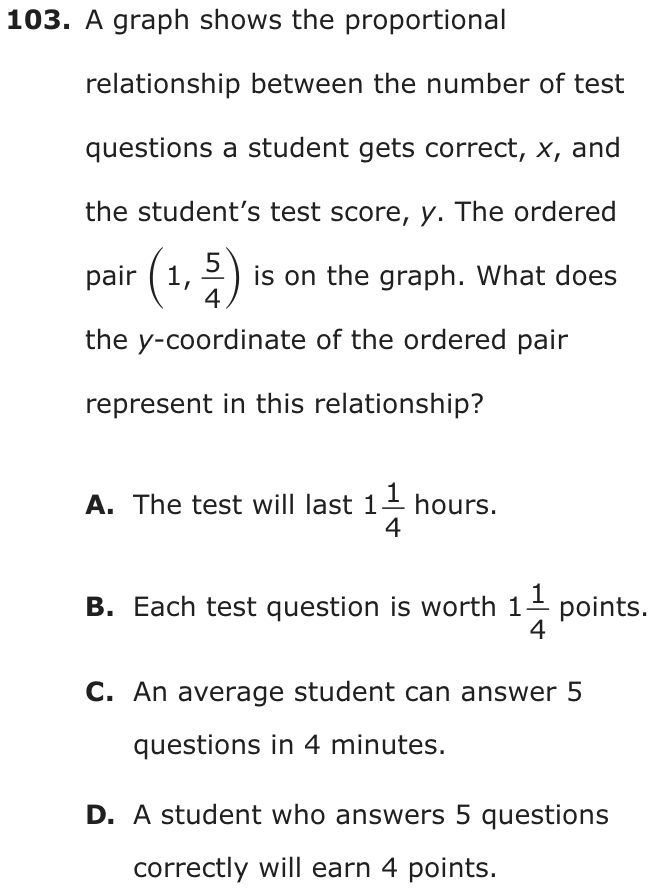
A graph shows the proportional relationship between the number of test questions a student gets correct, x, and the student’s test score, y. The ordered pair is on the graph. What does the y-coordinate of the ordered pair represent in this relationship?
- AThe test will last hours.
- BEach test question is worth points.
- CAn average student can answer 5 questions in 4 minutes.
- DA student who answers 5 questions correctly will earn 4 points.
Show the answer
Correct answer: B
The graph represents a proportional relationship, which means the y-intercept of the graph is (0, 0).
This means that the point represents the unit rate for this situation.
In this situation, x represents the number of questions answered correctly, and y represents the number of points received.
Therefore, for each question answered correctly, the student receives , or , points.
Question analysis
A proportional relationship links the number of test questions a student gets right, x, to the test score, y, and the point (1, 5/4) lies on its graph. Students decide what the y-coordinate of that point means in the situation. The choices reuse the numbers 5, 4 and 1 1/4 in different ways, so the meaning of each coordinate must be kept straight.
- Grade level
- Grade 7 content, by NYS standard
- Compared with grade 7
- At grade 7 Explaining what a point on the graph of a proportional relationship means is named in the grade 7 standards. This item is a direct case, with the graph described in words rather than drawn and only one point to interpret.
- Estimated difficulty
- Straightforward: two steps or one careful reading.
- Thinking it demands
- Depth of knowledge 2, skills and concepts · mainly understand
- What makes it hard
- Solution
- 2 steps
- Reading level
- Question and choices: about grade 7, 73 words.
- Students, last 30 days
- Not enough answers yet to show (it takes 10).
Why it is hard, traps and wrong answers (shows the answer)
Why it is hard
The question checks one idea: when x is 1, the y-coordinate is the score for one correct answer, the unit rate. The pitfall is reading 5/4 as two separate numbers, 5 and 4, and attaching them to questions and points the wrong way round. Ruling out the choices about hours and minutes is quick, since the relationship never mentions time.
Variables instead of numbers minor Understanding the question
No graph is drawn: the relationship and the point (1, 5/4) exist only in words, so students must say for themselves that x counts correct answers and y counts points. (Koedinger & Nathan, 2004; Enright, Morley & Sheehan, 2002)
An answer in an unexpected form minor Choosing the answer
The point gives 5/4, but two choices write it as 1 1/4 and two split it into 5 and 4, so the right reading must be recognized in another form. (Enright, Morley & Sheehan, 2002)
Strategy: Say in words what x and y stand for, then read the ordered pair as a sentence: when x has the first value, y has the second.
Traps
- Wrong operation: Adds instead of multiplying, divides the wrong way round, turns a ratio or rate upside down, or undoes a step in the wrong direction (subtracts what should be added back).
- Numbers taken from the question: Combines the numbers in the question without a model of the situation, or is simply a number that appears in the question.
The wrong answers, classified
A Numbers taken from the question (Hegarty, Mayer & Monk, 1995)
Attaches 1 1/4 to hours of testing, matching the number while ignoring that y measures the test score, not time.
C Numbers taken from the question (Hegarty, Mayer & Monk, 1995)
Reads 5/4 as 5 questions in 4 minutes, using the numbers 5 and 4 with units that the relationship never measures.
D Wrong operation (Hegarty, Mayer & Monk, 1995; King et al., 2004)
Reads 5/4 as 5 correct answers for 4 points, turning the rate upside down; the point means 1 correct answer earns 5/4 points.
Worked solution, step by step
Formulas used
- Proportional relationship
- x and y are two amounts that change together, here right answers and the test score. k is the constant of proportionality: how much y goes with 1 of x. In a proportional relationship, y is always the same number times x. So when x is 1, y equals k.
Sort out the question
x is the number of questions a student gets right. y is the student’s test score, in points. An ordered pair such as lists x first and y second. The y-coordinate is the second number, . You need what that number means.
Read the point as a sentence
In the point, x is 1 and y is . Put those into words: a student who gets 1 question right scores points.
Use the proportional rule
The relationship is proportional. So the score is always the same number times the questions right.
So k is . Every right answer adds the same points. That makes the points for each question.
Write it as a mixed number
A mixed number is a whole number plus a fraction. Four quarters make 1 whole, so five quarters are 1 whole and 1 quarter.
Each question right is worth points.
Match the choices
Choice B says each question is worth points. That matches. Watch out: choice D splits into 5 and 4. But 5 right answers earn points, not 4. Choices A and C talk about time, which this relationship does not measure.
So the answer is B, each test question is worth points.
Check your answer
Try another point. A student with 4 right answers scores points. That fits B, since four questions at points each make 5 points. It does not fit D, which says 5 questions earn 4 points.
More questions like this
The original DOE question
Question 4 of 7
2024 Test B Math, question 6Question
This graph shows y, the weight of a pole of length x.
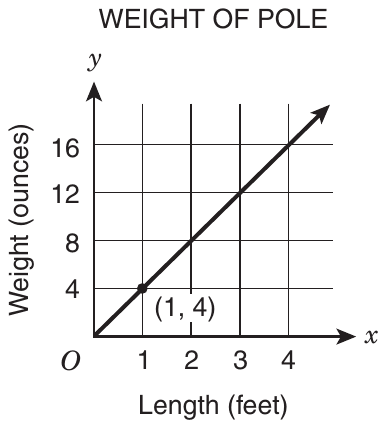
What is represented by the point with coordinates (1, 4)?
- AThe unit rate is 4 ounces per foot.
- BThe y-intercept is 4.
- CA pole 4 feet long weighs 1 ounce.
- DThe length increases 4 feet for each 1 ounce of weight.
Show the answer
Correct answer: A
The x-axis represents the length of the pole, in feet, and the y-axis represents the weight of the pole, in ounces.
The point (1, 4) means that a 1-foot pole would weigh 4 ounces.
Since the graph is linear, the pole weighs 4 ounces for every additional 1 foot of length.
So the unit rate is 4 ounces per foot.
Question analysis
A graph of a pole's weight in ounces against its length in feet is a straight line through the origin, with the point (1, 4) marked. Students decide what that point says about poles, choosing among statements about rates, intercepts and particular poles, so the meaning of each coordinate has to be pinned down.
- Grade level
- Grade 7 content, by NYS standard
- Compared with grade 7
- At grade 7 Explaining what a point on a proportional graph means in the situation is a named grade 7 skill. This is a direct, one-step example with a clear graph, typical of grade 7 classwork.
- Estimated difficulty
- Straightforward: two steps or one careful reading.
- Thinking it demands
- Depth of knowledge 2, skills and concepts · mainly understand
- What makes it hard
- Solution
- 1 step
- Reading level
- Question and choices: about grade 2, 45 words.
- Students, last 30 days
- Not enough answers yet to show (it takes 10).
Why it is hard, traps and wrong answers (shows the answer)
Why it is hard
Nothing needs computing; the question tests whether a point on a graph can be put into words. Each wrong statement misuses the same two numbers, as an intercept, with the coordinates swapped, or as a rate turned upside down. Saying the point aloud with its units, a 1-foot pole weighs 4 ounces, and comparing that sentence with each statement settles it quickly.
Reading a figure, table or graph moderate Understanding the question
The axes carry the meaning: length in feet runs along x and weight in ounces up y, so (1, 4) describes a 1-foot pole, and the line through O makes that a rate. (Lesh, Post & Behr, 1987; Kirsch & Mosenthal, 1990)
A very close wrong answer minor Choosing the answer
Both rate statements pair 4 with 1, one as ounces per foot and the other as feet per ounce; only the axis labels say which way the rate runs. (Embretson & Wetzel, 1987; Gorin & Embretson, 2006; Ascalon et al., 2007)
Something you must already know minor Working it out
The choices use the terms unit rate and y-intercept, which the question does not define, and two statements hang on knowing what each one means. (Anderson & Krathwohl, 2001)
Strategy: Note which quantity each axis measures, say in words what the x-coordinate and the y-coordinate of the marked point stand for, then compare that sentence with each choice.
Traps
- Wrong operation: Adds instead of multiplying, divides the wrong way round, turns a ratio or rate upside down, or undoes a step in the wrong direction (subtracts what should be added back).
- Misreads the figure: Reads a value, label or tick spacing in a figure, table or graph wrongly.
- Misunderstands the concept: A wrong belief about a concept: that percents can be added, that area grows like length, that averages can be averaged, that a bigger denominator means a bigger fraction.
The wrong answers, classified
B Misunderstands the concept (Smith, diSessa & Roschelle, 1993; De Bock et al., 1998; Ni & Zhou, 2005)
Takes the 4 in the point's label for the y-intercept, though the line starts at the origin, where a pole of no length weighs 0 ounces.
C Misreads the figure (Lesh, Post & Behr, 1987; Kirsch & Mosenthal, 1990)
Reads the coordinates the wrong way round, taking 1 as the weight in ounces and 4 as the length in feet.
D Wrong operation (Hegarty, Mayer & Monk, 1995; King et al., 2004)
Turns the rate upside down, describing feet of length per ounce of weight instead of ounces of weight per foot of length.
Worked solution, step by step
Formulas used
- Unit rate
- For a point on the line, y is the weight in ounces and x is the length in feet. The unit rate is the weight of 1 foot of pole. This works for a straight line that starts at the origin, the point (0, 0).
Read the axes
The graph has two axes (number lines). The x-axis, across the bottom, shows length in feet. The y-axis, going up, shows weight in ounces.
A point is written (x, y). The across number comes first, then the up number. So in (1, 4), x is 1 and y is 4.
Say what the point means
x = 1 means a length of 1 foot. y = 4 means a weight of 4 ounces. So a pole 1 foot long weighs 4 ounces.
Watch out: do not swap the numbers. “A pole 4 feet long weighs 1 ounce” reads them the wrong way round. That is choice C.See that this is a unit rate
A unit rate is an amount for 1 unit, here the ounces in 1 foot. The line starts at O, the origin (0, 0), and it is straight. So each extra foot adds the same weight.
The unit rate is 4 ounces per foot. Watch out: choice D turns this upside down. It gives feet for each ounce, not ounces for each foot.
Rule out the y-intercept
The y-intercept is where the line crosses the y-axis. This line crosses it at O, where y is 0. So the y-intercept is 0, not 4, and choice B is wrong.
So the answer is A, the unit rate is 4 ounces per foot.
Check your answer
Try another point on the line, such as (3, 12). A pole 3 feet long weighs 12 ounces. , so it is still 4 ounces per foot. The rate stays the same all along the line.
More questions like this
The original DOE question
Question 5 of 7
2022 Test A Math, question 35Question
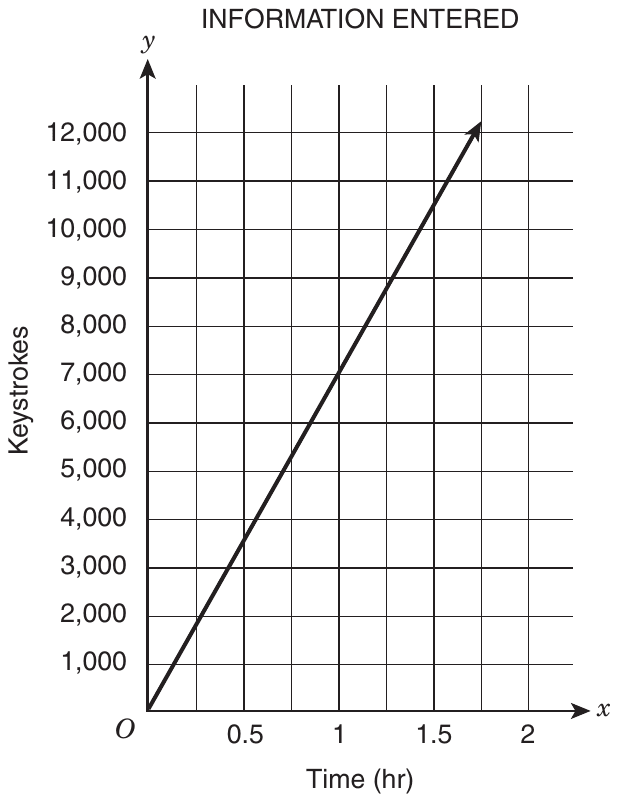
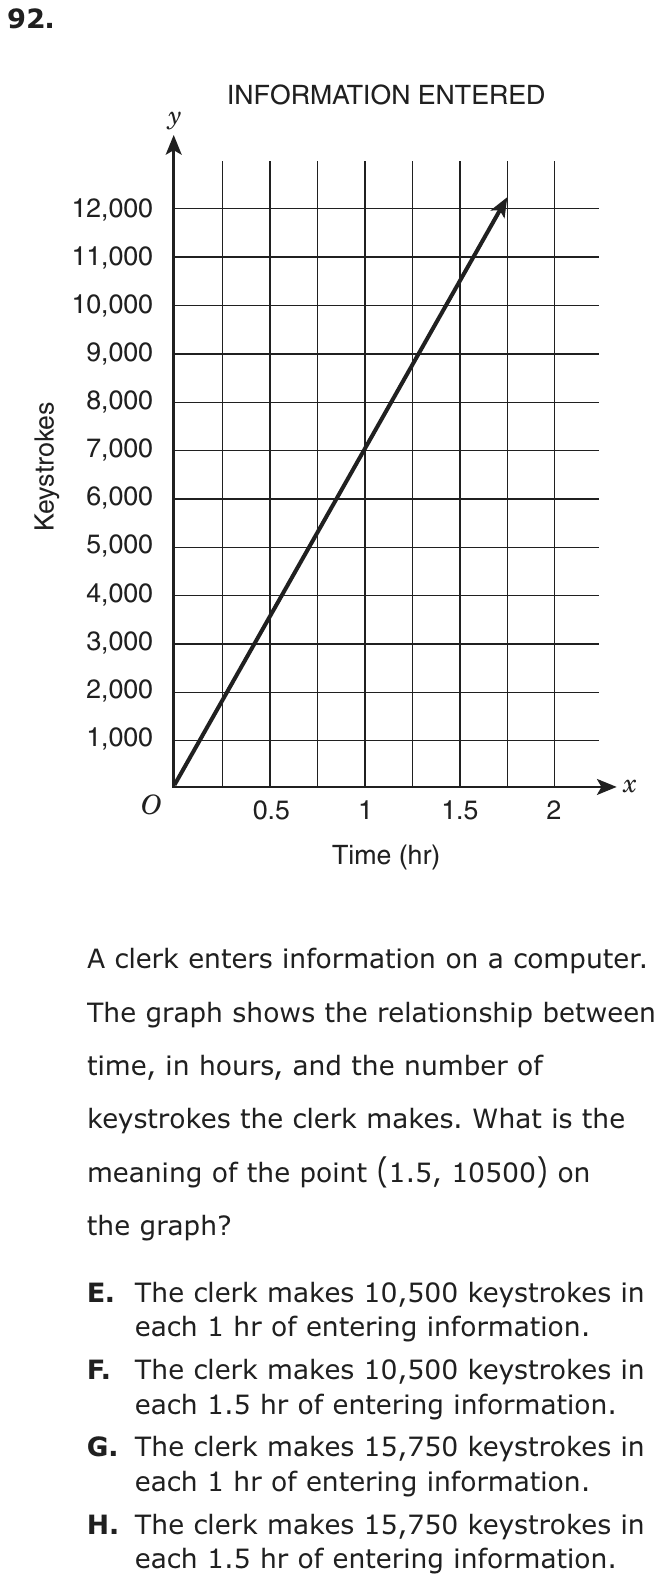
A clerk enters information on a computer. The graph shows the relationship between time, in hours, and the number of keystrokes the clerk makes. What is the meaning of the point (1.5, 10500) on the graph?
- AThe clerk makes 10,500 keystrokes in each 1 hr of entering information.
- BThe clerk makes 10,500 keystrokes in each 1.5 hr of entering information.
- CThe clerk makes 15,750 keystrokes in each 1 hr of entering information.
- DThe clerk makes 15,750 keystrokes in each 1.5 hr of entering information.
Show the answer
Correct answer: B
The x-axis represents the time, in hours, the clerk enters information into the computer, and the y-axis represents the number of keystrokes the clerk makes.
The x-value in (1.5, 10500) gives 1.5 hours as the amount of time the clerk enters information.
The y-value gives 10,500 as the number of keystrokes made by the clerk.
Since the graph is a proportional line, the clerk’s rate is 10,500 keystrokes in each 1.5 hours of entering information.
Question analysis
A straight-line graph through the origin shows how many keystrokes a clerk makes over time, in hours. Students choose the statement that explains what the point (1.5, 10500) means in this situation. Each choice pairs a number of keystrokes with a span of time, so reading both coordinates and their units correctly decides it.
- Grade level
- Grade 7 content, by NYS standard
- Compared with grade 7
- At grade 7 Explaining what a point on the graph of a proportional relationship means in its situation is a named grade 7 skill. This is a short, direct example with a clear graph, though the four statements look alike and must be read closely.
- Estimated difficulty
- Straightforward: two steps or one careful reading.
- Thinking it demands
- Depth of knowledge 2, skills and concepts · mainly understand
- What makes it hard
- Reading a figure, table or graph moderate
- A very close wrong answer minor
- Solution
- 1 step
- Reading level
- Question and choices: about grade 6, 74 words.
- Students, last 30 days
- Not enough answers yet to show (it takes 10).
Why it is hard, traps and wrong answers (shows the answer)
Why it is hard
Nothing needs computing; the question checks that a point on a proportional graph is read as a pair, a time and a count together. Students trained to look for a unit rate expect every statement about a graph to be per hour, and the two statements with 15,750 come from forcing that idea with a product. The graph itself shows 7,000 keystrokes at 1 hour, a figure no statement offers, so every per-hour statement fails.
Reading a figure, table or graph moderate Understanding the question
The stem gives the point (1.5, 10500), and the axis labels must say what each number is: 1.5 hours of time along x and 10,500 keystrokes up y. (Lesh, Post & Behr, 1987; Kirsch & Mosenthal, 1990)
A very close wrong answer minor Choosing the answer
The two statements with 10,500 keystrokes differ only in the time, each 1 hr or each 1.5 hr, so the x-coordinate alone separates them. (Embretson & Wetzel, 1987; Gorin & Embretson, 2006; Ascalon et al., 2007)
Strategy: Use the axis labels to say in words what each coordinate of the point stands for, the x-value in hours and the y-value in keystrokes, then find the statement that says the same.
Traps
- Misunderstands the concept: A wrong belief about a concept: that percents can be added, that area grows like length, that averages can be averaged, that a bigger denominator means a bigger fraction.
- Wrong operation: Adds instead of multiplying, divides the wrong way round, turns a ratio or rate upside down, or undoes a step in the wrong direction (subtracts what should be added back).
The wrong answers, classified
A Misunderstands the concept (Smith, diSessa & Roschelle, 1993; De Bock et al., 1998; Ni & Zhou, 2005)
Reads 10,500 from the point but assumes any point on a rate graph gives the amount for 1 hour, ignoring the x-coordinate, 1.5.
C Wrong operation (Hegarty, Mayer & Monk, 1995; King et al., 2004)
Multiplies 10,500 by 1.5 to get 15,750 and calls it an hourly rate, though the hourly rate is 10,500 ÷ 1.5 = 7,000.
D Numbers taken from the question (Hegarty, Mayer & Monk, 1995)
Multiplies the two coordinates, 10,500 × 1.5 = 15,750, and pairs that product with the 1.5 hours from the point, combining numbers without a model.
Worked solution, step by step
Formulas used
- A point on a graph
- A point is written as a pair in parentheses. x, the first number, tells how far across, along the bottom axis. y, the second number, tells how far up, along the side axis. The axis labels tell what each number measures.
- Unit rate from a point
- Here y is the number of keystrokes and x is the time in hours. Dividing gives the keystrokes for 1 hour. On a straight line that starts at (0, 0), every point gives the same unit rate.
Sort out the question
The graph shows how many keystrokes a clerk makes over time. A keystroke is one press of a key. You need to say what the point (1.5, 10500) means in words. Each choice pairs a number of keystrokes with an amount of time. The axis labels tell you what each number in the point stands for.
Read the x-value
The first number in a point is the x-value. The bottom axis is labeled Time (hr). So x = 1.5 means 1.5 hours of work. On the graph, 1.5 is halfway between 1 and 2.
Read the y-value
The second number is the y-value. The side axis is labeled Keystrokes. So y = 10,500 means 10,500 keystrokes. Put the two together. In 1.5 hours, the clerk makes 10,500 keystrokes.
Use the straight line
The line is straight and starts at O, the point (0, 0). That means the clerk types at a steady speed. So every 1.5 hours of work brings 10,500 keystrokes. Watch out: the point does not give a count for 1 hour. Its x-value is 1.5, not 1. Choice A treats 10,500 as the count for 1 hour.
Rule out the 15,750 choices
15,750 is . Multiplying the two numbers in a point means nothing here. The count for 1 hour comes from dividing:
That is not 15,750, so C is wrong. D is wrong too, since the graph shows 10,500 at 1.5 hours. So the answer is B: 10,500 keystrokes in each 1.5 hr.
Check your answer
Look at the graph at 1 hour. The line crosses 7,000 keystrokes there. At 1.5 hours it is at 10,500. Since , the line fits choice B. No choice gives 7,000 for 1 hour, so every per-hour choice is wrong.
More questions like this
The original DOE question
Question 6 of 7
2022 Test B Math, question 47Question
This graph shows points that represent a proportional relationship between x and y.
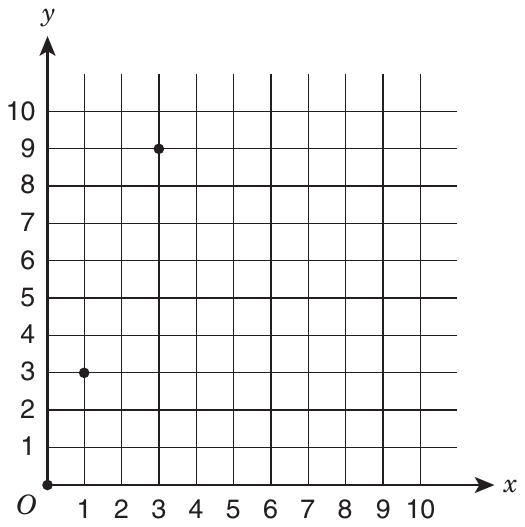
What is the constant of proportionality for this relationship?
- A0
- B1
- C3
- D9
Show the answer
Correct answer: C
A constant of proportionality, k, is the constant value of the ratio between two proportional values. Two varying values are said to be in a relation of proportionality when their ratio yields a constant. In the graph shown, the proportional relationship between x and y is represented by:
Therefore, the constant of proportionality for the relationship on the graph is:
Question analysis
A coordinate graph shows three points that represent a proportional relationship between x and y, one of them at the origin. Students choose the constant of proportionality. It tests finding the unit rate of a proportional relationship from a graph, and the choices include coordinates read straight off the points.
- Grade level
- Grade 7 content, by NYS standard
- Compared with grade 7
- Below grade 7 Identifying the constant of proportionality on a graph is a named grade 7 skill. With whole-number points on a clear grid, one division settles it, which makes this shorter than most grade 7 proportional reasoning.
- Estimated difficulty
- Routine: one familiar step, little to misread.
- Thinking it demands
- Depth of knowledge 1, recall and reproduction · mainly apply
- What makes it hard
- Solution
- 1 step
- Reading level
- Question and choices: about grade 10, 22 words.
- Corrected from the DOE handbook
- A wrong statement of what makes two quantities proportional was corrected in the explanation.
- Students, last 30 days
- Not enough answers yet to show (it takes 10).
Why it is hard, traps and wrong answers (shows the answer)
Why it is hard
A single division settles it once a point other than the origin is chosen. The point at x = 1 shows the constant directly, and the higher point confirms it. Every wrong choice is a number that can be read straight off the graph, the origin’s 0, a coordinate of 1, or the top point’s 9, so the item rewards dividing rather than reading.
Reading a figure, table or graph minor Understanding the question
The plotted points, (0, 0), (1, 3) and (3, 9), carry no labels, so their coordinates are read off the grid before y is divided by x. (Lesh, Post & Behr, 1987; Kirsch & Mosenthal, 1990)
Something you must already know minor Working it out
The question names the constant of proportionality but not how to find it: k is y ÷ x for any point other than the origin, here 3 ÷ 1 or 9 ÷ 3. (Anderson & Krathwohl, 2001)
Strategy: Pick a plotted point other than the origin, divide its y-coordinate by its x-coordinate, and confirm that another point gives the same quotient.
Traps
- Stops one step early: A choice is a number from partway through the solution.
- Misunderstands the concept: A wrong belief about a concept: that percents can be added, that area grows like length, that averages can be averaged, that a bigger denominator means a bigger fraction.
- Misreads the figure: Reads a value, label or tick spacing in a figure, table or graph wrongly.
The wrong answers, classified
A Misunderstands the concept (Smith, diSessa & Roschelle, 1993; De Bock et al., 1998; Ni & Zhou, 2005)
Takes the value at the origin, (0, 0), as the constant, confusing the constant of proportionality with the y-intercept, which is 0 for every proportional graph.
B Misreads the figure (Lesh, Post & Behr, 1987; Kirsch & Mosenthal, 1990)
Reads the x-coordinate of the unit-rate point (1, 3) instead of its y-coordinate, taking the wrong axis’s value as the constant.
D Stops one step early (King et al., 2004; Gierl et al., 2017)
Reads the y-value of the point (3, 9) and stops before dividing it by that point’s x-value, 3, to get the ratio.
What was corrected from the DOE handbook, and why
- Explanation: The handbook says “Two varying values are said to be in a relation of proportionality when either their ratio or their product yields a constant.” Some general definitions use “proportionality” for both kinds, but a constant product (y = k/x) is inverse proportion, a different relationship whose graph never passes through (0, 0). The proportional relationship this question asks about has a constant ratio y/x, which is how the explanation’s own first sentence defines the constant of proportionality. The site reads “…when their ratio yields a constant.” The answer is unchanged: k = 9/3 = 3/1 = 3.
Worked solution, step by step
Formulas used
- Constant of proportionality
- x and y are the two amounts, read from any point (x, y) except (0, 0). k is the constant of proportionality. In a proportional relationship, y divided by x gives the same number at every point. So y = kx, and y is always k times x.
Sort out the question
The graph shows a proportional relationship between x and y. In one, the ratio y ÷ x is the same at every point. A ratio compares two numbers by division. That steady ratio is the constant of proportionality, k. You need k.
Read the points
For each point, read the bottom axis for x and the side axis for y. The points are (0, 0), (1, 3) and (3, 9).
The point (0, 0) is the origin, where the axes meet. You can’t divide by 0, so use the other two points.
Divide y by x
Use the formula with each point.
Both points give 3. So y is always 3 times x.
Give the answer
Watch out: 9 is the y-value of (3, 9) before you divide, choice D. And 1 is the x-value of (1, 3), choice B. And 0, choice A, comes from the origin. Every proportional graph passes through (0, 0), so the origin can’t tell you k. So the answer is C, 3.
Check your answer
Test each point with y = 3x. When x = 1, . When x = 3, . When x = 0, y = 0. All three points fit, so k = 3.
More questions like this
The original DOE question
Question 7 of 7
2022 Test B Math, question 52Question
A farmer has 100 apples and will eat 2 apples per day. Is there a proportional relationship between the number of apples remaining and the number of days that have passed?
- Ano, because the relationship does not include 99 as a number of apples
- Bno, because the ordered pair (0, 0) is not part of the relationship
- Cyes, because all the values in the relationship are even
- Dyes, because the number of apples is decreasing at a constant rate
Show the answer
Correct answer: B
Proportional relationships are relationships between two variables where their ratios are equivalent. The graph of a proportional relationship will always go through the point (0, 0).
In the text of the problem, it is given that the farmer begins with 100 apples. Therefore, the ordered pair (0, 100) would be the point at which the graph of the relationship crosses the y-axis, not (0, 0). Additionally, in a proportional relationship, each pair of values represents the same ratio of .
If the relationship were proportional, the ratio for the first two days (1, 98) and (2, 96) would be equivalent.
Question analysis
A farmer starts with 100 apples and eats 2 apples per day. Students decide whether the number of apples remaining and the number of days that have passed are in a proportional relationship, choosing a yes or no answer with its reason. It tests the definition of a proportional relationship, and every reason offered has to be judged, not just the verdict.
- Grade level
- Grade 7 content, by NYS standard
- Compared with grade 7
- At grade 7 Deciding whether two quantities are proportional is core grade 7 work. Here there is no table or graph to check, only a description, so students must produce pairs of values themselves before testing them.
- Estimated difficulty
- Moderate: several steps, or a close reading with one strong distractor.
- Thinking it demands
- Depth of knowledge 2, skills and concepts · mainly understand
- What makes it hard
- Something you must already know moderate
- Every choice must be checked moderate
- Turning words into math minor
- Solution
- 2 steps
- Reading level
- Question and choices: about grade 7, 74 words.
- Students, last 30 days
- Not enough answers yet to show (it takes 10).
Why it is hard, traps and wrong answers (shows the answer)
Why it is hard
The situation is clearly linear, a steady drop of 2 apples a day, and that is the trap: a constant rate of change sounds like proportionality. The relationship starts at 100 apples on day 0, not at 0, so the ratio of apples to days falls from 98 to 48 between days 1 and 2. Half the choices say no, and only one of those gives a reason that decides the question.
Something you must already know moderate Working it out
The tests for a proportional relationship are not given: apples over days must be one constant ratio, and the graph must pass through (0, 0), which day 0 with 100 apples does not. (Anderson & Krathwohl, 2001)
Every choice must be checked moderate Choosing the answer
Each choice pairs a verdict with a reason, so a right “no” with a wrong reason, the missing 99, has to be ruled out as firmly as a wrong “yes”. (Embretson & Wetzel, 1987)
Turning words into math minor Understanding the question
No table or graph is given, so the pairs have to be built from the words: 100 apples on day 0, 98 on day 1, 96 on day 2. (Hegarty, Mayer & Monk, 1995; Koedinger & Nathan, 2004)
Strategy: List the apples left after 0, 1 and 2 days, recall the two tests for a proportional relationship, and keep only a choice whose reason is both true and decisive.
Traps
- Misunderstands the concept: A wrong belief about a concept: that percents can be added, that area grows like length, that averages can be averaged, that a bigger denominator means a bigger fraction.
The wrong answers, classified
A Misunderstands the concept (Smith, diSessa & Roschelle, 1993; De Bock et al., 1998; Ni & Zhou, 2005)
Has the right verdict, no, but rests it on a true detail that decides nothing: the count skips 99, yet missing values have no bearing on whether ratios are equal.
C Misunderstands the concept (Smith, diSessa & Roschelle, 1993; De Bock et al., 1998; Ni & Zhou, 2005)
Treats the even counts, 100, 98, 96 and so on, as a sign of proportionality, a pattern in the numbers that has nothing to do with a constant ratio.
D Misunderstands the concept (Smith, diSessa & Roschelle, 1993; De Bock et al., 1998; Ni & Zhou, 2005)
Takes a constant rate of change for proportionality: the apples do fall by 2 each day, but they start from 100, not 0, so apples ÷ days is not constant.
Worked solution, step by step
Formulas used
- Proportional relationship
- x and y are two amounts that change together. k is a fixed number, the constant of proportionality. In a proportional relationship, y ÷ x always equals k. When x is 0, y is 0 too, so the graph passes through (0, 0).
Sort out the question
The farmer starts with 100 apples and eats 2 apples each day. You must decide if apples left and days passed are proportional. Each choice gives a yes or a no and a reason. Both parts must be right.
Make a small table
Each day, take away 2 apples.
Days passed 0 1 2 Apples left 100 98 96 As pairs (days, apples), these are (0, 100), (1, 98) and (2, 96).
Test the ratios
If the relationship were proportional, apples ÷ days would be the same every day. Are and equal? Work out each one.
98 is not equal to 48. The ratio changes, so the relationship is not proportional.
Check the point (0, 0)
A proportional graph always passes through (0, 0). Here, on day 0 the farmer has 100 apples, not 0. So that pair is (0, 100). When the apples run out, 50 days have passed: (50, 0). The pair (0, 0) never happens. That is the reason in choice B.
Rule out the other choices
Watch out: choice D is tempting. The apples do drop at a constant rate, 2 each day. But they start at 100, not 0. A steady change alone is not enough.
Choice A is true, since 99 never appears, but it decides nothing. Choice C is about even numbers, which has nothing to do with a steady ratio. So the answer is B.
Check your answer
Try one more day. After 10 days the farmer has apples. Then apples ÷ days is 80 ÷ 10 = 8, not 98 or 48. The ratio keeps changing, so the answer is no, and (0, 0) is missing.
More questions like this
The original DOE question