7.RP.2a testing for proportionality
Question 1 of 5
2026 Practice Test B Math, question 16Question
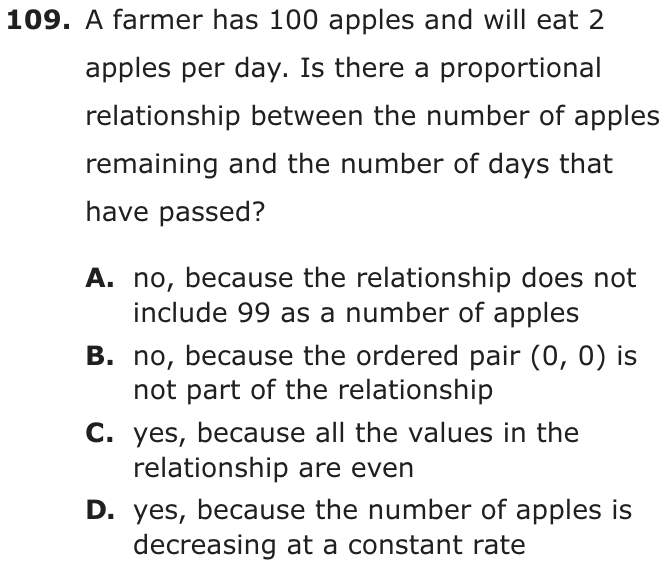
Which tables represent a proportional relationship between the number of books purchased and the total cost?
Select the two correct answers.
Choose every answer that is correct, then check. The DOE has not published how answers with several parts are scored; this site counts one right only when every part is right.
- A
Number of Books Purchased 10 15 20 25 Total Cost ($) 40 60 80 100 - B
Number of Books Purchased 10 15 20 25 Total Cost ($) 70 110 150 250 - C
Number of Books Purchased 10 15 20 25 Total Cost ($) 80 120 160 200 - D
Number of Books Purchased 10 15 20 25 Total Cost ($) 90 130 170 210 - E
Number of Books Purchased 10 15 20 25 Total Cost ($) 100 100 100 100
Show the answer
Correct answer: A and C
The two tables that represent a proportional relationship are tables A and C.
In table A, the total costs divided by the numbers of books for each set of quantities are:
These ratios are equivalent; therefore, these quantities are in a proportional relationship.
In table C, the total costs divided by the numbers of books for each set of quantities are:
These ratios are equivalent; therefore, these quantities are in a proportional relationship.
Question analysis
Five tables list the total cost of buying 10, 15, 20 and 25 books, and students select the two tables that show a proportional relationship between books and cost. It tests recognizing proportional relationships from a constant unit rate. A steady rise in cost is not enough on its own, so each pair of values has to be checked.
- Grade level
- Grade 7 content, by NYS standard
- Compared with grade 7
- At grade 7 Deciding from a table whether two quantities are proportional is a core grade 7 skill, and the divisions here are easy. The demand lies in checking every column of five tables rather than judging by how the costs change.
- Estimated difficulty
- Straightforward: two steps or one careful reading.
- Thinking it demands
- Depth of knowledge 2, skills and concepts · mainly apply
- What makes it hard
- A very close wrong answer moderate
- Every choice must be checked minor
- Something you must already know minor
- Solution
- 2 steps
- Reading level
- Question and choices: about grade 5, 51 words.
- Students, last 30 days
- Not enough answers yet to show (it takes 10).
Why it is hard, traps and wrong answers (shows the answer)
Why it is hard
The divisions are easy, so the question tests what proportional means. Three tables grow by the same amount for every 5 books, and the one with a $10 head start looks just as regular as the right one it copies; only its cost per book, drifting from $9 down to $8.40, gives it away. The flat $100 table and the one that jumps to $250 catch fewer students, and dividing the first and last column of each table is a quick, reliable check.
A very close wrong answer moderate Choosing the answer
The table running $90, $130, $170, $210 is the $80-to-$200 table with $10 added to every cost; both climb $40 for each 5 books, and only the cost per book separates them. (Embretson & Wetzel, 1987; Gorin & Embretson, 2006; Ascalon et al., 2007)
Every choice must be checked minor Choosing the answer
Five tables of four columns each have to be tested by dividing cost by books, and both right tables must be picked to score, so no table can be judged from one column. (Embretson & Wetzel, 1987)
Something you must already know minor Working it out
Students must know that proportional means the same cost per book in every column, a line through zero, not merely a cost that grows by the same amount each time. (Anderson & Krathwohl, 2001)
Strategy: Divide the total cost by the number of books in every column of each table; a table is proportional only when that cost per book stays the same all the way across.
Traps
- Misunderstands the concept: A wrong belief about a concept: that percents can be added, that area grows like length, that averages can be averaged, that a bigger denominator means a bigger fraction.
The wrong answers, classified
B Misunderstands the concept (Smith, diSessa & Roschelle, 1993; De Bock et al., 1998; Ni & Zhou, 2005)
Sees the cost climb $40 for each 5 books across the first three columns and stops checking, though the cost per book goes $7, about $7.33, $7.50, then $10.
D Misunderstands the concept (Smith, diSessa & Roschelle, 1993; De Bock et al., 1998; Ni & Zhou, 2005)
Takes the steady rise of $40 for every 5 books as proportional, but 90 ÷ 10 = 9 while 210 ÷ 25 = 8.4, so the cost per book is not constant.
E Misunderstands the concept (Smith, diSessa & Roschelle, 1993; De Bock et al., 1998; Ni & Zhou, 2005)
Mistakes a cost that never changes for a constant ratio, though $100 for 10 books is $10 a book and $100 for 25 books is $4 a book.
Worked solution, step by step
Formulas used
- Cost per book
- This is the unit rate, the price of one book. Divide the total cost in dollars by the number of books bought. If every book has the same price, this number comes out the same in every column.
- A proportional relationship
- x is the number of books, and y is the total cost in dollars. k is the cost per book, a number that never changes. In a proportional relationship, y is always k times x. So 0 books cost $0, and twice as many books cost twice as much.
Sort out the question
Each table shows the total cost of 10, 15, 20 and 25 books. Proportional means the cost per book is the same in every column. In other words, each book has one fixed price. You must pick the two tables where that is true.
Test the first table
Divide each total cost by its number of books. For table A:
Every column gives $4 per book. So table A is proportional.
Test the other four tables
Do the same division for every table. The numbers are dollars per book:
Table 10 books 15 books 20 books 25 books Same? A 4 4 4 4 Yes B 7 about 7.33 7.50 10 No C 8 8 8 8 Yes D 9 about 8.67 8.50 8.40 No E 10 about 6.67 5 4 No Only tables A and C keep the same price all the way across.
Watch for steady growth
Watch out: table D climbs $40 for every 5 more books, just like table C. That steady climb looks proportional, but it is not enough. D starts $10 higher than C, so its price per book slides from $9 down to $8.40.
Watch out: table E never changes. But $100 for 10 books is $10 each, and $100 for 25 books is $4 each. A total that stays the same is not a price that stays the same.
Name the two answers
Table A charges $4 per book and table C charges $8 per book, in every column. On the test, you check the box next to each of those tables. So the answers are A and C.
Check your answer
In a proportional table, twice the books cost twice as much. In table A, 10 books cost $40 and 20 books cost $80, which is double. In table C, $80 doubles to $160. In table D, $90 would have to double to $180, but the table shows $170. So D fails.
More questions like this
The original DOE question
Question 2 of 5
2026 Practice Test C Math, question 26Question
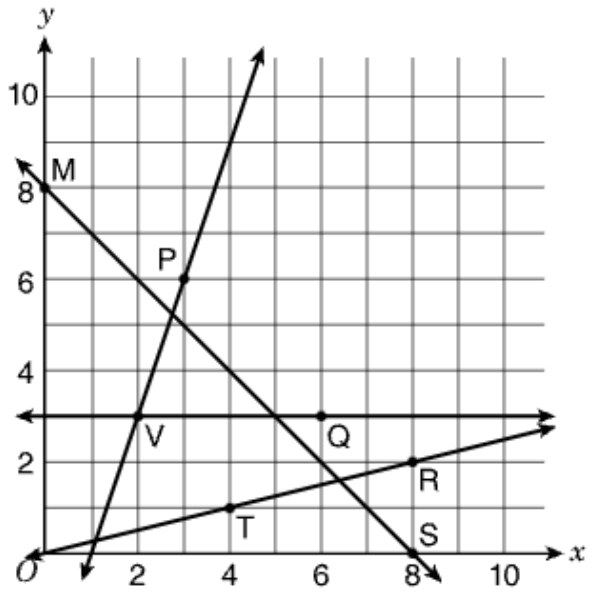
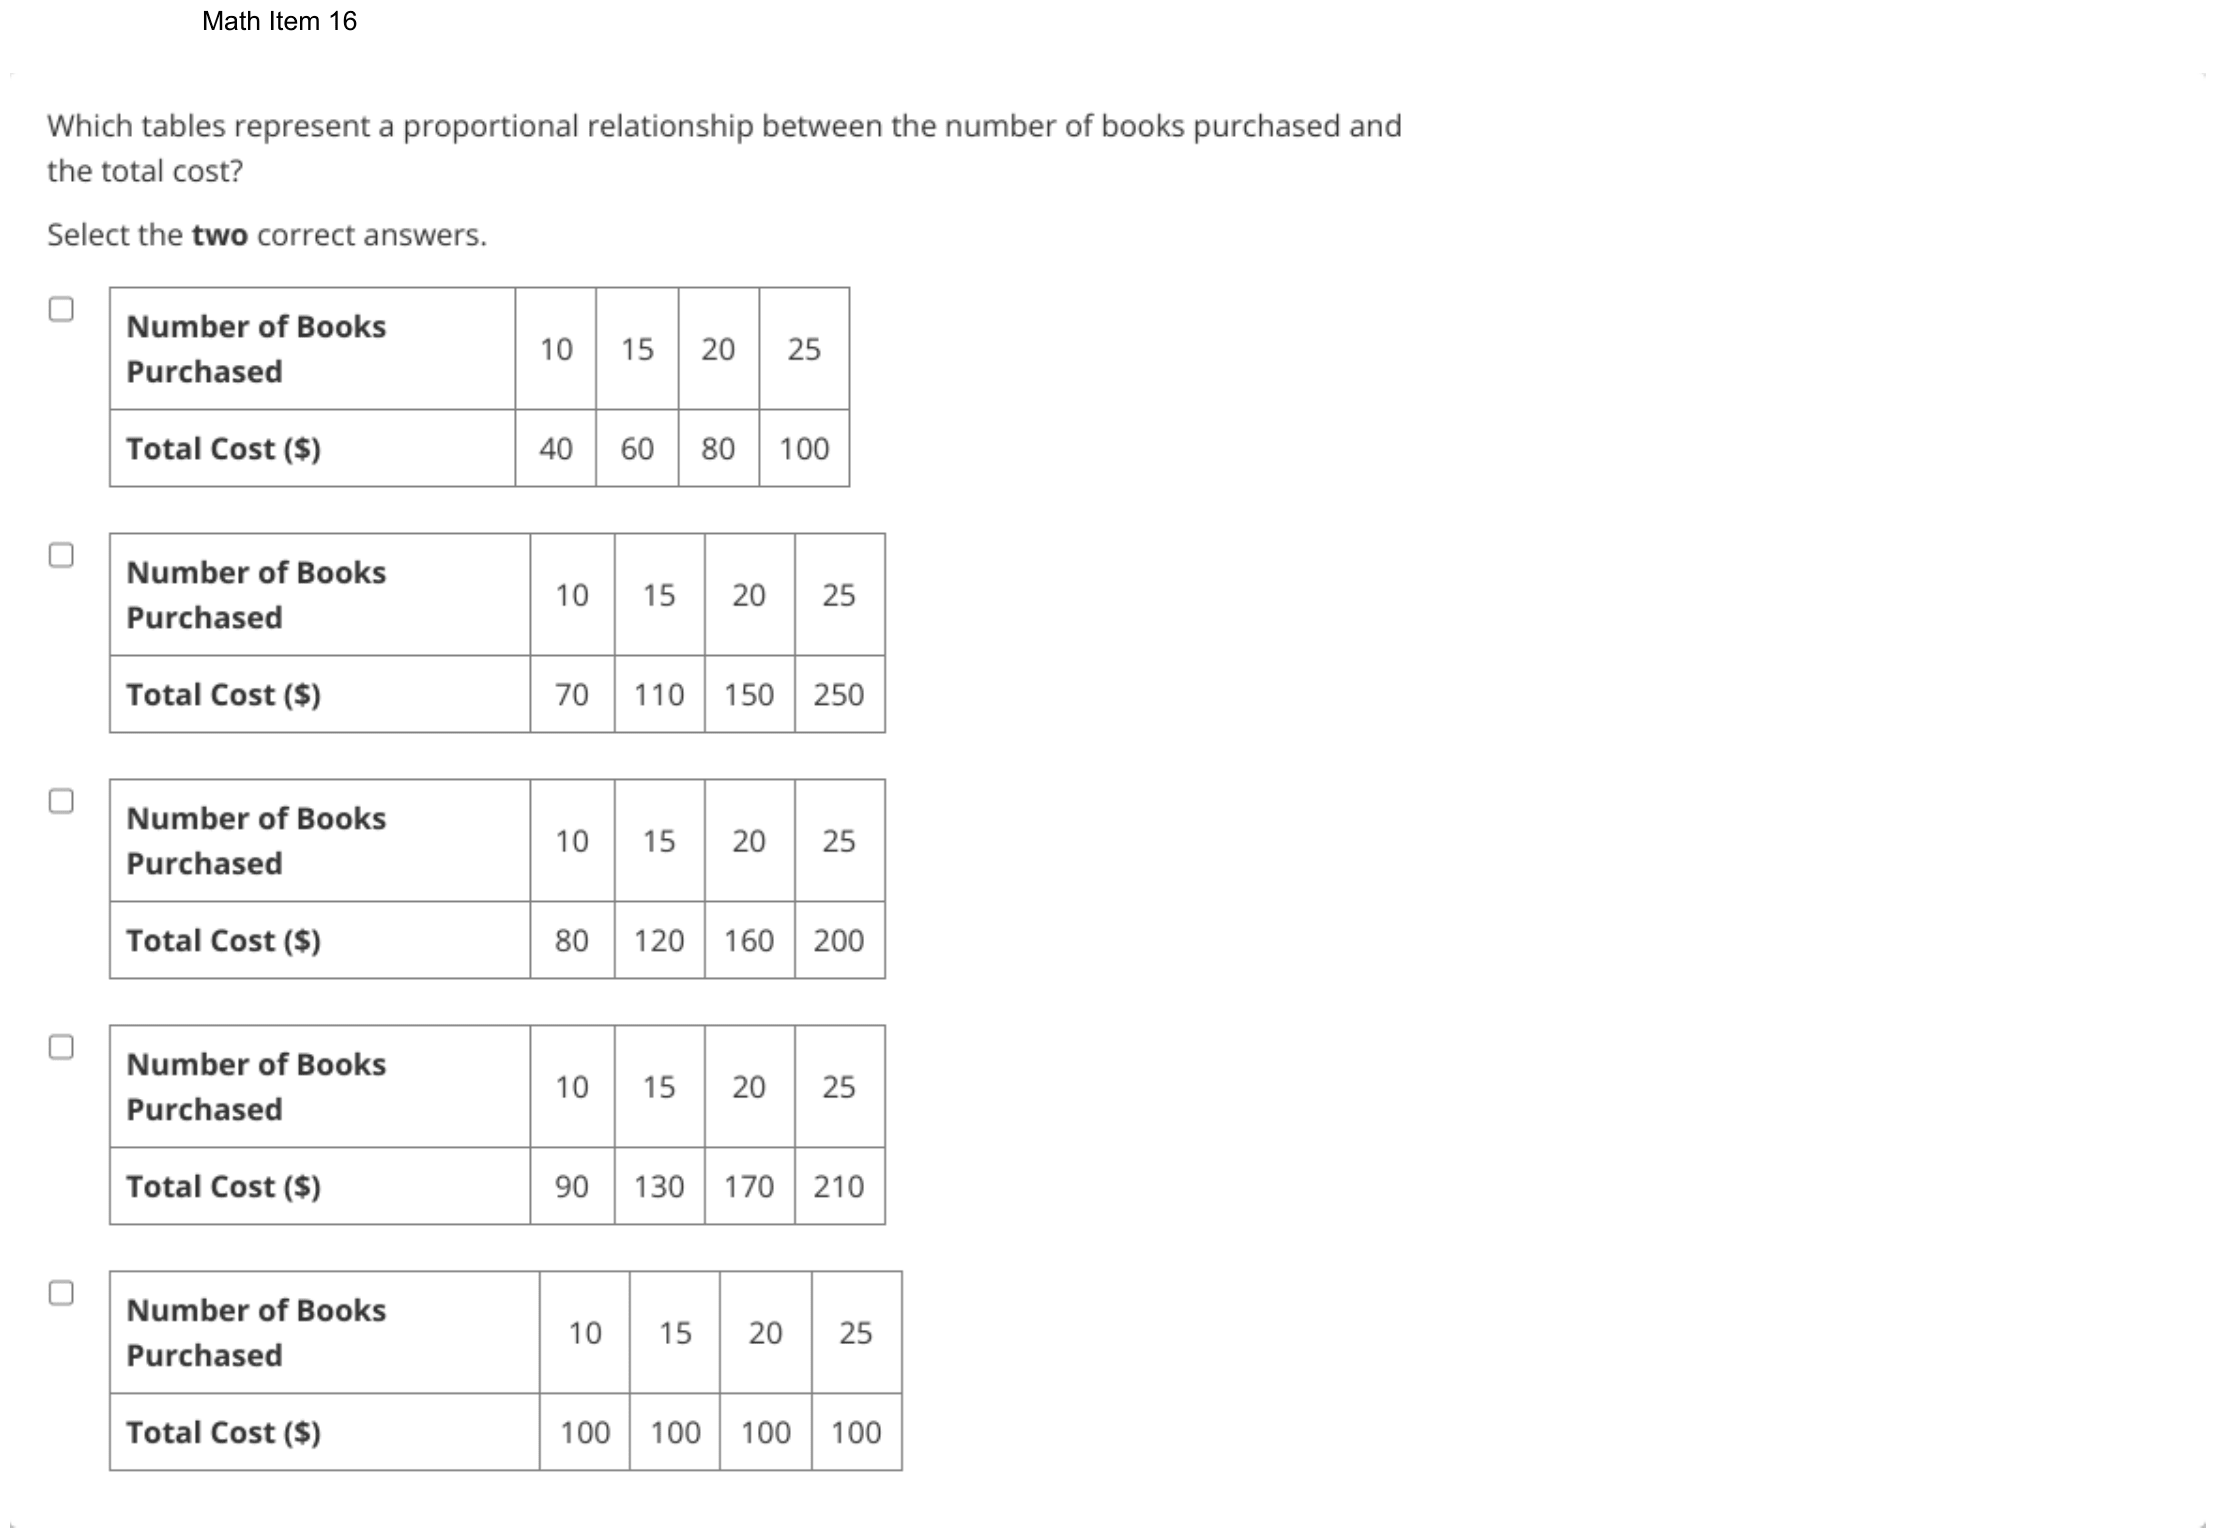
Which straight line is the graph of a proportional relationship?
- A
- B
- C
- D
Show the answer
Correct answer: D
The graph of any proportional line must intersect the origin, .
The only line on the coordinate plane that contains is .
Both point and point have a y-value that is of the x-value, and every point on the line fits the proportional equation .
When . So the line contains the origin, .
Question analysis
A coordinate grid shows four straight lines, each named by two labeled points such as M and S or V and Q, and students choose the one that is the graph of a proportional relationship. It tests recognizing proportional relationships on a graph. Every line is straight, so being straight is not enough, and the lines must be told apart by what defines proportionality.
- NYS standards
- 7.RP.2a testing for proportionality
- Grade level
- Grade 7 content, by NYS standard
- Compared with grade 7
- At grade 7 Deciding from a graph whether a relationship is proportional is a named grade 7 skill, and this is a typical case: four lines on a clean grid, each checked against the same rule, with no calculation needed.
- Estimated difficulty
- Routine: one familiar step, little to misread.
- Thinking it demands
- Depth of knowledge 1, recall and reproduction · mainly understand
- What makes it hard
- Solution
- 1 step
- Reading level
- Question and choices: about grade 9, 14 words.
- Corrected from the DOE handbook
- Coordinates and an equation in the explanation were corrected to match the graph.
- Students, last 30 days
- Not enough answers yet to show (it takes 10).
Why it is hard, traps and wrong answers (shows the answer)
Why it is hard
Once the origin rule is recalled, the graph answers the question at a glance: only the line from O through T and R starts at (0, 0). Students who think of proportional as any steady pattern have three other candidates, from the falling line through M and S to the flat line at height 3. The steep line through V and P is the closest call, because its lower end disappears near the corner where the axes meet.
Something you must already know minor Working it out
The rule that a proportional graph is a straight line through the origin is not printed, and all four lines are straight, so straightness alone rules none of them out. (Anderson & Krathwohl, 2001)
Reading a figure, table or graph minor Understanding the question
Line VP runs off the grid just right of O, crossing the x-axis at (1, 0), so whether it passes through the origin has to be read from the gridlines, not from its general direction. (Lesh, Post & Behr, 1987; Kirsch & Mosenthal, 1990)
Strategy: Recall what every proportional graph must look like, then test each line: see where it would be when x is 0, and whether y divided by x stays the same at both labeled points.
Traps
- Misunderstands the concept: A wrong belief about a concept: that percents can be added, that area grows like length, that averages can be averaged, that a bigger denominator means a bigger fraction.
- Misreads the figure: Reads a value, label or tick spacing in a figure, table or graph wrongly.
The wrong answers, classified
A Misunderstands the concept (Smith, diSessa & Roschelle, 1993; De Bock et al., 1998; Ni & Zhou, 2005)
Takes MS as proportional because it is straight and meets both axes, though it starts at (0, 8) and its y-values fall as x rises.
B Misreads the figure (Lesh, Post & Behr, 1987; Kirsch & Mosenthal, 1990)
Sees the steep line’s lower end vanish near O and assumes it passes through the origin, though VP crosses the x-axis at (1, 0).
C Misunderstands the concept (Smith, diSessa & Roschelle, 1993; De Bock et al., 1998; Ni & Zhou, 2005)
Mistakes the steady y-value of 3 along VQ for a constant of proportionality, though y ÷ x falls from 3/2 at V to 1/2 at Q.
What was corrected from the DOE handbook, and why
- Explanation: The DOE’s explanation says “Both point T (1, 4) and point R (2, 8) have a y-value that is 4 times the x-value, and every point on the line fits the proportional equation y = 4x”, and then “When x = 0, y = 4(0).” On the graph, T is at (4, 1) and R at (8, 2): each y-value is 1/4 of its x-value, and the line through the origin, T and R is y = (1/4)x. (The line y = 4x would pass through (1, 4) and (2, 8), which are not marked.) The 2022–23 guide, which first printed this question with the same graph, has the same slip. The site now gives T (4, 1) and R (8, 2), “a y-value that is 1/4 of the x-value”, y = (1/4)x, and y = (1/4)(0) at x = 0. The answer is unchanged: TR is still the only line through the origin.
Worked solution, step by step
Formulas used
- Proportional relationship
- y and x are two amounts that change together. k is the constant of proportionality: the number you always multiply x by to get y. When x is 0, y is k times 0, which is 0. So the graph is a straight line through the origin, the point (0, 0) where the axes meet.
Sort out the question
The grid shows four straight lines. Each one is named by two labeled points on it: line MS, line VP, line VQ and line TR.
You need the line that shows a proportional relationship. In that kind of relationship, y is always the same number times x. For example, y might always be 3 times x.
Recall what a proportional graph looks like
Use the rule . Put in 0 for x:
So every proportional graph goes through the origin. That is the corner point (0, 0), labeled O, where the two axes meet. The graph must also be a straight line.
All four lines here are straight. So being straight does not settle it. Look for the line through O.
Check where each line starts
- Line MS meets the y-axis at M (0, 8). When x is 0, y is 8, not 0.
- Line VP is steep. Its lower end crosses the x-axis at (1, 0), one unit to the right of O.
- Line VQ is flat at a height of 3. It never comes down to 0.
- Line TR starts at O and runs up through T and R.
Watch out: the lower end of line VP looks close to O. Follow it along the grid lines. It misses O by one unit, so choice B is wrong.
Test the ratio on line TR
In a proportional relationship, the ratio y ÷ x is the same at every point. T is at (4, 1) and R is at (8, 2):
Both give . So each y-value is of its x-value, and the line is .
Watch out: line VQ keeps the same y-value, 3, but not the same ratio. At V it is , and at Q it is . So choice C is wrong.
Give the answer
Line MS starts at 8 on the y-axis, so choice A is out too. Only line TR goes through the origin and keeps y ÷ x the same.
So the answer is D, line TR.
Check your answer
Put the origin into the rule for line TR: . So (0, 0) is on the line. Then test R: , which matches R (8, 2). The rule fits every labeled point on the line.
More questions like this
The original DOE question
Question 3 of 5
2026 Practice Test C Math, question 48Question
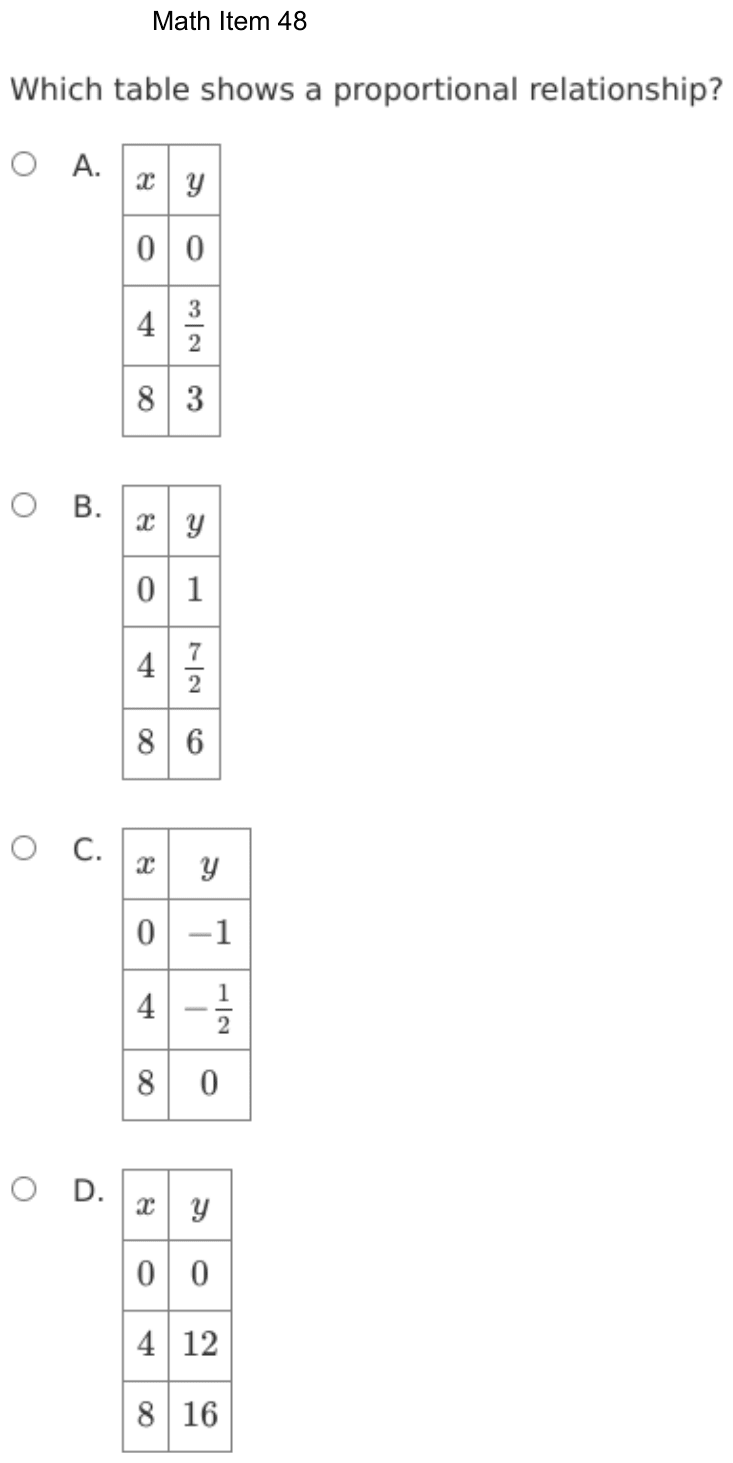
Which table shows a proportional relationship?
- A
x y 0 0 4 8 3 - B
x y 0 1 4 8 6 - C
x y 0 −1 4 8 0 - D
x y 0 0 4 12 8 16
Show the answer
Correct answer: A
The first table is the only one with a constant of proportionality, .
In each ordered pair, .
Question analysis
Four tables each give y for x = 0, 4 and 8, with some values written as fractions or negatives. Students choose the table that shows a proportional relationship. It tests recognizing proportional relationships from a table, which means checking every row against one rule rather than judging by the pattern.
- Grade level
- Grade 7 content, by NYS standard
- Compared with grade 7
- At grade 7 Deciding from a table whether a relationship is proportional is a core grade 7 skill. The fractions and negative values in the tables make each ratio a careful check rather than a glance.
- Estimated difficulty
- Straightforward: two steps or one careful reading.
- Thinking it demands
- Depth of knowledge 2, skills and concepts · mainly apply
- What makes it hard
- Every choice must be checked moderate
- Error-prone arithmetic minor
- Solution
- 2 steps
- Reading level
- Question and choices: about grade 9, 13 words.
- Students, last 30 days
- Not enough answers yet to show (it takes 10).
Why it is hard, traps and wrong answers (shows the answer)
Why it is hard
Two quick tests decide proportionality, and the tables are built so that each test alone lets a wrong table through. The last table starts at (0, 0) like the right one, while the middle two grow by equal steps like the right one. Only checking that y ÷ x is the same in every row with x not 0 separates the one table whose ratio stays at 3/8.
Every choice must be checked moderate Choosing the answer
Each table has to be tested row by row, and two of them start at (0, 0), so the opening row settles nothing; only y ÷ x in the other rows separates them. (Embretson & Wetzel, 1987)
Error-prone arithmetic minor Working it out
The y-values include 3/2, 7/2 and −1/2, so the ratios mean dividing fractions by 4, such as (3/2) ÷ 4 = 3/8, and comparing them with 3 ÷ 8. (Brown & Burton, 1978; Junker & Sijtsma, 2001)
Strategy: For each table, divide y by x in every row where x is not zero, and check that the quotient never changes and that y is 0 when x is 0.
Traps
- Misunderstands the concept: A wrong belief about a concept: that percents can be added, that area grows like length, that averages can be averaged, that a bigger denominator means a bigger fraction.
- Checks only one number: Tries one value in each choice and takes the first that works, when that value happens to work for a wrong choice too; a second value would rule it out.
The wrong answers, classified
B Misunderstands the concept (Smith, diSessa & Roschelle, 1993; De Bock et al., 1998; Ni & Zhou, 2005)
Sees y rise by the same 5/2 each time x rises by 4 and takes the steady change as proportional, missing that y is 1 when x is 0.
C Misreads the figure (Lesh, Post & Behr, 1987; Kirsch & Mosenthal, 1990)
Spots a 0 in the y column and a steady rise of 1/2, but that 0 belongs to x = 8, while at x = 0 the table gives −1.
D Checks only one number (Schoenfeld, 1985)
Checks only the row (0, 0), which every proportional table has, or only 12 ÷ 4 = 3, without testing 16 ÷ 8 = 2 in the last row.
Worked solution, step by step
Formulas used
- Proportional relationship
- y and x are the two amounts in each row. k is the constant of proportionality, the same number in every row. Two tests follow from it. When x is 0, y must be 0. And y ÷ x must equal k in every row where x is not 0.
Sort out the question
Each table gives y for x = 0, 4 and 8. You need the one that shows a proportional relationship. That means y is always the same number times x.
Use two tests. First, y must be 0 when x is 0. Second, y ÷ x must be the same in the other rows.
Test the row where x is 0
Look at the top row of each table:
- Table A: y = 0. It passes.
- Table B: y = 1. It fails.
- Table C: y = −1. It fails.
- Table D: y = 0. It passes.
Watch out: tables B and C go up by equal steps. Steady steps are not enough, because they do not start at 0. Table C does have a 0, but it is next to x = 8.
Test the ratio in table A
Divide y by x. Dividing by 4 is the same as multiplying by :
Both rows give . Table A passes both tests.
Test the ratio in table D
Divide y by x in the same way:
The ratios are different, so table D is not proportional.
Watch out: table D starts at (0, 0) like a proportional table. If you check only that row, or only the row with 4, you will pick choice D.
Give the answer
Only table A starts at (0, 0) and keeps y ÷ x the same.
So the answer is A, the table with y = 0, and 3.
Check your answer
Use the rule for table A, . When x = 4, . When x = 8, . Both match. Doubling x from 4 to 8 also doubles y.
More questions like this
The original DOE question
Question 4 of 5
2024 Test B Math, question 30Question
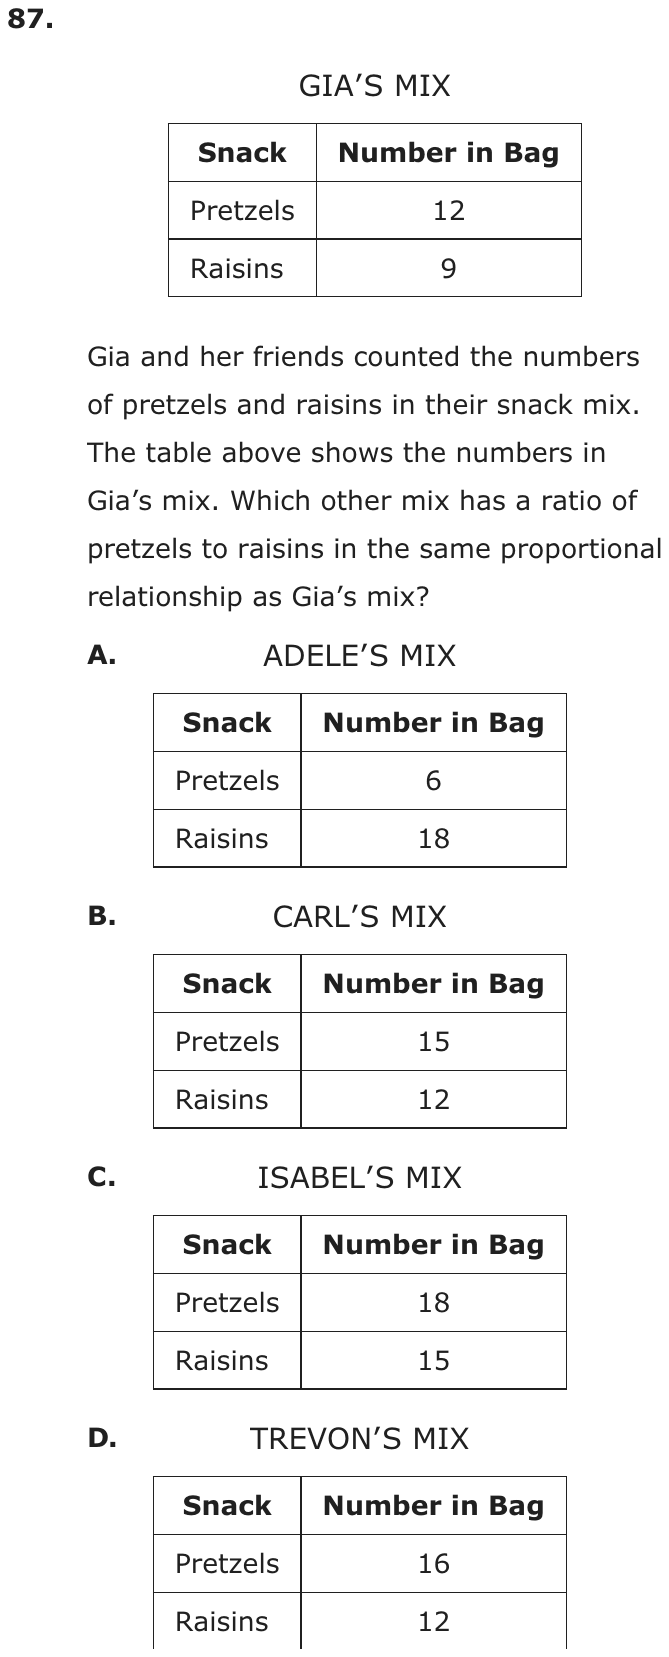
GIA’S MIX
| Snack | Number in Bag |
|---|---|
| Pretzels | 12 |
| Raisins | 9 |
Gia and her friends counted the numbers of pretzels and raisins in their snack mix. The table above shows the numbers in Gia’s mix. Which other mix has a ratio of pretzels to raisins in the same proportional relationship as Gia’s mix?
- A
ADELE’S MIX
Snack Number in Bag Pretzels 6 Raisins 18 - B
CARL’S MIX
Snack Number in Bag Pretzels 15 Raisins 12 - C
ISABEL’S MIX
Snack Number in Bag Pretzels 18 Raisins 15 - D
TREVON’S MIX
Snack Number in Bag Pretzels 16 Raisins 12
Show the answer
Correct answer: D
The ratio of pretzels to raisins in Gia’s bag of snack mix, , is equivalent to the ratio of pretzels to raisins in Trevon’s bag, .
Question analysis
Gia's snack mix table lists how many pretzels and raisins are in her bag, and four friends' tables list theirs. Students pick the mix whose ratio of pretzels to raisins matches Gia's. It tests equivalent ratios and proportional relationships, and some mixes look close at a glance, so each ratio has to be tested exactly.
- Grade level
- Grade 7 content, by NYS standard
- Compared with grade 7
- At grade 7 Testing whether two ratios are equivalent is core grade 7 proportional reasoning. The numbers are small whole numbers in four short tables, so the work is routine, though every table has to be checked against Gia's.
- Estimated difficulty
- Straightforward: two steps or one careful reading.
- Thinking it demands
- Depth of knowledge 2, skills and concepts · mainly apply
- What makes it hard
- Solution
- 2 steps
- Reading level
- Question and choices: about grade 4, 77 words.
- Students, last 30 days
- Not enough answers yet to show (it takes 10).
Why it is hard, traps and wrong answers (shows the answer)
Why it is hard
A short ratio check made harder only by an additive pull: Carl's and Isabel's mixes keep the gap of 3 between pretzels and raisins that Gia's mix has, so students who compare differences instead of ratios see two matches. Reducing every table to lowest terms, Gia's 12:9 to 4:3, shows that exactly one mix keeps the ratio.
Every choice must be checked minor Choosing the answer
Each of the four tables has to be reduced in turn, to 1:3, 5:4, 6:5 and 4:3, because none of them can be ruled out at a glance. (Embretson & Wetzel, 1987)
Reading a figure, table or graph minor Understanding the question
The counts sit in five separate tables, and pretzels must stay first in every ratio, in the same order as Gia's 12 pretzels to 9 raisins. (Lesh, Post & Behr, 1987; Kirsch & Mosenthal, 1990)
Strategy: Simplify the pretzels-to-raisins ratio in Gia's table to lowest terms, then simplify each other mix's ratio in the same order and compare.
Traps
- Misunderstands the concept: A wrong belief about a concept: that percents can be added, that area grows like length, that averages can be averaged, that a bigger denominator means a bigger fraction.
The wrong answers, classified
A Misunderstands the concept (Smith, diSessa & Roschelle, 1993; De Bock et al., 1998; Ni & Zhou, 2005)
Halves Gia's 12 pretzels and doubles her 9 raisins, which keeps the product 108 the same but changes the ratio from 4:3 to 1:3.
B Misunderstands the concept (Smith, diSessa & Roschelle, 1993; De Bock et al., 1998; Ni & Zhou, 2005)
Adds 3 to both of Gia's counts, 12 + 3 and 9 + 3, keeping the difference of 3 instead of the ratio; 15:12 reduces to 5:4.
C Misunderstands the concept (Smith, diSessa & Roschelle, 1993; De Bock et al., 1998; Ni & Zhou, 2005)
Adds 6 to both counts, giving 18 and 15, so pretzels still outnumber raisins by 3, but 18:15 reduces to 6:5, not 4:3.
Worked solution, step by step
Formulas used
- Equivalent ratios
- a and b are the two amounts being compared, in order. k is any number that divides both evenly. Dividing both amounts by the same number keeps the ratio the same. When no number but 1 divides both, the ratio is in simplest form.
Sort out the question
A ratio compares two amounts. Gia’s mix has 12 pretzels and 9 raisins. So her ratio of pretzels to raisins is 12 : 9.
The “same proportional relationship” means the ratios are equal once you simplify them. For example, 2 : 1 and 6 : 3 are equal. Always keep pretzels first and raisins second.
Simplify Gia’s ratio
Both 12 and 9 can be divided by 3. So divide both by 3.
Gia’s mix has 4 pretzels for every 3 raisins.
Simplify each other mix
Do the same for each choice. Divide both numbers by the biggest number that goes into both.
Choice Pretzels : raisins Divide by Simplest form A, Adele 6 : 18 6 1 : 3 B, Carl 15 : 12 3 5 : 4 C, Isabel 18 : 15 3 6 : 5 D, Trevon 16 : 12 4 4 : 3 Pick the matching mix
Only Trevon’s mix simplifies to 4 : 3, the same as Gia’s.
Watch out: Carl’s and Isabel’s mixes each have 3 more pretzels than raisins, just like Gia’s. But adding the same number to both amounts changes the ratio. Equal ratios come from multiplying or dividing. That trap leads to choice B or C.
So the answer is D, Trevon’s mix.
Check your answer
Go the other way. Multiply both parts of 4 : 3 by 4. You get 16 : 12, which are Trevon’s exact numbers. You can also divide pretzels by raisins. Both and equal .
More questions like this
The original DOE question
Question 5 of 5
2022 Test B Math, question 52Question
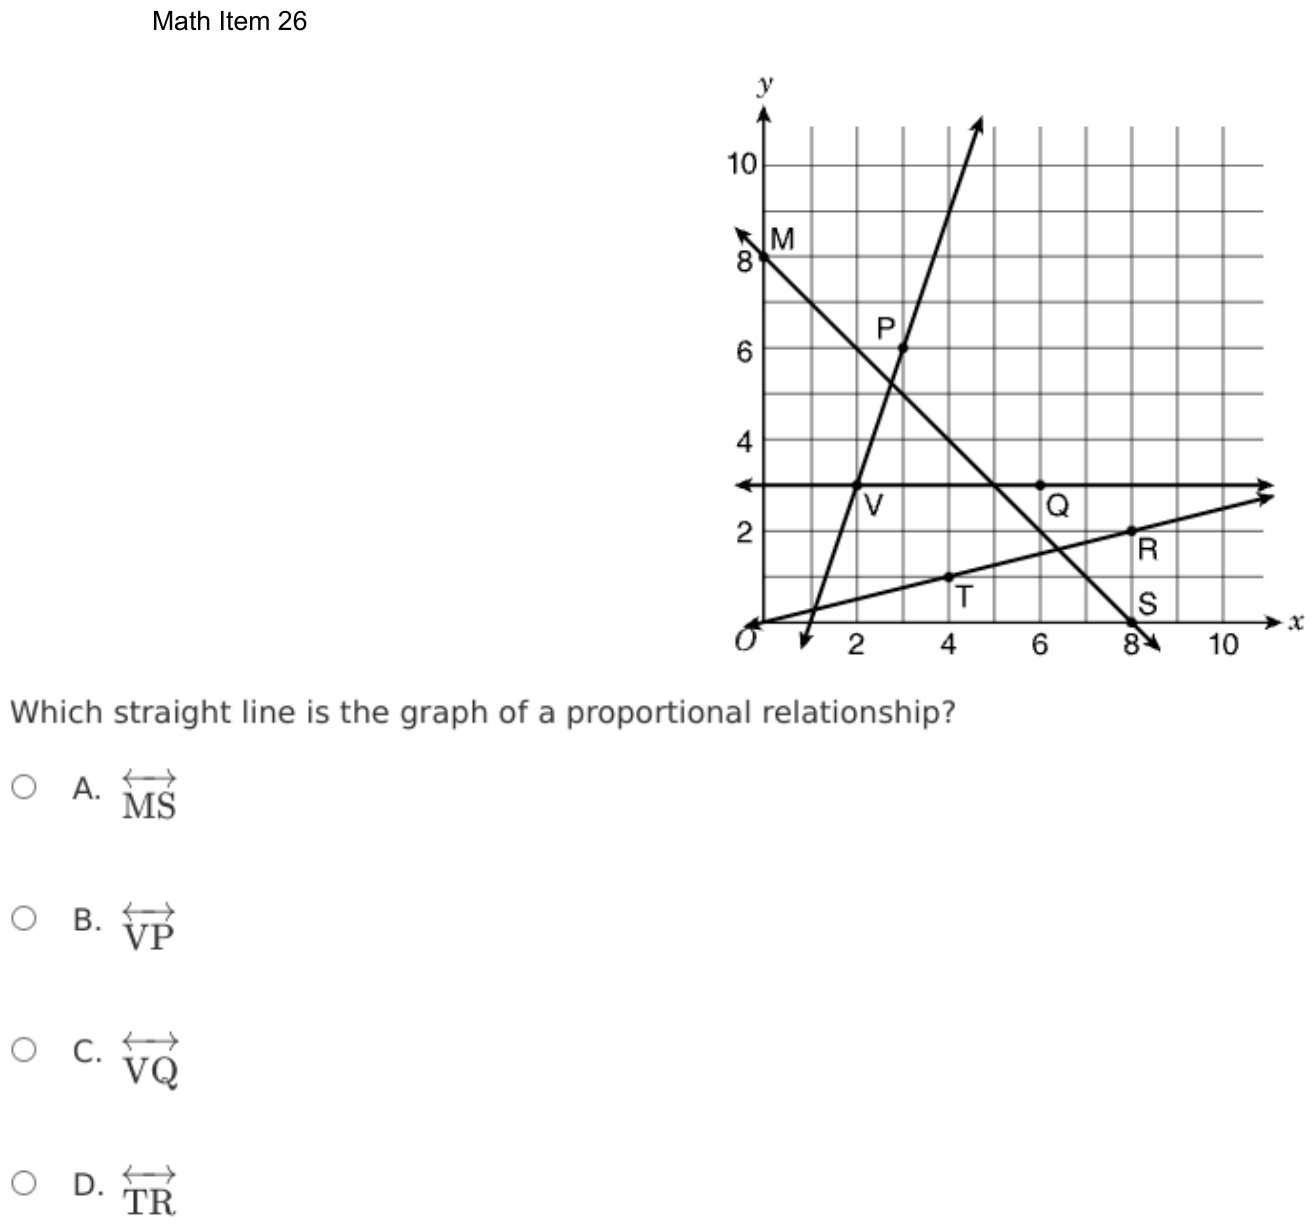
A farmer has 100 apples and will eat 2 apples per day. Is there a proportional relationship between the number of apples remaining and the number of days that have passed?
- Ano, because the relationship does not include 99 as a number of apples
- Bno, because the ordered pair (0, 0) is not part of the relationship
- Cyes, because all the values in the relationship are even
- Dyes, because the number of apples is decreasing at a constant rate
Show the answer
Correct answer: B
Proportional relationships are relationships between two variables where their ratios are equivalent. The graph of a proportional relationship will always go through the point (0, 0).
In the text of the problem, it is given that the farmer begins with 100 apples. Therefore, the ordered pair (0, 100) would be the point at which the graph of the relationship crosses the y-axis, not (0, 0). Additionally, in a proportional relationship, each pair of values represents the same ratio of .
If the relationship were proportional, the ratio for the first two days (1, 98) and (2, 96) would be equivalent.
Question analysis
A farmer starts with 100 apples and eats 2 apples per day. Students decide whether the number of apples remaining and the number of days that have passed are in a proportional relationship, choosing a yes or no answer with its reason. It tests the definition of a proportional relationship, and every reason offered has to be judged, not just the verdict.
- Grade level
- Grade 7 content, by NYS standard
- Compared with grade 7
- At grade 7 Deciding whether two quantities are proportional is core grade 7 work. Here there is no table or graph to check, only a description, so students must produce pairs of values themselves before testing them.
- Estimated difficulty
- Moderate: several steps, or a close reading with one strong distractor.
- Thinking it demands
- Depth of knowledge 2, skills and concepts · mainly understand
- What makes it hard
- Something you must already know moderate
- Every choice must be checked moderate
- Turning words into math minor
- Solution
- 2 steps
- Reading level
- Question and choices: about grade 7, 74 words.
- Students, last 30 days
- Not enough answers yet to show (it takes 10).
Why it is hard, traps and wrong answers (shows the answer)
Why it is hard
The situation is clearly linear, a steady drop of 2 apples a day, and that is the trap: a constant rate of change sounds like proportionality. The relationship starts at 100 apples on day 0, not at 0, so the ratio of apples to days falls from 98 to 48 between days 1 and 2. Half the choices say no, and only one of those gives a reason that decides the question.
Something you must already know moderate Working it out
The tests for a proportional relationship are not given: apples over days must be one constant ratio, and the graph must pass through (0, 0), which day 0 with 100 apples does not. (Anderson & Krathwohl, 2001)
Every choice must be checked moderate Choosing the answer
Each choice pairs a verdict with a reason, so a right “no” with a wrong reason, the missing 99, has to be ruled out as firmly as a wrong “yes”. (Embretson & Wetzel, 1987)
Turning words into math minor Understanding the question
No table or graph is given, so the pairs have to be built from the words: 100 apples on day 0, 98 on day 1, 96 on day 2. (Hegarty, Mayer & Monk, 1995; Koedinger & Nathan, 2004)
Strategy: List the apples left after 0, 1 and 2 days, recall the two tests for a proportional relationship, and keep only a choice whose reason is both true and decisive.
Traps
- Misunderstands the concept: A wrong belief about a concept: that percents can be added, that area grows like length, that averages can be averaged, that a bigger denominator means a bigger fraction.
The wrong answers, classified
A Misunderstands the concept (Smith, diSessa & Roschelle, 1993; De Bock et al., 1998; Ni & Zhou, 2005)
Has the right verdict, no, but rests it on a true detail that decides nothing: the count skips 99, yet missing values have no bearing on whether ratios are equal.
C Misunderstands the concept (Smith, diSessa & Roschelle, 1993; De Bock et al., 1998; Ni & Zhou, 2005)
Treats the even counts, 100, 98, 96 and so on, as a sign of proportionality, a pattern in the numbers that has nothing to do with a constant ratio.
D Misunderstands the concept (Smith, diSessa & Roschelle, 1993; De Bock et al., 1998; Ni & Zhou, 2005)
Takes a constant rate of change for proportionality: the apples do fall by 2 each day, but they start from 100, not 0, so apples ÷ days is not constant.
Worked solution, step by step
Formulas used
- Proportional relationship
- x and y are two amounts that change together. k is a fixed number, the constant of proportionality. In a proportional relationship, y ÷ x always equals k. When x is 0, y is 0 too, so the graph passes through (0, 0).
Sort out the question
The farmer starts with 100 apples and eats 2 apples each day. You must decide if apples left and days passed are proportional. Each choice gives a yes or a no and a reason. Both parts must be right.
Make a small table
Each day, take away 2 apples.
Days passed 0 1 2 Apples left 100 98 96 As pairs (days, apples), these are (0, 100), (1, 98) and (2, 96).
Test the ratios
If the relationship were proportional, apples ÷ days would be the same every day. Are and equal? Work out each one.
98 is not equal to 48. The ratio changes, so the relationship is not proportional.
Check the point (0, 0)
A proportional graph always passes through (0, 0). Here, on day 0 the farmer has 100 apples, not 0. So that pair is (0, 100). When the apples run out, 50 days have passed: (50, 0). The pair (0, 0) never happens. That is the reason in choice B.
Rule out the other choices
Watch out: choice D is tempting. The apples do drop at a constant rate, 2 each day. But they start at 100, not 0. A steady change alone is not enough.
Choice A is true, since 99 never appears, but it decides nothing. Choice C is about even numbers, which has nothing to do with a steady ratio. So the answer is B.
Check your answer
Try one more day. After 10 days the farmer has apples. Then apples ÷ days is 80 ÷ 10 = 8, not 98 or 48. The ratio keeps changing, so the answer is no, and (0, 0) is missing.
More questions like this
The original DOE question