6.SP.7 long-run relative frequency
Question 1 of 5
2026 Practice Test C Math, question 33Question
A bag contains 40 tiles that are either red, green, or blue. A tile is selected at random, the color is recorded, and the tile is put back in the bag. This process is carried out 120 times, and 18 of those times a red tile is selected. Based on the information, what is the most likely number of red tiles in the bag?
- A6
- B15
- C18
- D30
Show the answer
Correct answer: A
First, determine what fraction of the sample were red tiles, given 18 of the 120 tiles drawn were red.
To predict how many of the actual 40 tiles in the bag are red, multiply 40 by the fraction of red tiles in the sample.
Question analysis
A bag holds 40 red, green and blue tiles, and a tile is drawn and put back 120 times, with red coming up 18 times. Students predict the most likely number of red tiles in the bag. It tests using experimental results to estimate what is in the bag, and the draws outnumber the tiles, which can confuse the scaling.
- Grade level
- Grade 6 content, by NYS standard
- Compared with grade 7
- At grade 7 Predicting from repeated trials is grade 6 probability, and grade 7 students make similar estimates from samples. The twist is scaling down, from 120 draws to a bag of 40 tiles, rather than up to a larger group.
- Estimated difficulty
- Straightforward: two steps or one careful reading.
- Thinking it demands
- Depth of knowledge 2, skills and concepts · mainly apply
- What makes it hard
- Solution
- 2 steps
- Reading level
- Question and choices: about grade 6, 61 words.
- Students, last 30 days
- Not enough answers yet to show (it takes 10).
Why it is hard, traps and wrong answers (shows the answer)
Why it is hard
There are more draws than tiles, which is what makes this unusual: the 120 draws must be scaled down to a bag of 40, not up to a bigger group. Red came up 18 times because each tile went back in the bag, so 18 is not a count of red tiles. Since there are three draws for every tile, dividing the 18 red draws by 3 gives the same estimate as taking 3/20 of 40.
Turning words into math minor Understanding the question
The 18 red draws come from 120 draws with the tile put back each time, so they give a share, 3/20, to take of the 40 tiles, not a count of red tiles. (Hegarty, Mayer & Monk, 1995; Koedinger & Nathan, 2004)
Something you must already know minor Working it out
Students must know that the share of red in repeated draws estimates the share of red tiles in the bag; the stem never says to multiply 40 by that share. (Anderson & Krathwohl, 2001)
Strategy: Write the red draws as a fraction of all 120 draws, simplify it, and take that same fraction of the 40 tiles in the bag.
Traps
- Stops one step early: A choice is a number from partway through the solution.
- Numbers taken from the question: Combines the numbers in the question without a model of the situation, or is simply a number that appears in the question.
The wrong answers, classified
B Stops one step early (King et al., 2004; Gierl et al., 2017)
Finds that red came up in 18 of 120 draws, or 15%, and gives 15 as the count, stopping before taking that share of the 40 tiles.
C Numbers taken from the question (Hegarty, Mayer & Monk, 1995)
Gives 18, the number of times red was drawn, as the number of red tiles, though each tile went back and could be drawn many times.
D Little reason to choose it (Haladyna & Downing, 1993; Rodriguez, 2005)
No working from 18 red draws in 120 gives 30 red tiles, three quarters of the bag, when red came up in fewer than one draw in six.
Worked solution, step by step
Formulas used
- Predicting from repeated draws
- The fraction is the share of draws that came up red. That share is your best guess for the share of tiles that are red. Multiply it by the number of tiles in the bag to predict the red tiles. The sign ≈ means about equal.
Sort out the question
The bag has 40 tiles, each red, green or blue. A tile is drawn, its color is written down, and it goes back in the bag. This happens 120 times, and red comes up 18 times.
You need the most likely number of red tiles in the bag.
See why 18 is not the answer
Each tile goes back in the bag after it is drawn. So the same red tile can be drawn again and again. That means 18 counts draws, not tiles.
Watch out: choice C, 18, mixes up the number of red draws with the number of red tiles.
Find the share of red draws
Red came up 18 times out of 120. Simplify by dividing the top and bottom by 6:
As a decimal, that is 0.15, or 15%.
Watch out: 15 is a percent here, not a number of tiles. Stopping now gives choice B.
Take that share of the bag
Use the same share of the 40 tiles in the bag:
So about 6 of the 40 tiles are red.
Give the answer
The best prediction is 6 red tiles. The other 34 tiles are probably green or blue.
So the answer is A, 6.
Check your answer
There were 120 draws for 40 tiles. That is 3 draws for every tile. So divide the red draws by 3: . Same answer. Choice D, 30 red tiles, would be three quarters of the bag. Then red would come up far more than 18 times.
More questions like this
The original DOE question
Question 2 of 5
2024 Test A Math, question 15Question
A program on a computer randomly generates a sequence of whole numbers from 1 to 9, inclusive. If the computer generates a sequence of 300 numbers, what is the best prediction of the number of odd numbers in the sequence?
- A120
- B133
- C150
- D167
Show the answer
Correct answer: D
There are five odd numbers in the range 1 through 9: 1, 3, 5, 7, and 9.
So the proportion of odd numbers in the range 1 through 9 is .
The expected number of odd values in the sequence from the computer program is
So the best prediction for the number of odd numbers in the sequence is 167.
Question analysis
A probability question: a computer randomly generates 300 whole numbers from 1 to 9, and students predict how many will be odd. It asks students to find the probability of an odd number and use it to predict a count. Counting carefully which of the nine numbers are odd, and rounding the prediction sensibly, are the points to watch.
- Grade level
- Grade 6 content, by NYS standard
- Compared with grade 7
- At grade 7 Using a probability to predict how often an event happens is grade 6 and 7 work. This takes two short steps plus a rounding decision, about the demand of a typical grade 7 probability task.
- Estimated difficulty
- Straightforward: two steps or one careful reading.
- Thinking it demands
- Depth of knowledge 2, skills and concepts · mainly apply
- What makes it hard
- Solution
- 3 steps
- Reading level
- Question and choices: about grade 11, 37 words.
- Students, last 30 days
- Not enough answers yet to show (it takes 10).
Why it is hard, traps and wrong answers (shows the answer)
Why it is hard
The method is short, a probability times 300, so the question is decided by the probability. Odd and even feel like an even split, and half of 300 is a listed choice, but the numbers 1 to 9 hold five odd and four even. Listing the nine numbers before computing removes the trap, and the result, about 167, then needs only rounding.
Turning words into math minor Understanding the question
The phrase "whole numbers from 1 to 9, inclusive" means nine equally likely values, five of them odd, so the chance of odd is 5/9, not the one half that odd and even suggest. (Hegarty, Mayer & Monk, 1995; Koedinger & Nathan, 2004)
Something you must already know minor Working it out
The stem never says that an expected count is the probability times the number of trials, here 5/9 of the 300 numbers generated. (Anderson & Krathwohl, 2001)
Error-prone arithmetic minor Working it out
The product 300 × 5/9 is 166.67, not a whole number, so the prediction has to be rounded to the nearest whole number. (Brown & Burton, 1978; Junker & Sijtsma, 2001)
Strategy: Count the odd numbers from 1 to 9, write the probability as that count over 9, and multiply by 300, rounding to the nearest whole number.
Traps
- Misunderstands the concept: A wrong belief about a concept: that percents can be added, that area grows like length, that averages can be averaged, that a bigger denominator means a bigger fraction.
- Answers a different question: A choice is right for another quantity: the other unknown, the rest instead of the part, the part instead of the whole.
The wrong answers, classified
A Little reason to choose it (Haladyna & Downing, 1993; Rodriguez, 2005)
No count of the nine numbers gives 120, which is 40% of 300; reaching it takes two errors at once, so it mostly attracts guesses.
B Answers a different question (King et al., 2004; Hegarty, Mayer & Monk, 1995)
Counts the four even numbers instead of the five odd ones and predicts 4/9 of 300, about 133.
C Misunderstands the concept (Smith, diSessa & Roschelle, 1993; De Bock et al., 1998; Ni & Zhou, 2005)
Assumes odd and even numbers are equally likely and takes half of 300, ignoring that 1 to 9 holds one more odd number than even.
Worked solution, step by step
Formulas used
- Probability
- P is the probability, the chance that something happens. Possible results are all the results that are equally likely. Wanted results are the ones you are looking for. The chance is the fraction of the results that you want.
- Expected count
- E is the expected count, your best guess of how many times something will happen. P is its probability, and n is the number of tries. If something happens 5 times out of 9, it should happen about 5 ninths of the time in many tries.
Sort out the question
The computer picks whole numbers from 1 to 9. Inclusive means 1 and 9 count too. Randomly means each number has the same chance. It picks 300 numbers. You need the best guess of how many of them are odd.
Count the odd numbers
An odd number does not split evenly by 2. From 1 to 9, the odd numbers are 1, 3, 5, 7 and 9. That is 5 of the 9 numbers. The even ones, 2, 4, 6 and 8, are only 4. Watch out: odd and even are not equally likely here, since there is one more odd number. Taking half of 300 gives 150, choice C.
Find the chance of odd
Each number the computer picks has a 5 in 9 chance of being odd. Watch out: do not use the 4 even numbers. That gives about 133, choice B.
Multiply by the 300 numbers
The sign ≈ means about. You can’t have part of a number, so round to the nearest whole number. 166.7 is closer to 167 than to 166. So the answer is D, 167.
Check your answer
The odd numbers are a bit more than half of the nine. So the answer should be a bit more than half of 300, which is 150. Only 167 is a bit more than 150. Also, 167 odd plus about 133 even makes 300.
More questions like this
The original DOE question
Question 3 of 5
2023 Test B Math, question 1Question
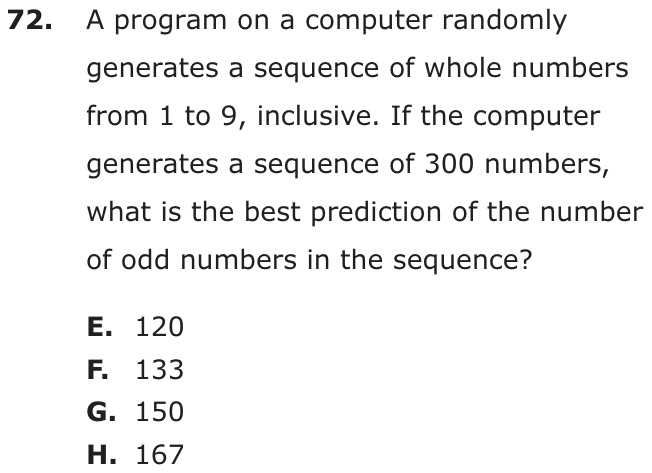
LAST YEAR’S TOTAL SALES
| Vehicles | Number |
|---|---|
| Four-door cars | 5,850 |
| Two-door cars | 2,250 |
| Trucks | 900 |
| Total | 9,000 |
The table above shows the number of each type of vehicle sold at a dealership last year. If 1,000 vehicles will be sold next month, what is the best estimate (based on last year’s sales) of the number of two-door cars that will be sold?
Grid-in question: work out the answer and enter it as a number.
Show the answer
Correct answer: 250
Let x represent the number of two-door cars that will be sold next month. Use the information in the table to set up a proportion:
Question analysis
A table shows last year's sales at a car dealership: four-door cars, two-door cars and trucks, 9,000 vehicles in all. This grid-in asks for the best estimate of how many two-door cars will be sold next month if 1,000 vehicles are sold. Students set up a proportion from the table; most of its rows are not needed.
- Grade level
- Grade 6 content, by NYS standard
- Compared with grade 7
- Below grade 7 Grade 7 proportion problems often take several steps or awkward numbers. This one scales a single share from a table to a new total, with numbers that divide cleanly, which is closer to grade 6 ratio work.
- Estimated difficulty
- Straightforward: two steps or one careful reading.
- Thinking it demands
- Depth of knowledge 2, skills and concepts · mainly apply
- What makes it hard
- Solution
- 2 steps
- Reading level
- Question and choices: about grade 4, 55 words.
- Students, last 30 days
- Not enough answers yet to show (it takes 10).
Why it is hard, traps and wrong answers (shows the answer)
Why it is hard
Once the share is seen as 2,250 out of 9,000, a quarter, the arithmetic is light, which makes this one of the easier grid-ins. Points are lost by entering the share itself as a percent, by reading the wrong row of the table, or by building a monthly average when the question supplies next month’s total. With no choices to compare, checking that the entry is a quarter of 1,000 is the only safeguard.
Turning words into math minor Understanding the question
The phrase “best estimate (based on last year’s sales)” has to become a proportion: two-door cars keep the same share of next month’s 1,000 vehicles as of last year’s 9,000. (Hegarty, Mayer & Monk, 1995; Koedinger & Nathan, 2004)
Reading a figure, table or graph minor Understanding the question
The table lists three vehicle types and a total; only the two-door row, 2,250, and the 9,000 total are needed, so the four-door and truck rows are distractions. (Lesh, Post & Behr, 1987; Kirsch & Mosenthal, 1990)
Strategy: Find what fraction of last year's 9,000 vehicles were two-door cars, simplify it, then take that fraction of the 1,000 vehicles expected next month.
Traps
- Stops one step early: A choice is a number from partway through the solution.
- Information you don't need: The question gives numbers or facts that play no part in the answer.
The wrong answers, classified
25 Stops one step early (King et al., 2004; Gierl et al., 2017)
Finds that 2,250 of 9,000 sales is 25 percent and enters that percent, stopping before taking a quarter of next month’s 1,000 vehicles.
650 Misreads the figure (Lesh, Post & Behr, 1987; Kirsch & Mosenthal, 1990)
Reads the four-door row instead of the two-door row and scales it correctly: 5,850 of 9,000 is 650 of 1,000.
187.5 Misreads the question (Hegarty, Mayer & Monk, 1995)
Divides last year’s 2,250 two-door sales by 12 months, a monthly average that ignores the stated 1,000 vehicles for next month.
Worked solution, step by step
Formulas used
- Proportion
- A proportion says two fractions are equal. Each fraction here is a part over its whole: two-door cars over all vehicles sold. Use it when a share stays the same while the total changes. Then you can find the missing part.
Sort out the question
The table shows last year’s sales. In all, 9,000 vehicles were sold, and 2,250 of them were two-door cars. Next month, 1,000 vehicles will be sold. You need about how many of them will be two-door cars.
“Based on last year’s sales” means two-door cars keep the same share of all sales. A share is a part out of a whole. The four-door and truck rows don’t matter here.
Find last year’s share of two-door cars
Last year, 2,250 out of 9,000 vehicles were two-door cars. Write that as a fraction and simplify it.
This works because . So 1 out of every 4 vehicles sold was a two-door car.
Set up the proportion and solve
Let x be the number of two-door cars next month. Next month’s share must match last year’s share.
To get x alone, multiply both sides by 1,000.
So about 250 two-door cars will be sold.
Give the answer
Watch out: one fourth is the same as 25%. Gridding 25 gives the percent, not the number of cars. Also be sure to use the two-door row. The four-door row would give 650. So you would grid 250.
Check your answer
Try it another way. Next month’s 1,000 vehicles are of last year’s 9,000. So take of the 2,250 two-door cars: . Both ways give 250 cars.
More questions like this
The original DOE question
Question 4 of 5
2022 Test A Math, question 41Question
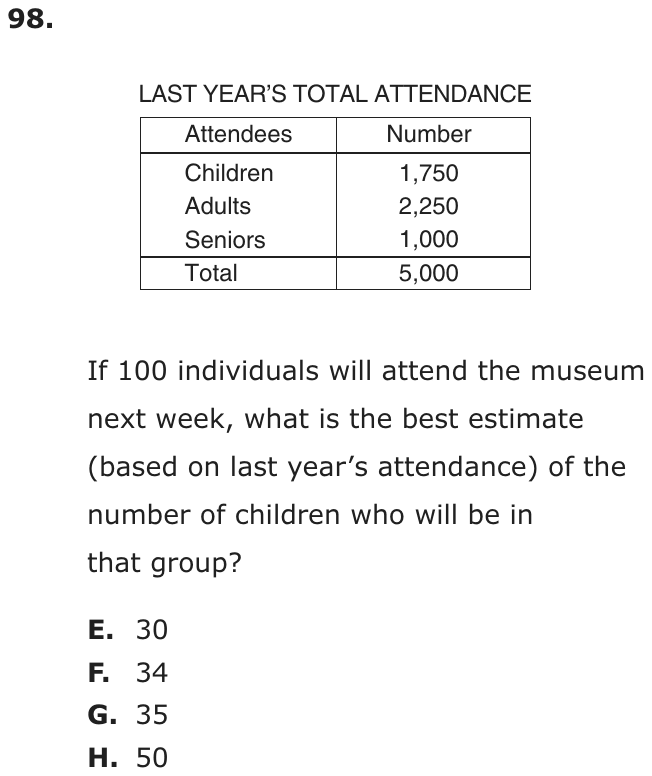
LAST YEAR’S TOTAL ATTENDANCE
| Attendees | Number |
|---|---|
| Children | 1,750 |
| Adults | 2,250 |
| Seniors | 1,000 |
| Total | 5,000 |
If 100 individuals will attend the museum next week, what is the best estimate (based on last year’s attendance) of the number of children who will be in that group?
- A30
- B34
- C35
- D50
Show the answer
Correct answer: C
First, determine what percentage of the total attendees last year were children.
The best estimate based on last year’s attendance is 35% of 100.
Question analysis
A table gives last year's attendance by children, adults and seniors, 5,000 people in all. If 100 people attend the museum next week, students estimate how many of them will be children. It tests using a ratio or percent from data to make a prediction; only the children's row and the total matter.
- Grade level
- Grade 6 content, by NYS standard
- Compared with grade 7
- Below grade 7 Using last year's share of visitors to predict a smaller group is grade 6 ratio and probability work. A group of exactly 100 makes the scaling easy, so the arithmetic is lighter than in typical grade 7 proportion problems.
- Estimated difficulty
- Straightforward: two steps or one careful reading.
- Thinking it demands
- Depth of knowledge 2, skills and concepts · mainly apply
- What makes it hard
- Solution
- 2 steps
- Reading level
- Question and choices: about grade 5, 38 words.
- Students, last 30 days
- Not enough answers yet to show (it takes 10).
Why it is hard, traps and wrong answers (shows the answer)
Why it is hard
The share 1,750 out of 5,000 converts neatly to 35 out of 100, and next week's group happens to be exactly 100, so the arithmetic is nearly done once the proportion is written. Points slip away when a student works out the scale factor between the two totals and gives it, or estimates the share instead of computing it. Dividing 1,750 by 50 checks the result.
Turning words into math minor Understanding the question
The phrase “best estimate (based on last year’s attendance)” has to become a proportion: children keep the share of next week's 100 that they had of last year's 5,000. (Hegarty, Mayer & Monk, 1995; Koedinger & Nathan, 2004)
Reading a figure, table or graph minor Understanding the question
Only the children row, 1,750, and the 5,000 total are needed; the adults and seniors rows add numbers that play no part in the estimate. (Lesh, Post & Behr, 1987; Kirsch & Mosenthal, 1990)
Strategy: Find what fraction of last year's 5,000 visitors were children, rewrite it as an equivalent fraction out of 100, and apply it to next week's group.
Traps
- Stops one step early: A choice is a number from partway through the solution.
- Information you don't need: The question gives numbers or facts that play no part in the answer.
The wrong answers, classified
A Little reason to choose it (Haladyna & Downing, 1993; Rodriguez, 2005)
No common working gives 30, which would need 1,500 children last year; it mostly draws students who round the share down or guess a round number.
B Little reason to choose it (Haladyna & Downing, 1993; Rodriguez, 2005)
No common working gives 34; splitting 100 evenly among three groups gives 33 1/3, the closest route, so it mostly draws guesses.
D Stops one step early (King et al., 2004; Gierl et al., 2017)
Divides 5,000 by 100 to get the scale factor, 50, and gives it, stopping before dividing the 1,750 children by that factor.
Worked solution, step by step
Formulas used
- Percent of a total
- The part is the number in one group, here children. The whole is the total of all groups. Dividing gives the fraction of the whole that the group makes up. Times 100 turns it into a percent, a number out of 100.
- Percent of a number
- p is the percent. The whole is the full amount. The part is the piece that matches the percent. Percent means out of 100, so p% is p hundredths of the whole.
Sort out the question
Last year 5,000 people came in all. 1,750 of them were children. Next week 100 people will come. You need the best estimate of how many will be children. Best estimate means children make up the same share as last year. You don’t need the adults and seniors rows.
Find last year’s percent of children
So 35% of last year’s visitors were children. That means 35 out of every 100.
Use that percent for 100 people
About 35 of the 100 people should be children. Watch out: tells how many times bigger last year’s crowd was. It is not a number of children. Don’t pick 50, choice D. So the answer is C, 35.
Check your answer
Shrink both numbers the same way. Since , divide the children by 50 too: . That matches. Also, 1,750 is a bit more than one third of 5,000, and 35 is a bit more than one third of 100.
More questions like this
The original DOE question
Question 5 of 5
2018 Test B Math, question 57Question
Carlos tossed a paper cup in the air 50 times and found that the probability of it landing on its side was 72%. If he tosses the cup in the air 150 more times, what is the total number of times he can expect the cup to land on its side?
- A72
- B108
- C144
- D158
Show the answer
Correct answer: C
The probability of the cup landing on its side is 72%. Carlos tossed the cup a total of 200 times (50 + 150). The number of times the cup lands on its side is 72% of 200:
0.72 × 200 = 144.
Question analysis
Carlos tossed a paper cup 50 times and found it landed on its side 72% of the time. If he tosses it 150 more times, students predict the total number of side landings he can expect. It tests using a probability to predict outcomes, and the word total decides which tosses to count.
- Grade level
- Grade 6 content, by NYS standard
- Compared with grade 7
- At grade 7 Predicting outcomes from a probability is grade 6 content, and the arithmetic is a single percent. What lifts it to grade 7 level is deciding exactly which tosses the word "total" refers to.
- Estimated difficulty
- Moderate: several steps, or a close reading with one strong distractor.
- Thinking it demands
- Depth of knowledge 2, skills and concepts · mainly apply
- What makes it hard
- Turning words into math moderate
- Something you must already know minor
- Solution
- 2 steps
- Reading level
- Question and choices: about grade 8, 48 words.
- Students, last 30 days
- Not enough answers yet to show (it takes 10).
Why it is hard, traps and wrong answers (shows the answer)
Why it is hard
The computation is one multiplication, so the question is decided by what "total" covers. Students who focus on the 150 new tosses answer for part of the experiment, and students who add the original 50 tosses as if every one landed on its side overshoot. Reading the last sentence twice, and noticing the word total, is the safeguard.
Turning words into math moderate Understanding the question
"150 more times" and "the total number of times" together mean all 200 tosses, so the expected count is 72% of 200, not of 150. (Hegarty, Mayer & Monk, 1995; Koedinger & Nathan, 2004)
Something you must already know minor Working it out
Students must know that an expected count is the probability times the number of trials; the stem never says to multiply. (Anderson & Krathwohl, 2001)
Strategy: Decide which tosses the word "total" covers, then multiply that number of tosses by 0.72 to get the expected count.
Traps
- Answers a different question: A choice is right for another quantity: the other unknown, the rest instead of the part, the part instead of the whole.
- Numbers taken from the question: Combines the numbers in the question without a model of the situation, or is simply a number that appears in the question.
The wrong answers, classified
A Numbers taken from the question (Hegarty, Mayer & Monk, 1995)
Reads the 72% as 72 side landings, as if there had been 100 tosses, without applying the percent to the actual tosses.
B Answers a different question (King et al., 2004; Hegarty, Mayer & Monk, 1995)
Takes 72% of only the 150 new tosses, 0.72 × 150 = 108, and leaves out the side landings expected in the first 50.
D Numbers taken from the question (Hegarty, Mayer & Monk, 1995)
Adds all 50 first tosses to the 108 expected from the next 150, as if every early toss had landed on its side.
Worked solution, step by step
Formulas used
- Expected count
- P is the probability, the chance of the result on one try, written as a decimal. n is the number of tries. Multiplying tells how many times you can expect the result. It is a good guess, not a promise.
Sort out what you know
Carlos tossed the cup 50 times. It landed on its side 72% of the time. He will toss it 150 more times. You need “the total number of times” it should land on its side. Total means all the tosses, the first 50 and the next 150.
Count all the tosses
Add the first tosses and the new ones.
There are 200 tosses in all.
Watch out: using only the 150 new tosses gives , choice B.
Change the percent to a decimal
Percent means out of 100. So 72% is 72 out of 100. Move the decimal point two places left.
Multiply to find the expected count
Use the expected count formula with 0.72 and 200 tosses.
He can expect the cup to land on its side 144 times.
Watch out: 72 is the count for 100 tosses, not 200. That is choice A.
Give the answer
All 200 tosses count, so the expected total is 144. So the answer is C, 144.
Check your answer
Split it up. In the first 50 tosses, . In the next 150, . Then . Also, 144 is a bit less than three quarters of 200, which is 150. That fits 72%.
More questions like this
The original DOE question