Question
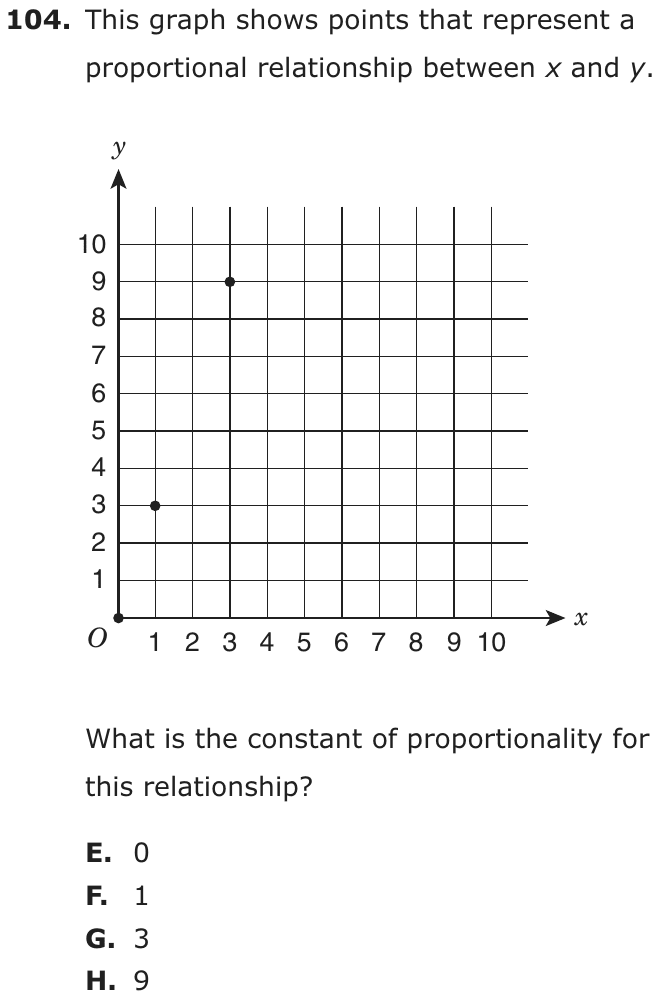
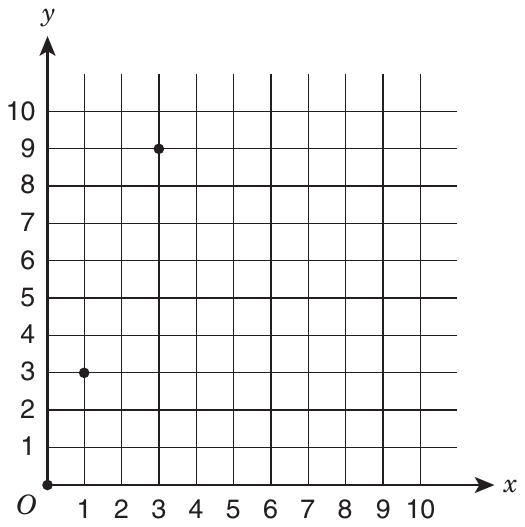
This graph shows points that represent a proportional relationship between x and y.
What is the constant of proportionality for this relationship?
- A0
- B1
- C3
- D9
Show the answer
Correct answer: C
A constant of proportionality, k, is the constant value of the ratio between two proportional values. Two varying values are said to be in a relation of proportionality when their ratio yields a constant. In the graph shown, the proportional relationship between x and y is represented by:
Therefore, the constant of proportionality for the relationship on the graph is:
Question analysis
A coordinate graph shows three points that represent a proportional relationship between x and y, one of them at the origin. Students choose the constant of proportionality. It tests finding the unit rate of a proportional relationship from a graph, and the choices include coordinates read straight off the points.
- Grade level
- Grade 7 content, by NYS standard
- Compared with grade 7
- Below grade 7 Identifying the constant of proportionality on a graph is a named grade 7 skill. With whole-number points on a clear grid, one division settles it, which makes this shorter than most grade 7 proportional reasoning.
- Estimated difficulty
- Routine: one familiar step, little to misread.
- Thinking it demands
- Depth of knowledge 1, recall and reproduction · mainly apply
- What makes it hard
- Solution
- 1 step
- Reading level
- Question and choices: about grade 10, 22 words.
- Corrected from the DOE handbook
- A wrong statement of what makes two quantities proportional was corrected in the explanation.
- Students, last 30 days
- Not enough answers yet to show (it takes 10).
Why it is hard, traps and wrong answers (shows the answer)
Why it is hard
A single division settles it once a point other than the origin is chosen. The point at x = 1 shows the constant directly, and the higher point confirms it. Every wrong choice is a number that can be read straight off the graph, the origin’s 0, a coordinate of 1, or the top point’s 9, so the item rewards dividing rather than reading.
Reading a figure, table or graph minor Understanding the question
The plotted points, (0, 0), (1, 3) and (3, 9), carry no labels, so their coordinates are read off the grid before y is divided by x. (Lesh, Post & Behr, 1987; Kirsch & Mosenthal, 1990)
Something you must already know minor Working it out
The question names the constant of proportionality but not how to find it: k is y ÷ x for any point other than the origin, here 3 ÷ 1 or 9 ÷ 3. (Anderson & Krathwohl, 2001)
Strategy: Pick a plotted point other than the origin, divide its y-coordinate by its x-coordinate, and confirm that another point gives the same quotient.
Traps
- Stops one step early: A choice is a number from partway through the solution.
- Misunderstands the concept: A wrong belief about a concept: that percents can be added, that area grows like length, that averages can be averaged, that a bigger denominator means a bigger fraction.
- Misreads the figure: Reads a value, label or tick spacing in a figure, table or graph wrongly.
The wrong answers, classified
A Misunderstands the concept (Smith, diSessa & Roschelle, 1993; De Bock et al., 1998; Ni & Zhou, 2005)
Takes the value at the origin, (0, 0), as the constant, confusing the constant of proportionality with the y-intercept, which is 0 for every proportional graph.
B Misreads the figure (Lesh, Post & Behr, 1987; Kirsch & Mosenthal, 1990)
Reads the x-coordinate of the unit-rate point (1, 3) instead of its y-coordinate, taking the wrong axis’s value as the constant.
D Stops one step early (King et al., 2004; Gierl et al., 2017)
Reads the y-value of the point (3, 9) and stops before dividing it by that point’s x-value, 3, to get the ratio.
What was corrected from the DOE handbook, and why
- Explanation: The handbook says “Two varying values are said to be in a relation of proportionality when either their ratio or their product yields a constant.” Some general definitions use “proportionality” for both kinds, but a constant product (y = k/x) is inverse proportion, a different relationship whose graph never passes through (0, 0). The proportional relationship this question asks about has a constant ratio y/x, which is how the explanation’s own first sentence defines the constant of proportionality. The site reads “…when their ratio yields a constant.” The answer is unchanged: k = 9/3 = 3/1 = 3.
Worked solution, step by step
Formulas used
- Constant of proportionality
- x and y are the two amounts, read from any point (x, y) except (0, 0). k is the constant of proportionality. In a proportional relationship, y divided by x gives the same number at every point. So y = kx, and y is always k times x.
Sort out the question
The graph shows a proportional relationship between x and y. In one, the ratio y ÷ x is the same at every point. A ratio compares two numbers by division. That steady ratio is the constant of proportionality, k. You need k.
Read the points
For each point, read the bottom axis for x and the side axis for y. The points are (0, 0), (1, 3) and (3, 9).
The point (0, 0) is the origin, where the axes meet. You can’t divide by 0, so use the other two points.
Divide y by x
Use the formula with each point.
Both points give 3. So y is always 3 times x.
Give the answer
Watch out: 9 is the y-value of (3, 9) before you divide, choice D. And 1 is the x-value of (1, 3), choice B. And 0, choice A, comes from the origin. Every proportional graph passes through (0, 0), so the origin can’t tell you k. So the answer is C, 3.
Check your answer
Test each point with y = 3x. When x = 1, . When x = 3, . When x = 0, y = 0. All three points fit, so k = 3.
More questions like this
The original DOE question