Question
A total of 24 students in a math class took a 100-point test:
- None of the students scored 100 points.
- 75% of the students scored less than 82 points.
- The lowest score in the class was 54 points.
Which box plot best represents the test scores from this math class?
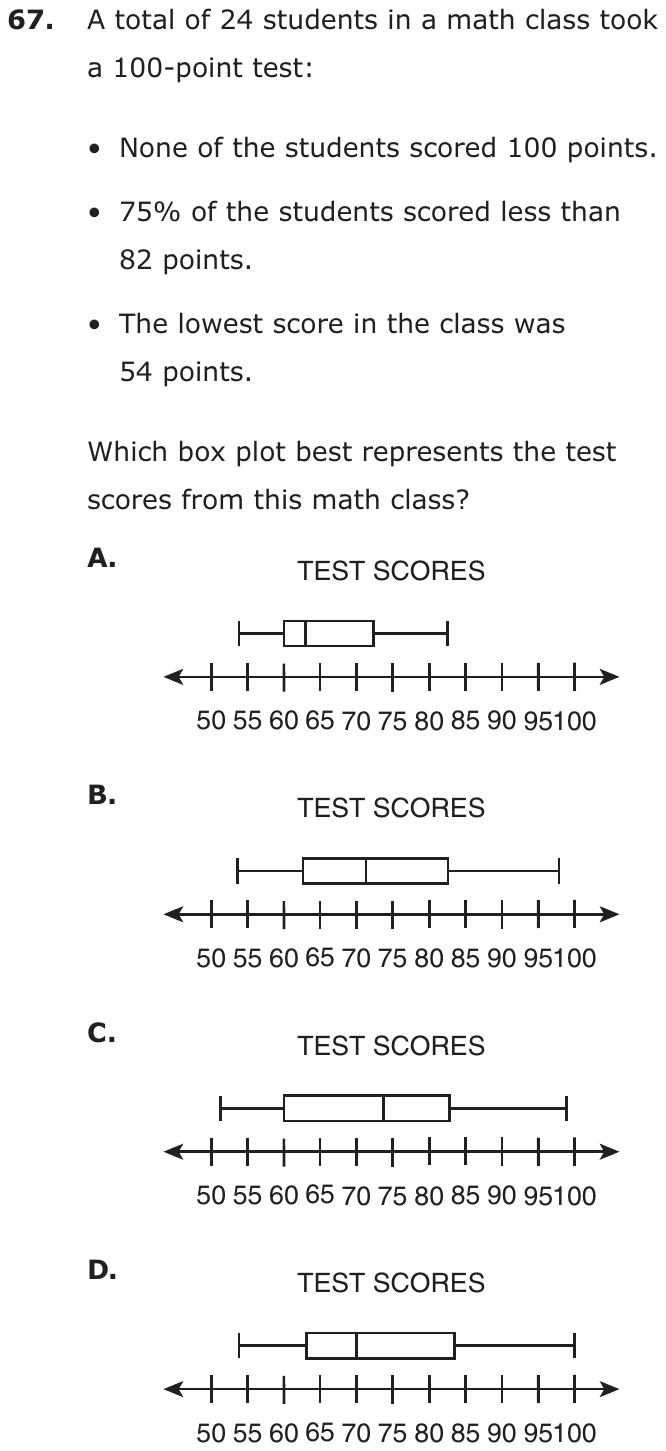
- A
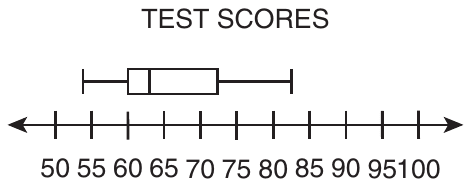
- B
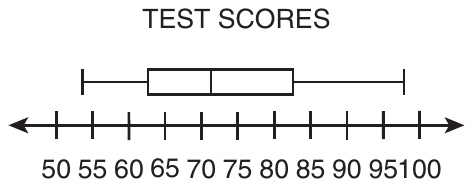
- C
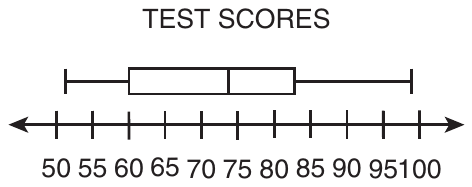
- D
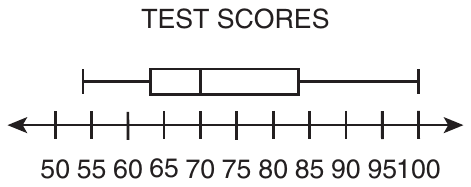
Show the answer
Correct answer: B
Use the information in the bullet points to reason which box plot could represent the data set of test scores.
Since none of the students scored 100, the maximum value on the box plot must be less than 100.
If 75% of the students scored less than 82, then 25% scored 82 points or more. Since the third quartile (Q3) indicates (75%) of the data is to the left and (25%) of the data is to the right, it is reasonable that Q3 would be at or about 82.
Given that the lowest score in the class was 54, the minimum point on the box plot must be 54.
The box plot graph in option B is the only one that meets all three criteria.
Question analysis
Twenty-four students took a 100-point test: nobody scored 100, 75% scored below 82, and the lowest score was 54. Students choose the box plot that fits all three facts. The skill is linking each statement to a part of the plot, the whiskers, the box and the quartiles, and checking every plot closely.
- NYS standards
- 7.SP.1 box plots and interquartile range
- Grade level
- Grade 7 content, by NYS standard
- Compared with grade 7
- At grade 7 Grade 7 students usually read values off a box plot. This item runs the other way, turning a percent statement into a quartile and checking the whiskers against two more facts, but the content stays at grade 7.
- Estimated difficulty
- Moderate: several steps, or a close reading with one strong distractor.
- Thinking it demands
- Depth of knowledge 2, skills and concepts · mainly analyze
- What makes it hard
- Every choice must be checked moderate
- Reading a figure, table or graph moderate
- Something you must already know minor
- Solution
- 3 steps
- Reading level
- Question and choices: about grade 2, 45 words.
- Students, last 30 days
- Not enough answers yet to show (it takes 10).
Why it is hard, traps and wrong answers (shows the answer)
Why it is hard
The question turns three sentences into three features of a box plot, and a plot that matches two of them is easy to accept. The upper-quartile fact is the conceptual one: students who do not know that the box’s right edge marks 75 percent put 82 at the end of the whisker. The other two facts are quick visual checks, but only if every plot is actually checked.
Every choice must be checked moderate Choosing the answer
Each wrong plot fails a different fact, so all four must be tested against all three bullets: the left whisker against 54, the right whisker against 100, and the box’s right edge against 82. (Embretson & Wetzel, 1987)
Reading a figure, table or graph moderate Understanding the question
The axis is labeled every 5 points, and the deciding features fall between labels: one left whisker starts near 51 instead of 54, and box edges sit near 82.5. (Lesh, Post & Behr, 1987; Kirsch & Mosenthal, 1990)
Something you must already know minor Working it out
Nothing explains that “75% of the students scored less than 82” locates the upper quartile, the right edge of the box, rather than the highest score. (Anderson & Krathwohl, 2001)
Strategy: Turn each fact into a feature to check: where the left whisker starts, where the right whisker ends, and where the box ends. Rule out any plot that breaks one.
Traps
- Misreads the question: Misses or misreads a condition or a word in the question: "at least", "each", "remaining", "not".
- Misunderstands the concept: A wrong belief about a concept: that percents can be added, that area grows like length, that averages can be averaged, that a bigger denominator means a bigger fraction.
- Misreads the figure: Reads a value, label or tick spacing in a figure, table or graph wrongly.
The wrong answers, classified
A Misunderstands the concept (Smith, diSessa & Roschelle, 1993; De Bock et al., 1998; Ni & Zhou, 2005)
Puts 82 at the end of the right whisker, as if it were the highest score, when 75 percent below 82 marks the box’s right edge.
C Misreads the figure (Lesh, Post & Behr, 1987; Kirsch & Mosenthal, 1990)
Accepts the left whisker as starting at the lowest score, 54, when it begins near 51, just past the 50 tick.
D Misreads the question (Hegarty, Mayer & Monk, 1995)
Matches the lowest score and the box’s right edge near 82 but overlooks that a whisker reaching 100 means someone scored 100.
Worked solution, step by step
Formulas used
- Parts of a box plot
- A box plot shows five numbers. The left whisker starts at the minimum, the lowest value. The box starts at Q1, the first quartile, and ends at Q3, the third quartile. The line inside is the median, the middle value. The right whisker ends at the maximum. About a quarter of the data falls in each of the four sections.
Sort out the question
24 students took a test. You know three facts. Nobody scored 100. 75% scored less than 82. The lowest score was 54. You need the box plot that fits all three facts.
Turn each fact into a feature
Match each fact to a part of the box plot.
- The lowest score is 54, so the left whisker starts at 54.
- Nobody scored 100, so the right whisker ends before 100.
- 75% is three quarters. Three quarters of the scores are below Q3. So the box should end at about 82.
Read the number line
The ticks are 5 points apart: 50, 55, 60 and so on. A score of 54 sits just left of the 55 tick. A score of 82 sits a little less than halfway from 80 to 85. Look closely, because these points fall between labels.
Check plot A
In plot A, the right whisker ends near 82, and the box ends near 72. That would make 82 the highest score. Watch out: 75% below 82 does not make 82 the top score. It tells you where the box ends. So A is out.
Check plot C
In plot C, the left whisker starts near 51, just right of the 50 tick. But the lowest score was 54. So C is out.
Check plot D
Plot D starts at 54, and its box ends near 82. But its right whisker reaches 100. That means someone scored 100, and nobody did. Watch out: D fits two facts, so it is easy to stop early. Check all three. So D is out.
Check plot B and answer
Plot B starts at 54. Its box ends near 82. Its right whisker stops near 98, below 100. It fits all three facts. So the answer is B.
Check your answer
Go over B once more with all three facts. Its lowest point is 54. Its box ends near 82. Its highest point is under 100. Each other plot breaks one fact: A’s box, C’s left whisker and D’s right whisker.
More questions like this
The original DOE question